Feel free to leave your vote:
0
Share template with others
Summary
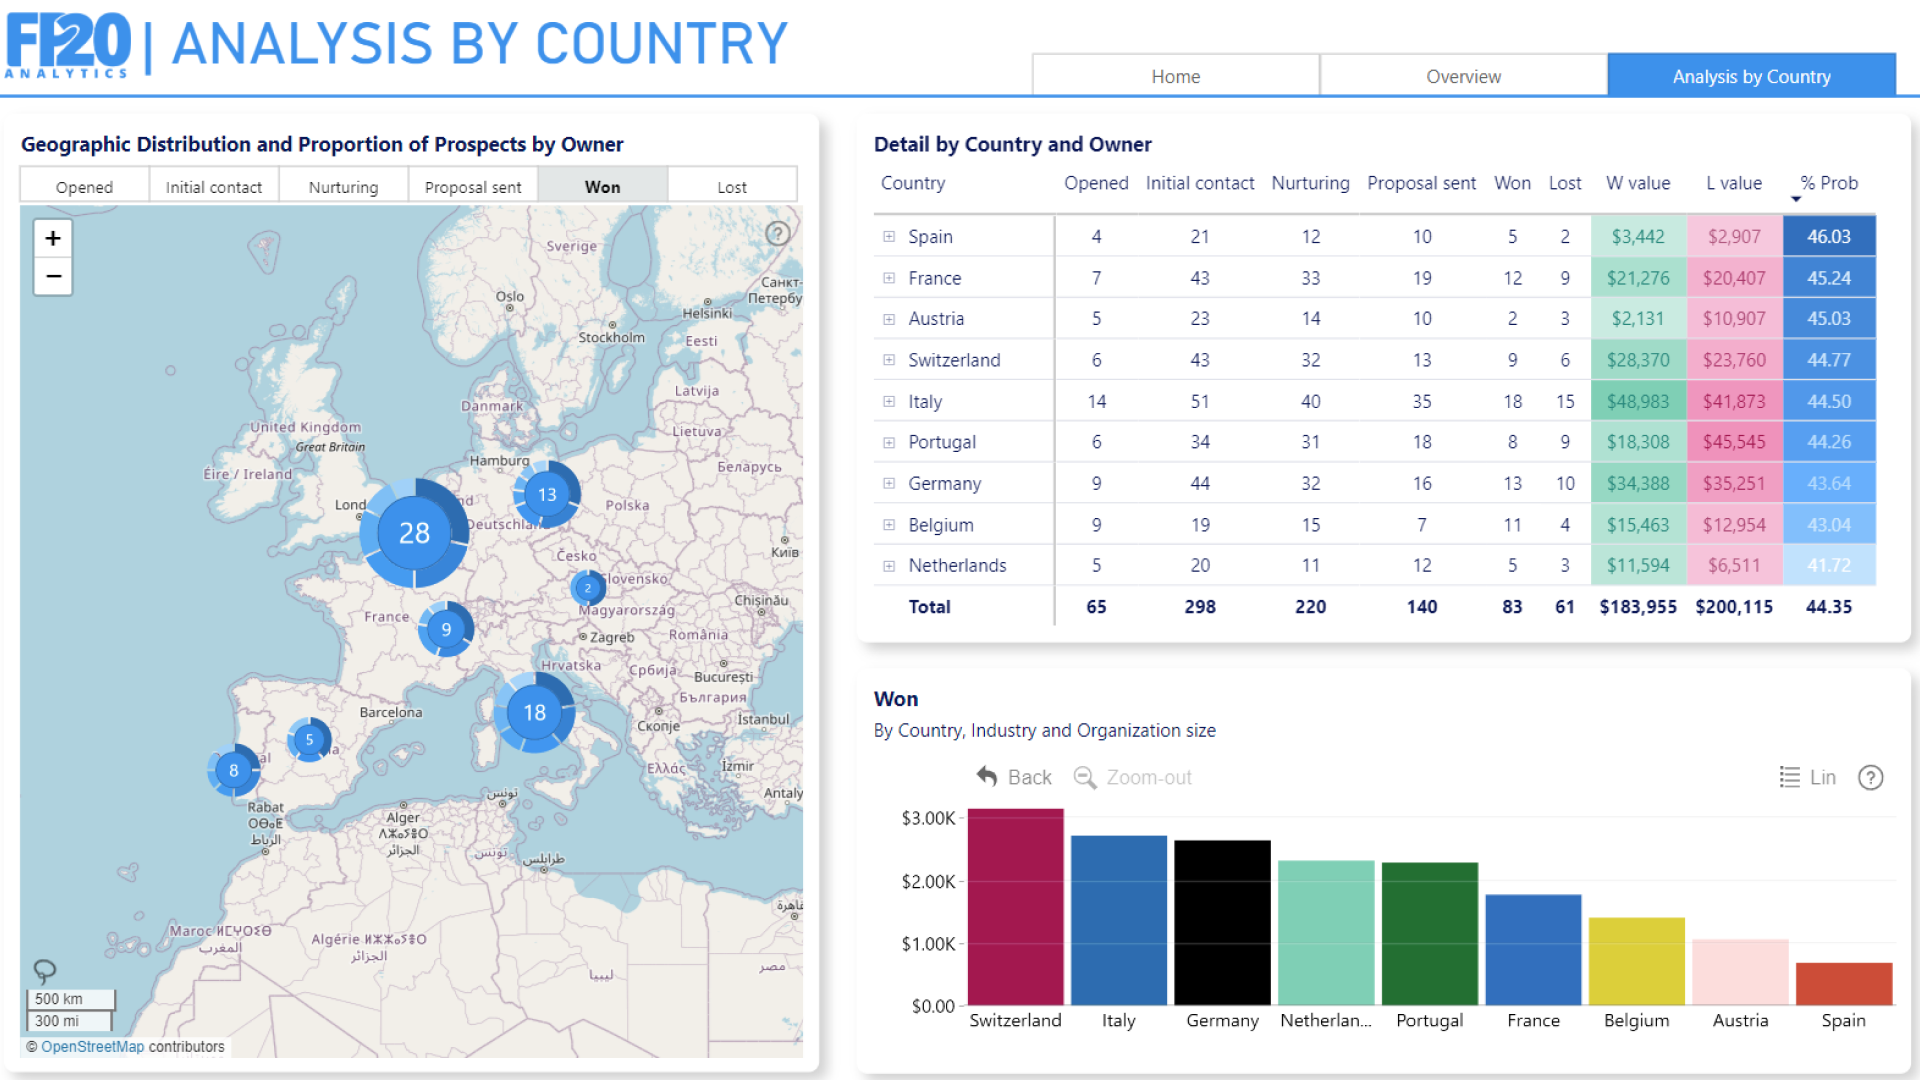
Report submitted for FP20 Analytics ZoomCharts Challenge 17 (July 2024). The report was built with the CRM & Sales Pipeline Analysis dataset and includes ZoomCharts custom Drill Down PRO visuals for Power BI.
Author's description:
This interactive dashboard provides a complete view of the sales process, from initial lead acquisition to final conversion into customers. It visualizes and analyzes the efficiency of each stage of the sales funnel to optimize strategies and improve results.
Mobile view allows you to interact with the report. To Download the template please switch to desktop view.