Feel free to leave your vote:
0
Share template with others
Summary
Report submitted for FP20 Analytics ZoomCharts Challenge 17 (July 2024). The report was built with the CRM & Sales Pipeline Analysis dataset and includes ZoomCharts custom Drill Down PRO visuals for Power BI.
Author's description:
I built a comprehensive analytic report that provides insights into lead distribution across countries, industries, and organization sizes. The report assesses the health of the sales pipeline, forecasts potential income over the next three (3) months, and compares sales agent performance.
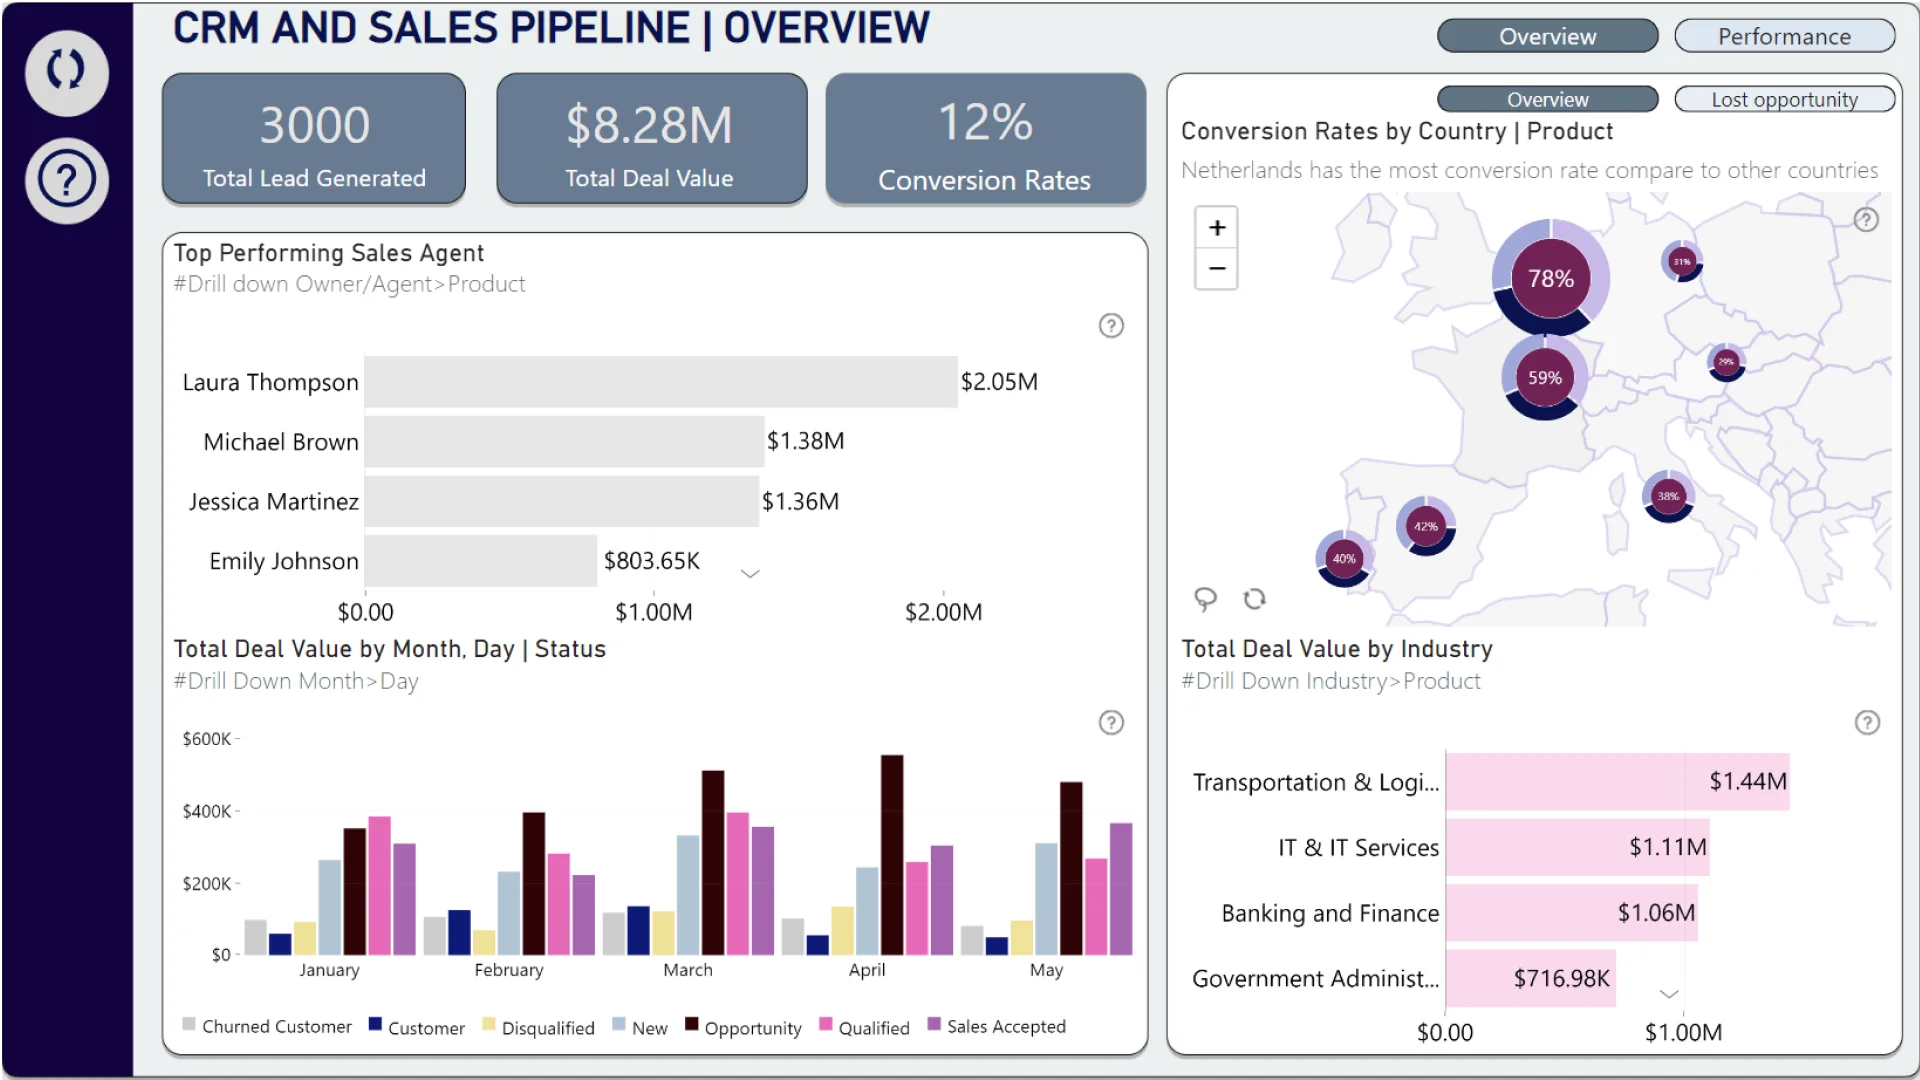
KEY INSIGHTS
1. Generated 3,000 leads with a total potential value of $8.28M, achieving a 12% conversion rate. Closed deals amounted to $931K out of the $8.28M, with a 2% lost opportunity rate.|
2. Laura Thompson has excelled as a sales agent, generating $2.05M in sales with $219K in closed deal value.
3. The Netherlands boasts the highest conversion rate at 47% compared to the countries.
4. The Transportation & Logistics industry leads in deal value, accounting for $1.44M, and has the highest number of lost opportunities with 11 records.
5. The average sales cycle duration is 63.17 days, compared to an average forecast accuracy cycle duration of 196.40.
6. David Wilson has the shortest average sales cycle duration at 51.89 days.
ZoomCharts visuals used
Mobile view allows you to interact with the report. To Download the template please switch to desktop view.