Feel free to leave your vote:
0
Share template with others
Summary
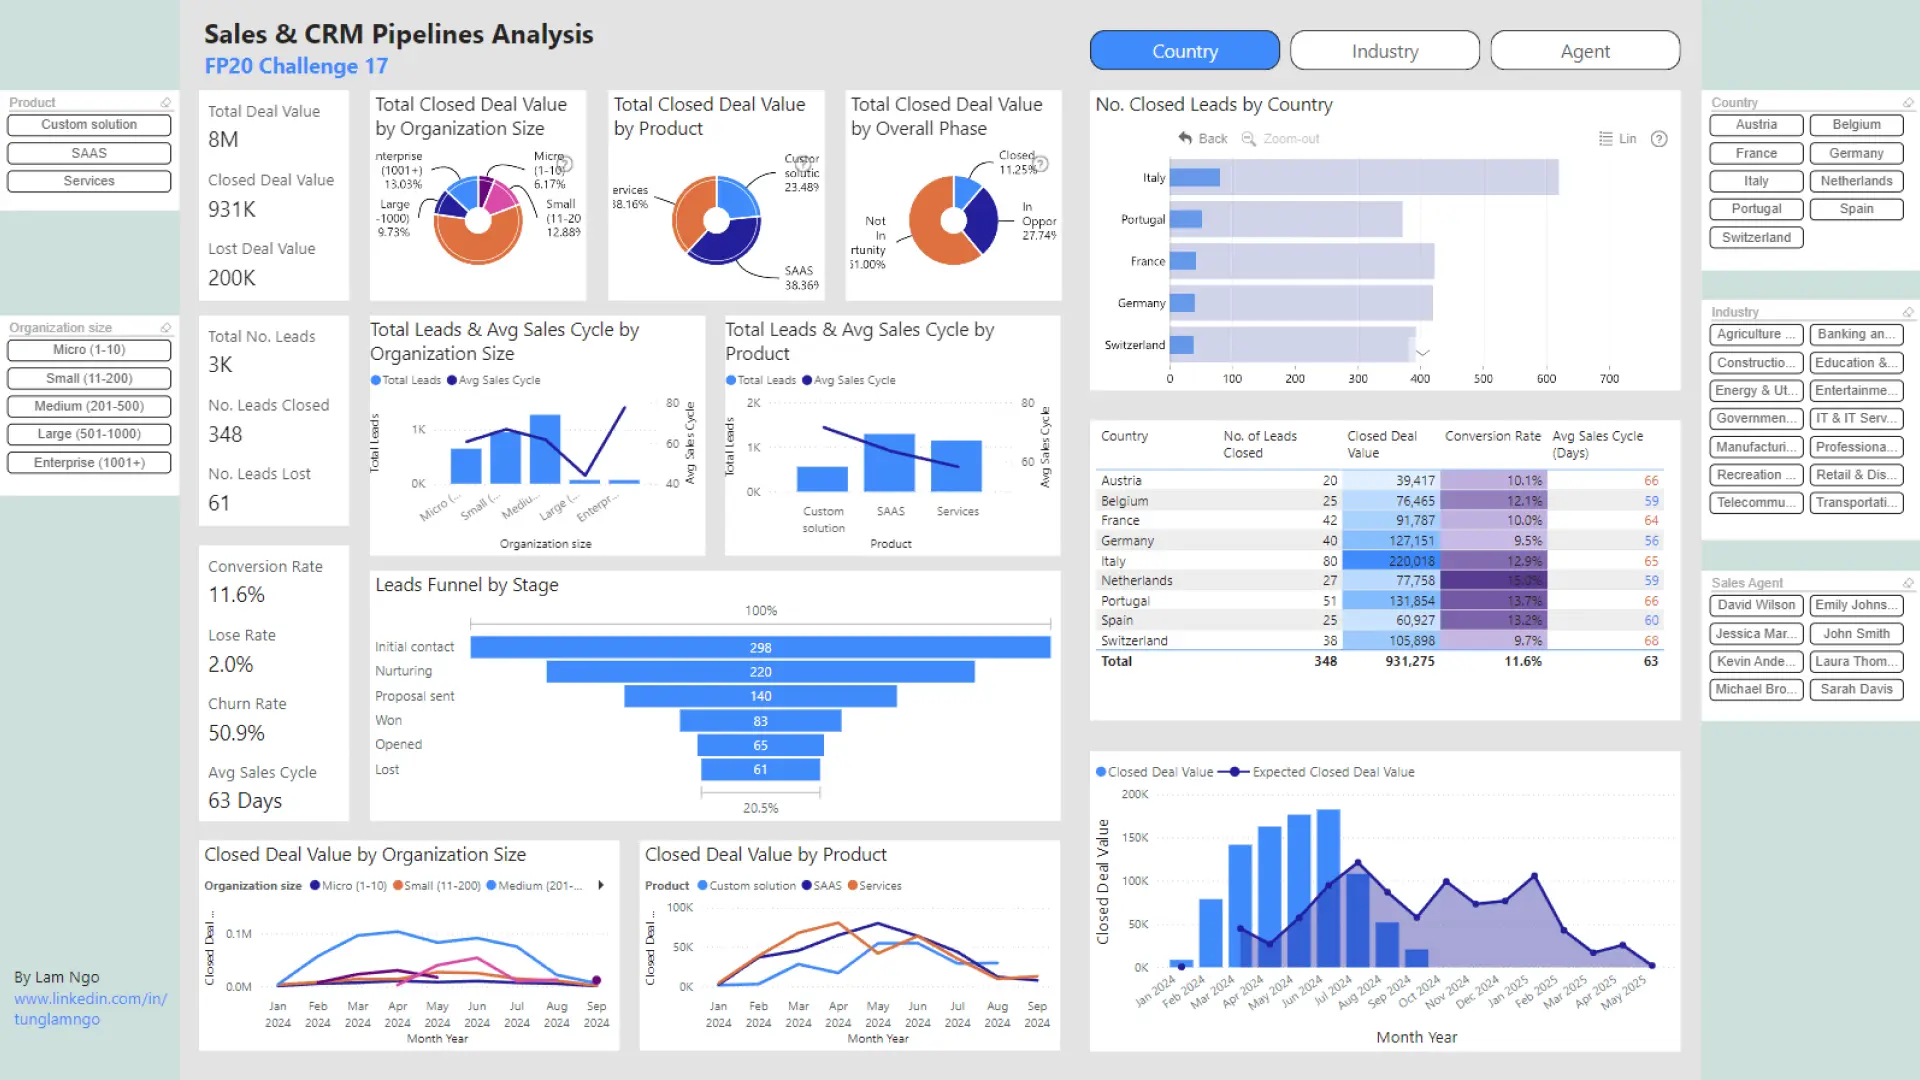
Report submitted for FP20 Analytics ZoomCharts Challenge 17 (July 2024). The report was built with the CRM & Sales Pipeline Analysis dataset and includes ZoomCharts custom Drill Down PRO visuals for Power BI.
Author's description:
Sales & CRM Pipelines Analysis Tung Lam Ngo
Key Insights: There are so many insights can be observed and discovered from the dataset and dashboard, but I will just cover a few!
Performance by Segment:
1. Organization Size: - Medium-sized organizations (201-500 employees) have the highest deal value, contributing over 58% of total closed deal value. - Micro organizations (1-10 employees), despite having around 10x more total leads compared to Large and Enterprise organizations, have the lowest total closed deal value. - Large organizations boast the quickest sales cycle at just 44 days, significantly faster than the second quickest at 60 days.
2. Product Performance: - SAAS products lead in both the number of leads and closed deal value, making them a significant revenue stream, with services coming in as a close second.
3. Sales Phases: - The leads funnel shows a gradual reduction in numbers through the stages, with notable drops from 'Proposal Sent' to 'Won' stages, indicating room for improvement in the closing phase.
Performance by Geography:
1. Country Performance: - Italy leads with the highest number of closed leads (80) and closed deal value ($220K), along with a strong conversion rate of 12.9%. - Switzerland has the highest average sales cycle duration (68 days) and the second lowest conversion rate, indicating longer negotiation times.
Performance by Sales Agent:
1. Top Performers: - Laura Thompson leads with 93 closed leads and a total closed deal value of $218K. She has a high conversion rate of 12.4% and an average sales cycle of 59 days, showcasing her efficiency and effectiveness. - Michael Brown and Jessica Martinez follow with 81 and 61 closed leads, respectively. Michael has a higher closed deal value ($177K) but a longer average sales cycle (71 days), suggesting more complex or high-value deals.
Performance by Industry:
1. Top Industries: - Transportation & Logistics and Banking and Finance lead in the number of closed leads (68 and 64 respectively) and closed deal values ($174K and $121K), with strong conversion rates (12.9% and 12.6%). - Education & Science and Recreation & Sports have the shortest average sales cycles, both under 50 days, indicating efficient sales processes in these industries.
These insights highlight the strengths and areas for improvement across different segments, helping to drive strategic decisions and optimize sales performance. Last but not least, thank you so much for organizing this challenge!
Mobile view allows you to interact with the report. To Download the template please switch to desktop view.
