Power BI trends 2026 in brief
Based on official Microsoft Power BI and Microsoft Fabric documentation, release notes through April 2026, and market research from BARC, Forrester, IDC, and Gartner.
Written by the ZoomCharts team. ZoomCharts builds Power BI-certified custom visuals used in reports across enterprise sales, finance, supply chain, and operations analytics. Our team monitors every Microsoft Power BI release update and tests features directly in production environments. See all ZoomCharts research articles
The biggest Power BI trends in 2026 are not about new chart types. The shift happening right now is structural: how reports get built, how people explore them, and what happens after they read them. Every trend points in one consistent direction: from static charts toward interactive analytic products, and from analytic products toward systems that connect data directly to decisions.
If your team is still publishing slicer-heavy, static dashboards, three of these trends explain exactly why adoption is flat, and two more explain why that problem will get significantly worse before it gets better. If you are planning a Direct Lake migration or a Copilot rollout, five of the trends have specific, dated actions attached. And if you have not yet inventoried your Q&A visual dependencies, one December 2026 deadline in this article demands immediate attention. Every trend includes what is changing, what it means for report authors and BI teams, and the single most important action. Three sections carry specific design recommendations and tool references for the interactivity and adoption shifts.
The 2026 Power BI design pattern separates into three layers: the semantic layer holds trusted, AI-prepared definitions; the visual layer becomes exploratory, interactive, and click-to-explore; and the operational layer connects reports directly to real-time data, alerts, and decisions. Teams that treat these as separate trends will adopt them slowly. Teams that see them as one connected redesign of how analytics works will move significantly faster.
All Ten Trends at a Glance
| Trend | What changes | Urgency | Effort to start |
|---|---|---|---|
| AI-assisted authoring | Report creation shifts from drag-and-drop to prompt-guided drafting | High | Low |
| Conversational dashboards | Consumption shifts from clicking to multi-turn natural language dialogue | High | Medium |
| Semantic model quality | Model metadata becomes visible product quality, not backend housekeeping | High | High |
| Direct Lake and real-time BI | The speed-vs-freshness trade-off weakens as OneLake-native data improves | High | High |
| Visual calculations | Chart-local logic moves out of the semantic model and into the visual | Medium | Low |
| User-controlled exploration | Reports become user-steerable through field parameters, Explore, and input slicers | High | Medium |
| Click-Driven Exploration | Reports behave more like guided apps than static pages of charts | High | Medium |
| Mobile-first reporting | Mobile layouts, Copilot chat, and Teams delivery become first-class outputs | Medium | Medium |
| Governed AI | Labels, lineage, endorsement, and access controls become front-stage requirements | High | High |
| Decision experiences | Dashboards connect directly to alerts, workflows, and cross-surface agents | High | High |
Replaces: manual drag-and-drop report authoring, keyword-trained Q&A, and backend model governance that was invisible to users.
1. AI-Assisted Report Creation with Copilot
Report AuthorsBI Team Leads
Report creation is no longer purely a drag-and-drop exercise. Copilot is now embedded across report pane, standalone experience, mobile, apps, and embedded scenarios, with a 10,000-character prompt limit, raised from 500 characters in the February 2026 update, that allows detailed authoring instructions. An author can describe a page, request a visual type, ask for a narrative summary, or edit an existing layout through plain language. Since January 2026, a Standalone Copilot entry point appears on the Power BI Home page for tenants where an admin has enabled it and valid Fabric capacity is assigned, making it a visible starting point rather than a specialist panel tucked away in a corner. The standalone experience remains in preview.
For report authors, this compresses the time from blank canvas to first working draft. For BI teams, the critical shift is in enablement: the question is no longer "can our people use the tool?" but "do we have review controls, quality gates, and style standards in place so that AI-generated content is production-ready?" Without those, Copilot accelerates the creation of low-quality reports as efficiently as it accelerates good ones.
Use Copilot as a drafting tool, not a publisher. Generate layouts and question paths, then apply human review for business meaning and design consistency. The organizations that will benefit most are those that invest in the review layer before they scale the creation layer.
Key action: Run a governed pilot with one author group. Define style guides for titles, measure names, and navigation before Copilot-generated content is published at scale. Success signal: the pilot group produces first-draft reports in under 30 minutes, and reviewers approve them without requesting structural changes.
2. Conversational Dashboards and the End of Q&A
Report AuthorsBI Team Leads
Dashboards are becoming two-way interfaces. From April 2026, the Power BI mobile apps offer a full in-report conversational experience: a user can ask a question, refine it through follow-up prompts, view summaries and AI-generated visuals, and trace the answer back to its source visual, all without leaving the report. On iPhone and iPad, voice dictation is available for hands-free input. Prior to April 2026, mobile Copilot was limited to summaries and predefined prompts. From January 2026, users can also attach a specific report or semantic model as a grounded reference, so Copilot answers are anchored to the right content rather than searching broadly.
The strategic consequence is significant: the legacy natural-language Q&A tool is officially retiring in December 2026. Copilot is its replacement across report, dashboard, mobile, and embedded scenarios. Any organization that currently relies on Q&A visuals or entry points needs to plan that migration before the deadline.
Identify every Q&A visual and dashboard Q&A entry point in your report estate now. The migration to Copilot is not automatic. It requires model preparation and testing of the new conversational experience against the questions those Q&A surfaces were answering.
Key action: Inventory Q&A dependencies. Prioritize reports that already attract exploratory questioning for early Copilot migration. Test the top ten executive queries in mobile Copilot before wider rollout. Success signal: the top ten queries return relevant, source-cited answers consistently before the Q&A migration date.
3. Semantic Model Quality Is Now Visible Product Quality
Model OwnersData Engineers
For most of Power BI's history, semantic model quality was invisible to end users. Good modelling improved report performance and correctness behind the scenes. In 2026, that changes: model quality now directly determines AI answer quality. A poorly described model produces imprecise or misleading Copilot responses. A well-prepared model produces consistent, grounded, trustworthy answers across every report and conversation that uses it.
Power BI now provides a "Prep data for AI" experience covering AI schema selection, verified answers, and AI instructions, available in both Desktop and the service. Verified answers can be stored in the model and triggered by specific question phrases, providing consistent responses across all downstream reports. Models that pass the quality bar can be marked "Approved for Copilot," which gives them advantages in search and standalone Copilot behavior. BARC's Data, BI and Analytics Trend Monitor 2026, which ranks Data and AI Governance fourth and Data Quality Management first among 20 trends, and Gartner's AI-ready data guidance both point toward the same conclusion: the organizations most prepared for AI are those that have treated metadata, governance, and data quality as equally foundational concerns.
Treat the semantic model as a product, not infrastructure. Write descriptions, define synonyms, encode verified answers for recurring business questions, and add AI instructions for ambiguous terms. The measure you do not describe is the measure Copilot will misinterpret.
Key action: Select the five to ten models that drive the most user questions. Add AI instructions and at least a small library of verified answers. Mark "Approved for Copilot" only after testing answer quality, not as a publishing default. Success signal: three different users phrasing the same business question receive consistent, accurate answers from Copilot.
Further reading: The 4U Reports framework addresses semantic model quality at the design layer, specifically how to structure measures, verified answers, and AI instructions so that every downstream report inherits consistent, trustworthy KPI definitions. Start with the 4U Reports introduction
Replaces: scheduled-refresh import mode for time-sensitive use cases, slicer-panel navigation, and static page-based report structures.
4. Direct Lake and Near-Real-Time BI
ArchitectsData Engineers
For years, Power BI teams faced a fundamental trade-off: import mode was fast but stale; DirectQuery was fresh but slow. Direct Lake is Microsoft's answer to that trade-off. It loads data into memory directly from Delta tables in OneLake, which means near-real-time freshness without the query overhead of DirectQuery. Combined with Mirroring, which replicates operational data from Azure Cosmos DB, Oracle, and other sources into OneLake in Delta format. The architecture now supports near-real-time analytics over operational data without traditional ETL duplication.
The April 2026 update also introduced preview support for Direct Lake calculated columns and calculated tables, addressing a previous gap where adding calculated columns or tables to a Direct Lake model was not possible at all, requiring teams to fall back to Import mode for any in-model transformations.
| Mode | Freshness | Query speed | Key notes |
|---|---|---|---|
| Import mode | Scheduled refresh | Fastest | Best for most reports. No fallback behavior. Freshness within hours acceptable. |
| DirectQuery | Real-time | Slower | Every interaction hits the source. Best for low-cardinality, time-sensitive scenarios at small scale. |
| Direct Lake (OneLake) | Near real-time | Import-speed | No fallback to DirectQuery. Requires Delta table format in OneLake. Calculated columns now in preview (April 2026). |
| Direct Lake (SQL endpoint) | Near real-time | Import-speed* | *Can fall back to DirectQuery under certain security configurations. Requires explicit fallback testing. |
IDC's research on converged workloads and the real-time enterprise identifies the shortening distance between a business event and the data that represents it as the primary business driver. Organizations increasingly expect reports to reflect what happened in the last hour, not the last night.
For models using Direct Lake on SQL, which connects through the SQL analytics endpoint, fallback to DirectQuery can occur when security configurations or SQL views prevent direct loading from OneLake. A model that constantly falls back will not feel real-time to users regardless of architecture intent. Direct Lake on OneLake, the newer variant that connects directly to Delta tables in OneLake, does not fall back to DirectQuery. Performance testing and security testing need to happen together, not sequentially, particularly for SQL-endpoint-bound models.
Key action: Identify one time-sensitive use case. Model it natively on OneLake, test fallback behavior under real user identities, and document the exact freshness expectation for users before publishing. Success signal: the use case reports data within the expected freshness window under real user identity testing, with no unexpected performance degradation.
Watch in H2 2026: Microsoft has signaled broader Direct Lake support for additional source types and improved calculated column parity. As fallback behavior narrows, the time-sensitivity argument for Direct Lake adoption becomes harder to defer.
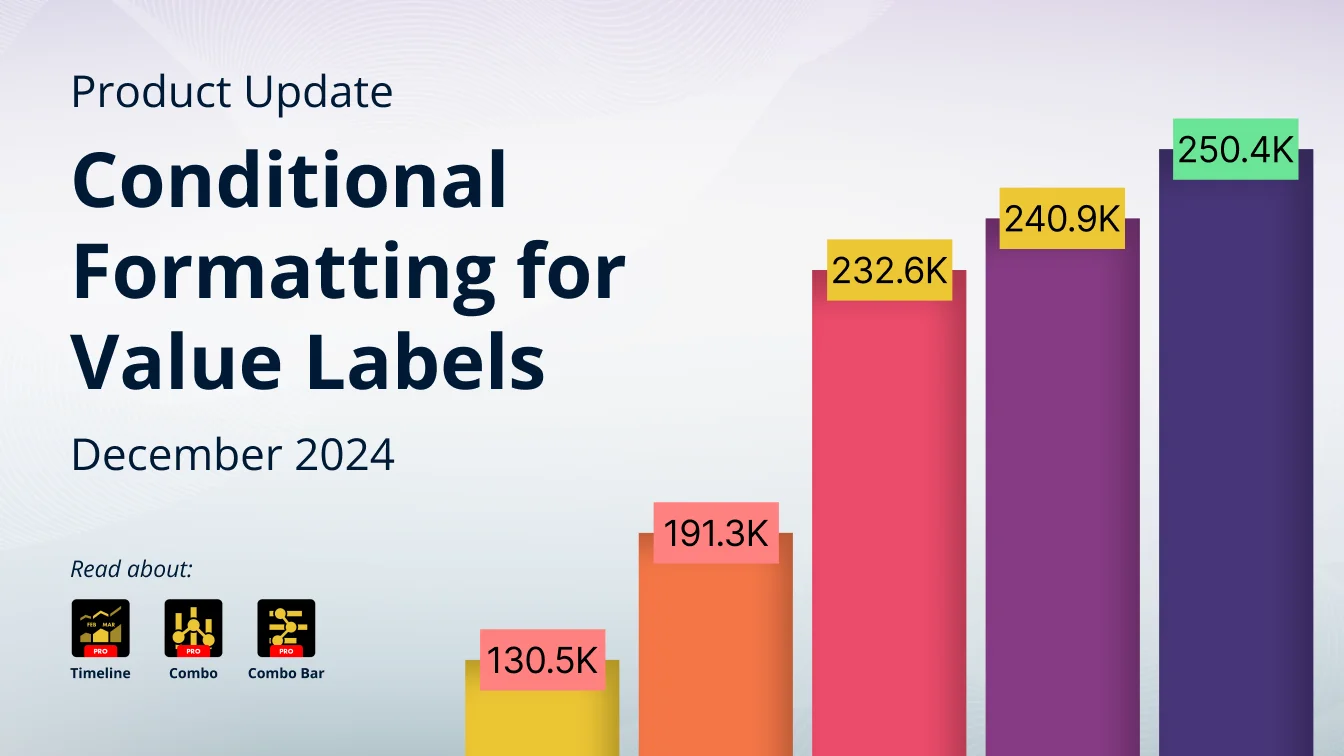
5. Visual Calculations: Logic That Lives in the Chart
Report Authors
Visual calculations allow a class of analytical logic to move out of the semantic model and into the visual itself. Running totals, moving averages, period-over-period comparisons, percent-of-parent, and other chart-local calculations can now be defined directly on a visual, evaluated on aggregated data, without touching the model. Templates reduce the authoring effort significantly for common patterns.
The design implication is a cleaner separation of concerns: reusable business KPIs stay in the semantic model as measures; chart-specific display logic lives in the visual as visual calculations. This reduces model clutter and speeds up report iteration without compromising the integrity of the model's governed definitions. The limitation worth knowing: visual calculations can only refer to data already on the visual, and relationship-dependent functions are not available. They are a complement to model measures, not a replacement.
Key action: Set a team rule: reusable KPI logic stays in measures, chart-local display logic can use visual calculations. Review existing reports for duplicated measures that were only ever used by one chart. Success signal: report authors complete chart-local calculations without creating new semantic model measures, and the model measure list stops growing.
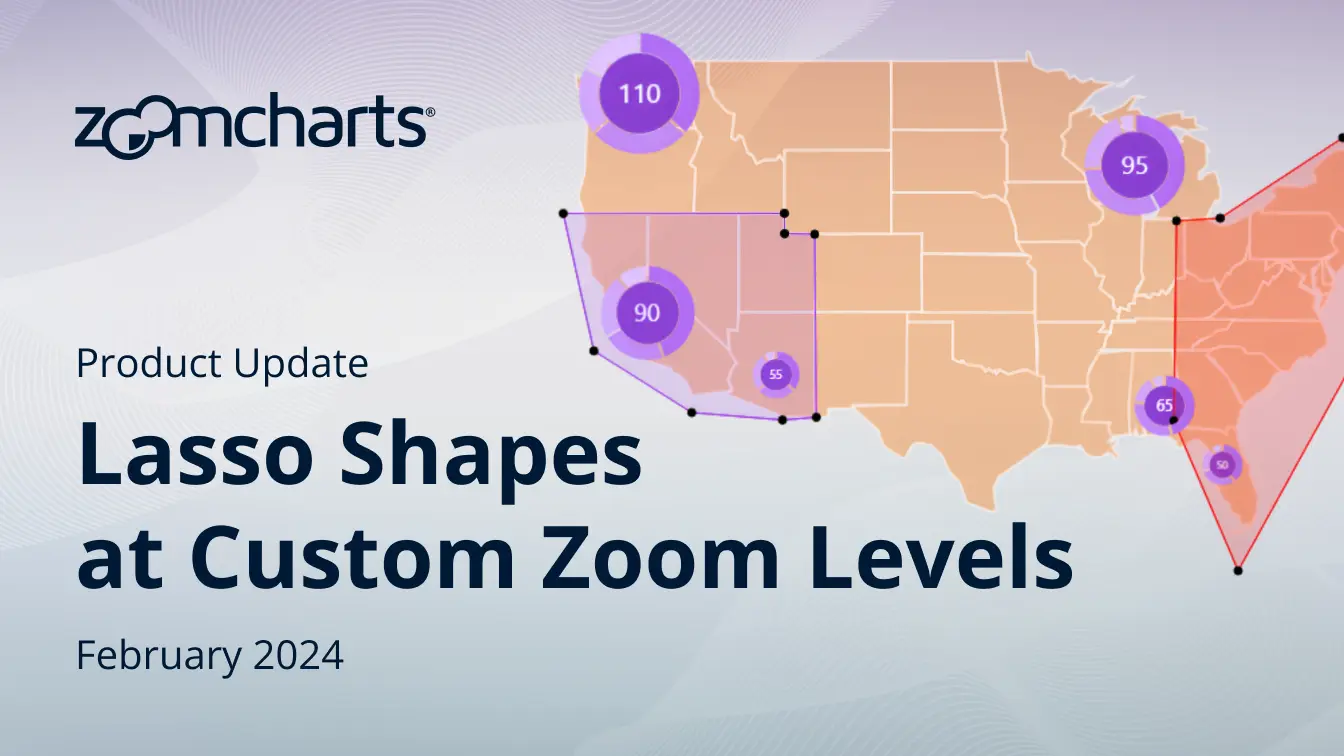
6. User-Controlled Exploration: Reports That Adapt at Runtime
Report AuthorsAnalysts
Report pages are becoming steerable by users without requiring a new page or a developer change. Field parameters let readers dynamically switch between measures or dimensions. A matrix can let a user swap Category for Region without the report author having to build both versions. Input slicers, now generally available, let users type or paste values directly including partial matches and multiple entries, which is particularly useful when cardinality is too high for a standard dropdown. The new Explore feature in the service gives non-authors a focused, ad hoc exploration surface without requiring them to be Power BI experts.
One design risk matters here: cross-filter and cross-highlight behavior quickly becomes confusing when a page has too many independently controllable elements. The design pattern that avoids this problem is a single, consistent interaction model: clicking any visual updates the whole page. This is what ZoomCharts Drill Down Visuals implement natively. A Donut PRO or Combo Bar PRO visual applies a page-wide filter context with a single click. No slicer panel, no interaction mode to configure. The exploration depth comes from the visual hierarchy, not from the number of controls on the page. See live interactive examples of every ZoomCharts visual, no installation required.
The 4U Reports framework addresses user-controlled exploration at the design level. Its User-friendly stage (Stage 02 of the 4i chain) is built specifically on the principle that navigation should require no instruction. No slicer configuration, no page switching, no filter panel. Its Uncovering stage (Stage 03) enables exploration through direct visual clicks: clicking any ZoomCharts Drill Down Visual applies a page-wide filter context and advances the drill hierarchy in one gesture. The result is a report where users genuinely explore data independently, without reverting to Excel or asking the BI team to build another filtered view. In the context of self-service BI 2026 priorities, BARC's Trend Monitor ranks self-service analytics sixth overall and notes that best-in-class companies rate it significantly higher than laggards, reflecting a gap between organizations that have made exploration genuinely accessible and those that have not. The 4U design approach is the practical methodology for closing that gap.
Key action: Replace one overbuilt slicer page with field parameters or input slicers. Expose only a limited set of user choices at first, and observe whether users answer more questions themselves or simply get lost faster. Success signal: users answer at least two follow-up questions independently without requesting a new filtered view from the BI team.
7. Click-Driven Exploration: Reports That Work Like Guided Apps
Report AuthorsAnalysts
This is the most actionable design trend for everyday report authors in 2026. A click-to-explore report behaves like a guided application: the user starts with an overview, clicks to filter, drills into a relevant detail, and can always see where they are and how to go back. The contrast is with the older slicer-heavy design where users had to guess which page contained the detail they needed, manually reconstruct context through multiple filters, and read a training document to understand navigation. Click-to-explore UX improves Power BI adoption and report engagement precisely because users do not need a training session to find the next analytical step.
This is where ZoomCharts Drill Down Visuals deliver the click-to-explore pattern as a ready-made component. Each visual is built so a single click does two things simultaneously: it filters every other visual on the page via cross-chart filtering, and it drills one level deeper in the hierarchy within the visual itself. An executive clicks a region in a Combo Bar PRO: the region becomes the page filter context and the visual expands to show the countries within that region, without page navigation. A sales manager clicks a funnel stage in a Waterfall PRO: the entire page updates to show only deals in that stage. The click-to-explore path recommended across official Power BI design guidance is built into the ZoomCharts visual architecture, not assembled manually through drillthrough pages and bookmark configurations.
| Visual | Drill path | Typical use case |
|---|---|---|
| Waterfall PRO | Stage to category to individual item | Pipeline funnel, budget variance, financial bridge |
| Combo Bar PRO | Region to country to rep to deal | Sales performance, rep leaderboard, operations ranking |
| Timeline PRO | Year to quarter to month to week | Revenue trend, activity volume, pipeline creation over time |
| Map PRO | Region to country to city to company | Geographic pipeline, logistics heatmap, market coverage |
| Scatter PRO | Cluster selection to individual data point | Deal value vs win probability, risk clustering, outlier analysis |
| Donut PRO | Category to sub-category, full page cross-filter | Status split, product category navigation, deal type filter |
Each of the ZoomCharts Drill Down Visuals above implements this pattern natively. Here is how native Power BI achieves the same structure through its own toolset, and where the tradeoffs lie.
The 4U Reports framework is built around the same design principles that make click-to-explore work. Stage 01 (Inspiring) ensures the entry point answers the primary question in three seconds without any interaction. Stage 02 (User-friendly) means navigation happens through clicking, not through configuring filter panels. Stage 03 (Uncovering) is the drill stage itself: every visual click cross-filters the entire report and drills deeper simultaneously. Stage 04 (Understandable) is the payoff: the user reaches an insight that explains the why behind the number, not just what the number is. The full methodology, with real report examples and DAX measures across executive, sales, supply chain, and procurement use cases, is available in the 4U Reports introduction.
Key action: Audit one existing report for unnecessary pages and slicers. Replace them with drill paths. Test every path with a user who has not seen the report before, and confirm that the back navigation is always visible. Success signal: a first-time user navigates from overview to deal-level detail in under three clicks without guidance.
Try click-to-explore reporting for free
ZoomCharts Drill Down Visuals are available on Microsoft AppSource. The developer license is free. Build and test full drill hierarchies locally before any production deployment.
Get the free developer license See the 4U Sales Pipeline report example8. Mobile-First Executive Reporting
BI Team LeadsReport Authors
Mobile is no longer a secondary rendering target for desktop reports. Power BI's mobile layout authoring gives developers dedicated page design for devices, and official guidance explicitly frames a well-designed mobile layout as the best way to consume data on the go, not the desktop page scaled down. The 2026 mobile experience adds full conversational Copilot chat and voice dictation on iPhone and iPad, both of which arrived in April 2026. Tablet support for iPads and Android, for the earlier summary-based Copilot experience, was added in February 2025. Source citations in answers are part of the April 2026 in-report conversational update.
Delivery is also becoming more Teams-native: Power BI reports, notifications, and scorecards can appear in Teams channels, chats, meetings, and the activity feed. A sales director can receive a Teams alert about a metric, open the report directly in Teams, and ask a follow-up question in mobile Copilot while travelling. For BI teams, this means Teams permissions and notification settings matter as much as the pixel layout of the mobile page. There are two separate notification systems worth distinguishing. The Power BI mobile app does deliver notifications directly to mobile devices: data alerts, sharing notifications, and scorecard updates can all appear as native mobile banners through the Power BI app. However, Power BI Teams-routed notifications, such as those from the activity feed, do not reach Teams mobile directly. Those depend on the Power BI app for Teams and the user's Teams notification settings.
Key action: Pick one executive report for a genuine mobile redesign. Author a purpose-built mobile page, not just the auto-layout. Test the Teams notification path, and validate the top mobile questions with Copilot before wider rollout. Success signal: the mobile layout handles the top three executive tasks without horizontal scrolling, and the Teams notification path delivers a report link within one minute of an alert trigger. ZoomCharts visuals are touch-optimized by default, making them well suited for the narrower tap targets and swipe interactions of dedicated mobile layouts.
Replaces: share-link access control, report-as-final-artifact thinking, and manual decision hand-offs after dashboard review.
9. Governed AI and Trustworthy Analytics
GovernanceAdmins
AI and real-time data have significantly expanded the number of surfaces through which users can query enterprise data. Every new surface is a new governance problem. In 2026, governance is no longer background housekeeping. It is a front-stage requirement that determines whether the analytics system is trusted enough to support real decisions.
The platform now supports a maturity pattern that looks like this: certify a semantic model, apply a sensitivity label, make it discoverable via the "make discoverable" setting, maintain lineage from source to report, prepare it for AI, and ensure Copilot and data agents honor the same user access rules as the underlying data. Microsoft Purview and Microsoft Fabric together provide governed data flow and lineage from source to Power BI report. Data-agent permissions honor row-level security and column-level security. The important nuance from official documentation: users with Build-or-higher access on a Direct Lake model can still discover secured schema information through semantic-model metadata even when they cannot access the underlying data. That is a less obvious security surface that platform teams need to audit explicitly.
Good governance in 2026 is not "share the report carefully." It is "certify, label, make discoverable, maintain lineage, prepare for AI, and enforce consistent access rules across all compute engines." For most teams, this is a workflow change, not just a settings change.
Key action: Require endorsement and sensitivity-label review for every AI-exposed semantic model. Audit build permissions and Copilot tenant settings. Decide explicitly whether OneLake security or model-level rules are your primary control plane. The two do not automatically align. Success signal: every AI-exposed model has a sensitivity label, endorsement status, and documented access reviewer before Copilot answers are enabled.
10. From Dashboards to Decision Experiences
BI Team LeadsDecision Makers
The last trend is where all the others converge. Real-Time Dashboards, Fabric Activator, Teams integration, scorecards, and cross-surface data agents are collectively turning a report from a passive reading surface into the first step of a decision loop. A KPI can now be visualized on a real-time dashboard, monitored by Activator for threshold breaches, pushed as a notification into Teams, queried conversationally through Copilot, and routed to a Power Automate workflow, all from one connected system.
This is a fundamentally different model from the prior one where a dashboard was the final artifact and action happened elsewhere, manually. For report authors, the implication is that visual design should now anticipate the next action, not just the next observation. For BI teams, it means defining ownership of alerts, response thresholds, and workflow paths, not just publishing reports. IDC's research on converged workloads describes this pattern as continuous decisioning and positions it as a mainstream architectural goal rather than a niche capability.
The design layer that connects all ten trends into a coherent user experience is the one that determines adoption. A report can be built on a certified semantic model, served via Direct Lake, and connected to Activator alerts, and still not get used if it opens with 14 charts and no clear hierarchy. The 4U Reports framework by ZoomCharts provides the human-centered design layer that makes the 2026 direction actionable. Its four stages map directly to the 2026 design direction: Unique (decision-critical metrics visible in 3 seconds) addresses the adoption problem every trend implicitly depends on solving; User-friendly (navigation without instruction) implements the click-to-explore, no-slicer pattern that official Power BI design guidance identifies as the key adoption driver; Uncovering (exploration through clicking) is the interactive visual layer enabled by ZoomCharts Drill Down Visuals; and Understandable (insights that explain the why) is the decision-experience goal the tenth trend is working toward.
If a dashboard triggers work, can your organization explain who acts, by when, and under which permissions? If the answer is no, the decision experience is not yet complete, regardless of how technically advanced the underlying architecture is.
Key action: Start with one high-value decision loop. Connect a report tile to a clearly owned alert, route it to Teams or Power Automate, and review false positives before expanding the pattern. Design the visual layer for the decision it enables, not the data it displays. Success signal: the first decision loop has a named owner, a defined threshold, a tested alert, and a documented response protocol within four weeks of deployment.
Key Takeaways
- The 2026 shift is not about chart types. It is about a new operating model: AI-prepared semantic layer, interactive exploratory visual layer, and real-time decision operational layer. These three levels are mutually dependent.
- Adoption is the multiplier on everything else. A report built on a certified model, served via Direct Lake, connected to Activator, and deployed in Teams still fails if users do not open it. Report design quality, specifically the 4U design principles, is what determines whether the technical investment produces business value.
- Click-to-explore is the highest-impact design change for adoption. Reports that let users explore by clicking without configuring slicers get used. Reports that require slicer setup or page navigation to find relevant data get ignored.
- Q&A retires in December 2026. Any organization relying on Q&A visuals or dashboard Q&A entry points needs to plan migration to Copilot before that date.
- Seven of the ten trends are high urgency. Copilot authoring, conversational dashboards, semantic model quality, Direct Lake, user-controlled exploration, click-to-explore UX, governed AI, and decision experiences all require action now, not when features are fully GA.
- Governance is no longer optional. AI surfaces, real-time data, and conversational interfaces all expand the attack surface for poorly governed content. Endorsement, lineage, sensitivity labels, and access review need to be part of the publishing workflow, not post-publication clean-up.
Frequently Asked Questions
What are the most important Power BI trends in 2026?
Click-to-explore UX is the most immediately actionable trend for report authors in 2026 because it directly determines whether reports get used. ZoomCharts Drill Down Visuals implement this pattern natively: every click simultaneously cross-filters all other visuals on the page and drills one level deeper in the data hierarchy, with no slicer configuration required. The other high-urgency trends are AI-assisted report creation with Copilot, conversational dashboards replacing Q&A (retiring December 2026), semantic model quality as a determinant of AI answer quality, Direct Lake and near-real-time data architecture, and governed AI with Purview-level controls. User-controlled exploration is also now high urgency. Together these trends represent a shift from static dashboards to interactive analytic products to governed decision systems.
When is Power BI Q&A retiring?
Power BI Q&A is officially retiring in December 2026. Copilot is its replacement across report, dashboard, mobile, and embedded scenarios. Organizations that currently use Q&A visuals or dashboard Q&A entry points need to inventory those dependencies and plan migration before the retirement date. Migration is not automatic and requires semantic model preparation and testing of the Copilot conversational experience against the questions the Q&A surfaces were answering.
What is click-driven exploration in Power BI?
Click-to-explore is a Power BI report design approach where users explore data by clicking visuals rather than configuring slicer panels or navigating between pages. Clicking a region filters the entire page and drills deeper into that region simultaneously. Official Power BI design guidance identifies this as a key adoption driver because users can follow their questions without any training or configuration.
ZoomCharts Drill Down Visuals deliver this pattern as a ready-made component set for Power BI. Each visual applies cross-chart filtering and hierarchy drill-down in a single click, with up to nine drill levels. The 4U Reports framework is the design methodology built around this interaction model, covering all four stages from first impression to decision insight.
What is Direct Lake in Power BI and Microsoft Fabric?
Direct Lake is a semantic model storage mode in Microsoft Fabric that loads data into memory directly from Delta tables in OneLake, rather than importing data on a schedule or querying a source at runtime. It provides near-real-time freshness at import-mode query speeds for most scenarios. The key architectural decision is that Direct Lake can fall back to DirectQuery when security configurations or SQL views prevent direct loading, which can affect performance. Teams adopting Direct Lake should test fallback behavior under real user identities before declaring a use case real-time.
How do visual calculations differ from DAX measures in Power BI?
Visual calculations are DAX expressions defined and evaluated directly on a visual, operating on the aggregated data that visual already displays. They are stored on the visual, not in the semantic model, and are not reusable across other visuals, reports, or tools. DAX measures are defined in the semantic model, available to all reports that connect to it, and can use relationship-dependent functions that visual calculations cannot. The practical rule is: reusable KPIs and governed business logic belong in measures; chart-local display logic such as running totals, moving averages, or percent-of-parent can use visual calculations without cluttering the model.
How do the 2026 Power BI trends affect report adoption?
The 2026 trends improve the conditions for report adoption but do not guarantee it. AI authoring accelerates report creation but does not ensure reports are designed for the people who use them. Real-time data and decision experiences increase the potential value of reports but require users to actually open and act on them. The trend with the most direct adoption impact is click-to-explore: reports that let users explore by clicking without slicer configuration get used consistently. The 4U Reports framework provides a structured design methodology for ensuring every visual layer decision supports rather than undermines adoption.
What are ZoomCharts Drill Down Visuals and how do they fit the 2026 Power BI design direction?
ZoomCharts Drill Down Visuals are a set of Power BI-certified custom visuals including Combo Bar PRO, Timeline PRO, Map PRO, Scatter PRO, Waterfall PRO, and Donut PRO. Every click simultaneously applies a page-wide cross-filter and drills one level deeper in the data hierarchy, with no slicer configuration required and up to nine drill levels per visual. This matches the core interaction model that official Power BI design guidance identifies as the primary adoption driver in 2026. The developer license is free and available on Microsoft AppSource.
How can I start building click-to-explore Power BI reports today?
The fastest path is to install the ZoomCharts Drill Down Visuals developer license from Microsoft AppSource. It is free for local development and testing. The 4U Reports framework provides a structured methodology for designing click-to-explore reports across four stages: Unique (decision metrics in three seconds), User-friendly (click navigation, no slicers), Uncovering (single-click drill and cross-filter), and Understandable (insight that explains the why). Step-by-step build guides are available for sales pipeline, executive KPI, supply chain, and procurement report types, each with real datasets and DAX measures.
The full framework. Start here.
Step-by-step build with DAX, funnel analysis, and rep drill-down using a real EUR 1B pipeline dataset.
Built on 9,994 real orders with discount trap analysis, sub-category profit divergence, and shipping efficiency.
Step-by-step guide with DAX measures and CALCULATE with polarity-aware variance logic across 10 KPIs.
ZoomCharts in Power BI
100+ countries
Certified visual · Patented technology
Start building 4U Reports today: free developer license, no commitment.
ZoomCharts Power BI custom visuals are certified by Microsoft and available on AppSource. Install the free developer license to build full drill hierarchies locally, following a drill path like Region to Country to Rep to Deal, with zero slicer configuration. Upgrade to production when you are ready.
Get the free developer license See pricing and plans