logo
For Power BI
  • Products
    • Drill Down Donut Pro Drill Down Donut PRO
    • Drill Down Pie Pro Drill Down Pie PRO
    • Drill TimeSeries Pro Drill Down TimeSeries PRO
    • Drill Combo Pro Drill Down Combo PRO
    • Drill Map Pro Drill Down Map PRO
    • Drill Scatter Pro Drill Down Scatter PRO
    • Drill Down Network Pro Drill Down Network PRO
    • Drill Down Waterfall Pro Drill Down Waterfall PRO
    • Drill Down Graph Pro Drill Down Graph PRO
    • Drill Down Timeline Pro Drill Down Timeline PRO
    • Drill Down Combo Bar PRO Drill Down Combo Bar PRO

    Video tutorials

    Watch Now

    More than 90 videos on how to enhance Power BI with ZoomCharts

    Learn more
    All visuals
  • Resources

      Resources

    • Documentation
    • Report Examples
    • Blog
    • Webinars
    • Video Tutorials
    • Visuals Gallery

    Support

    • ZoomCharts Assistance
    • Contact Sales
    • Contact Support
    • FAQ

    Challenges

    Challenges

    Improve your report creation skills by participating in free challenges for report creators.

    Learn more
    Start trial
  • Services
    • Power BI Report Development
    • Custom Visual Development
  • Challenges
  • Pricing
Request a quote Start Free Book a Demo Sign in
Get it now
Go back

Contents

Go back

Oct 08, 2024

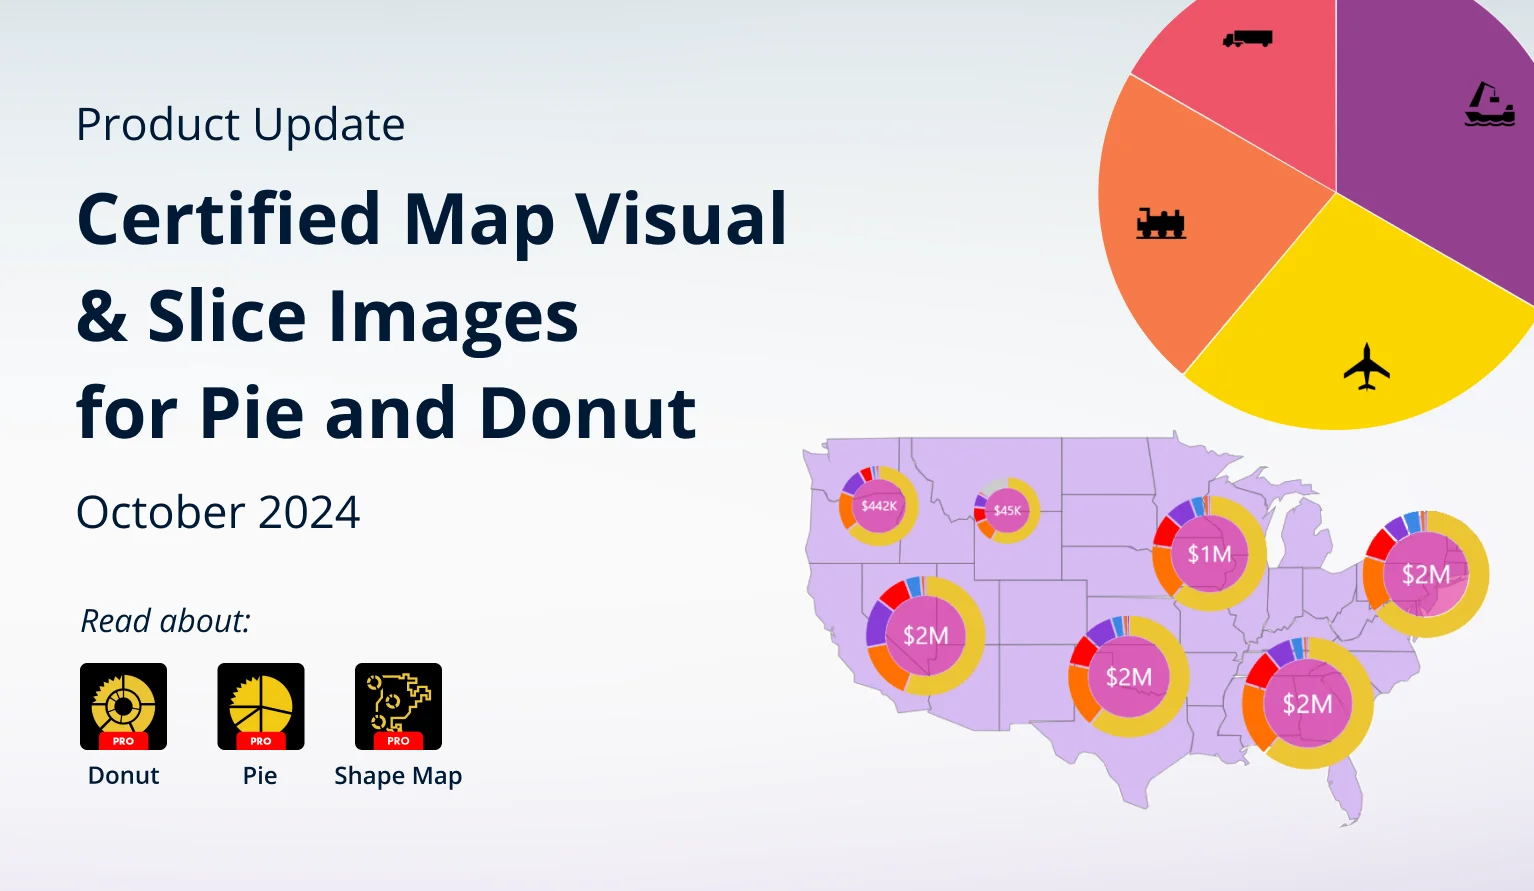
October 2024: Certified Map Visual & Slice Images in Pie, Donut

We have released a Power BI Certified version of our popular Map visual, and introduced custom slice images for Pie and Donut visuals.

Title image
Title image

We have released a Power BI Certified version of our popular Map visual, and introduced custom slice images for Pie and Donut visuals.

Contents

Share this article

Your visuals should update automatically from AppSource. If your visuals have not received the updates automatically, read this documentation article that explains the manual update process.

NEW VISUAL: Shape Map PRO

Drill Down Shape Map PRO visual for Power BI - a PBI certified map visual

We have released a variation of our popular Map PRO visual. It is called Drill Down Shape Map PRO, and it is Power BI Certified. The new visual is intended for organizations that want to create interactive and insightful reports while adhering to the highest security standards.

Unlike all our other custom visuals, the original Map PRO was not Power BI Certified. When designing Map PRO, we made the choice to allow creators to set online images or tile servers (OpenStreetMap, Azure Maps, Google Maps etc.) as the base layer; and reference external KML or GeoJSON files as shape layers. While this provides more flexibility for report creators, Power BI Certified guidelines do not permit access to external resources.

Shape Map PRO is a streamlined version of Map PRO which does not contain any features that require access to external resources. To meet the Power BI Certified requirements, we have removed the ability to use custom base layers and reference online files for shape layers.

You can use the built-in shape layers (World, USA, UK, Australia) to create slick and eye-catching map charts. This visual also retains all other interactivity and customization features that made Map PRO one of the best Power BI visuals for location data, including:

  • Intuitive navigation with touch support
  • Cross-chart filtering
  • Up to 10 shape layers
  • Conditional formatting for shape layers
  • Node clustering & pie charts on nodes
  • Auras
  • Full customization for shape layers, nodes, labels, legends, and more.
Get Shape Map PRO on AppSource

Pie & Donut: Slice Images

Slice Image field for Drill Down Donut PRO

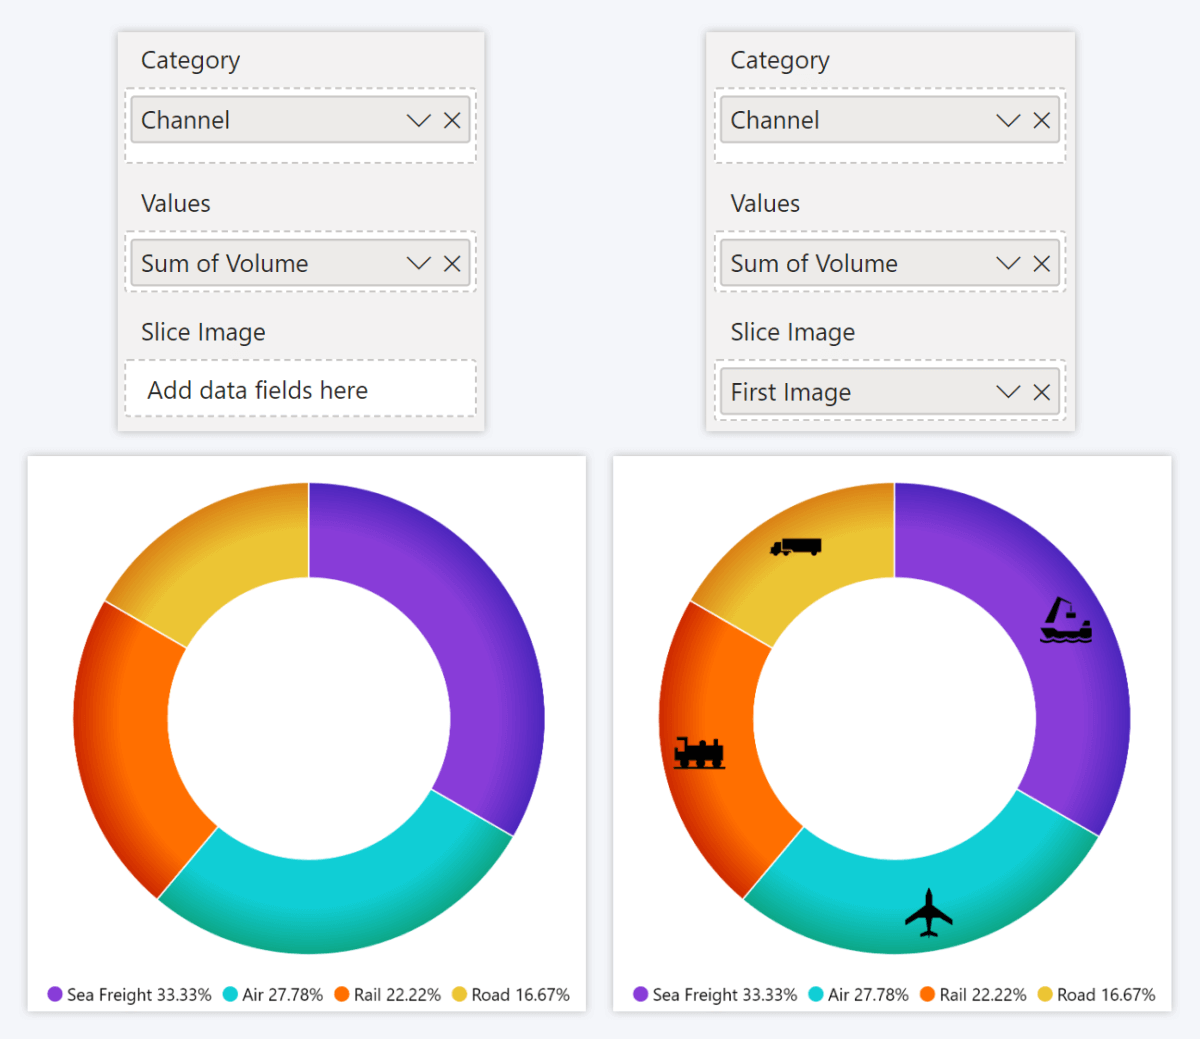
With the 1.12.9.0 update for our Pie PRO and Donut PRO visuals, you can now display images on slices. This will provide report creators with more ways to customize the chart and use visual storytelling to create user-friendly reports. Some potential use cases include displaying company or product logos, country flags, pictograms, or other images instead of text labels.

To display images on the slices, add a column or measure that contains base64 image data to the new Slice Image field. Each category that has valid image data in the Slice Image field will display the image on its slice, but categories with empty rows in the Slice Image field will simply remain like before.

Slice Image Field for Drill Down Donut PRO

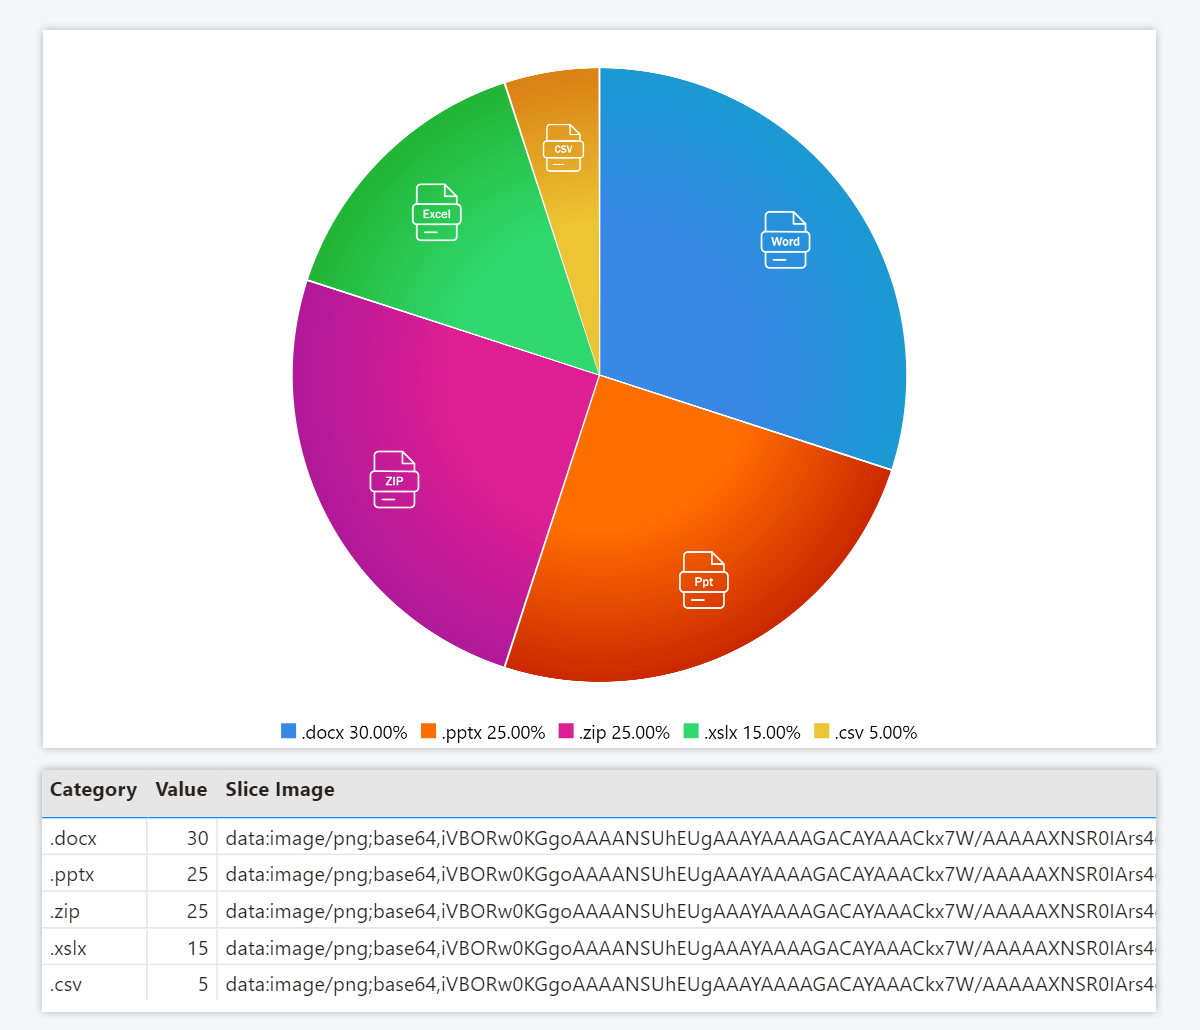
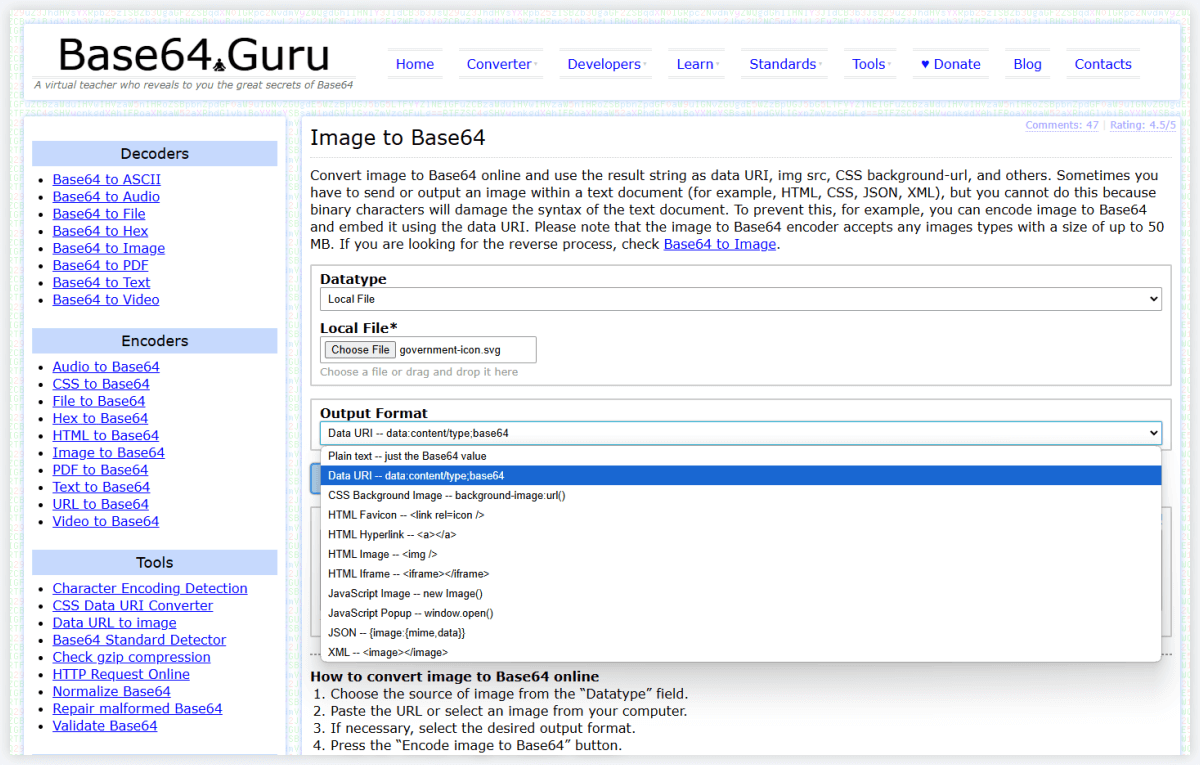
Image data in the Slice Image field must be encoded to base64 as Data URI (each string must start with data:image/[format];base64,). You can encode your images to base64 using online tools like Base64.guru, base64-image.de, or others.

This is similar how image support works in our Graph, Network, Map, and Scatter visuals. Power BI Certified visuals (including Pie and Donut) cannot access external resources like image URLs. By converting the image data to base64 strings, they can be stored in the data table as text, which means that the visual can show images without requiring access to external resources.

How To Use Slice Images

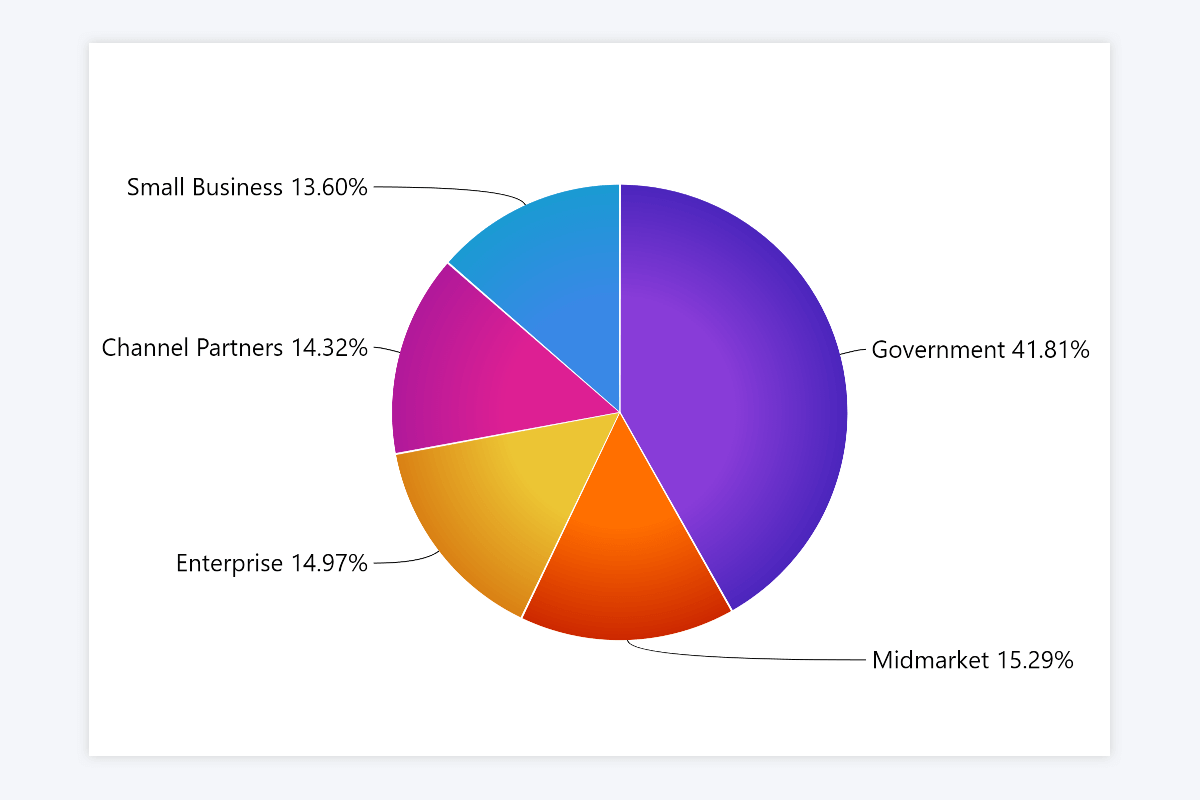
For this walkthrough, we will use the default Power BI sample dataset. We will visualize the units sold per each segment. We want to display an icon for each segment to add some flair to the chart and visually distinguish each segment. For this example, we used free icons by UXWing. Here's what the chart looks like without slice images:

Power BI Pie Chart Example

Step 1: Convert Images to base64

The Slice Image must contain base64 image data to display images properly, so we used a base64 encoder to convert image files (PNG, JPG, SVG, and others) to base64. Make sure that you select Data URI as the output format and that each string starts with data:image/[format];base64, where [format] is the original file format (for example, png).

The visuals support PNG transparency, which will look great because the image will seamlessly layer on top of the slice fill color. We recommend using square images to ensure the best appearance.

Convert images to base64 for use in ZoomCharts Pie and Donut visuals

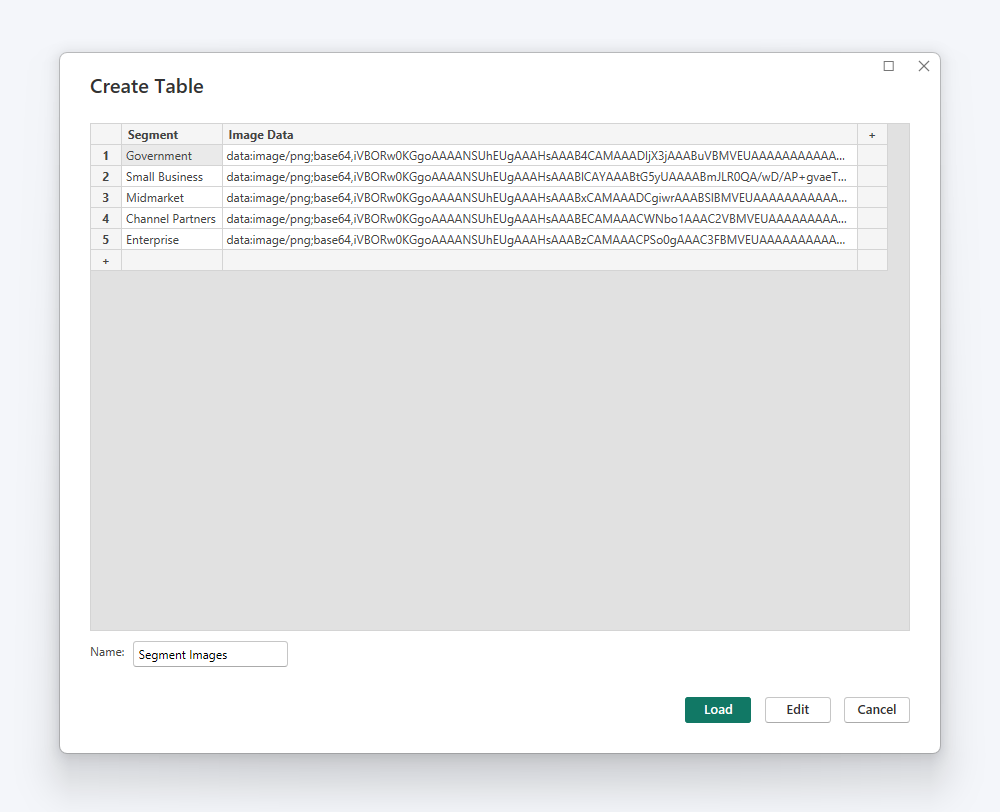
Step 2: Create a Column for Slice Images

Create a column and paste the base64 strings in rows adjacent to the respective categories. The base64 strings contain the entire image, and larger and more complex images will therefore be encoded as longer strings.

Keep in mind that the maximum permitted length for a text value in Power BI is 32766 characters, so if a string is longer than that, it will get cut off and the image will not display properly. We do not advise using images that are larger than 32.7kB.

In our example, we created a new column Image Data, where we pasted the base64 icons for each segment. If a category does not have valid image data in this field, its slice will simply show no image.

Create Column for Slice Image field

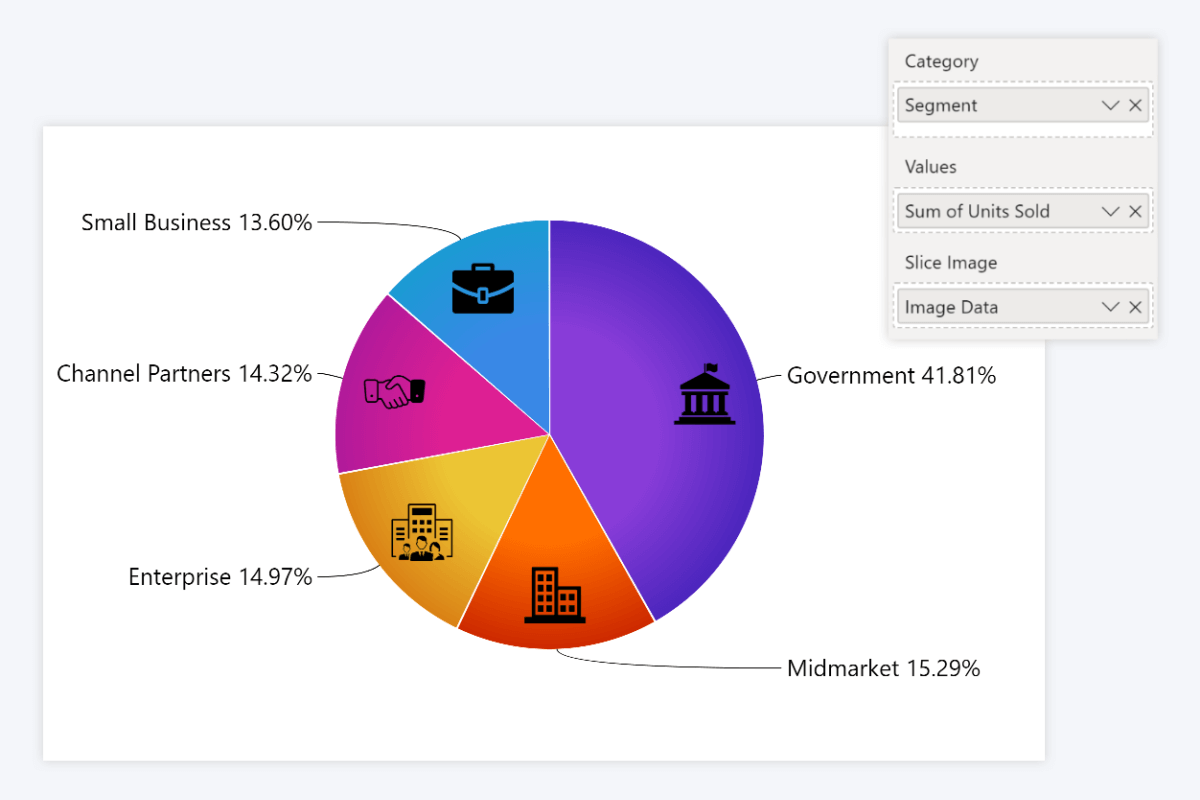
Step 3: Add the Column to Slice Image Field

Once you have created a column with base64 image data, simply drag it to the Slice Image field and the visual will display the images on their respective slices. You do not have to enable any settings – the images will be displayed automatically.

If you do not see the images, make sure that you have encoded them to base64 using the correct output format. If your images are cut off, it means that you have exceeded the maximum text value length (32766 characters) and you should use images that are smaller than 32.7kB.

Power BI Pie Chart Slice Images with ZoomCharts Drill Down Pie Slice Image Field

Get Started with ZoomCharts

Be sure to download the latest version of ZoomCharts Visuals to enjoy these new additions, along with hundreds of other features! With a free trial available, you can see for yourself how these powerful visuals can take your Power BI reports to the next level.

  • Get Drill Down Pie PRO
  • Get Drill Down Donut PRO
  • Get Drill Down Shape Map PRO
envelope icon

Want more info like this?

Subscribe to our newsletter and be the first to read our latest articles and expert data visualization tips!


Find out more

May 08, 2025

Blog Thumbnail
Guides

Data Literacy: What It Is and Why Every Modern Professional Needs It

Data literacy is no longer optional - it’s essential for success in today’s data-driven world. From marketers to HR professionals, everyone is expected to analyze data, spot trends, and make smart decisions. This article explores what data literacy really means, why it matters, and how to build it across your team and organization.

Apr 30, 2025

Blog Thumbnail
Product updates

April 2025 Update: Multiple Links in Graph PRO & Total Labels for Stacks

Create multiple links between nodes in Graph, enable and customize value labels for stack totals in Combo & Timeline, and more – read about what’s new in ZoomCharts visuals in April!

Mar 28, 2025

Blog Thumbnail
Product updates

March 2025 Update: Show Difference Between Two Values

This month brings multiple new features for better data visualization: change indicator for comparison between two values; on-chart annotations for Waterfall; layout modes for Network, and other improvements. 

Feb 26, 2025

Blog Thumbnail
Product updates

February 2025: What’s New in ZoomCharts Visuals for Power BI

You can now enable extended axis labels in Combo, Combo Bar and Waterfall, assign lasso shapes to specific shape layers in Map, and enter custom display names for link categories in Graph. Read more about the latest update in this article!

Jan 31, 2025

Blog Thumbnail
Guides

Top 12 Key SaaS Business Metrics You Must Track in 2025

ARR, CLV, NRR, churn, and more – learn about the most important SaaS business metrics, their formulas, how to read and interpret them, and how to best visualize them. 

Jan 15, 2025

Blog Thumbnail
Product updates

January 2025: New Customization Options

We have added outline conditional formatting, color customization for selection and highlight areas, comma-separated source nodes for Graph, and a setting to hide empty values in the tooltip.
  • 1
  • 2
  • 3
  • 4
  • 5
  • ...
  • 11
  • »

Contents

Share this article

Want more info like this?

Subscribe to our newsletter and be the first to read our latest articles and expert data visualization tips!


Thank you!

Check your inbox to verify your email address.

logo
[email protected]
+44 204 577 3993
logo

Products

Drill Down Network PRO Drill Down Waterfall PRO Drill Down Graph PRO Drill Down Combo PRO Drill Down Combo Bar PRO Drill Down Donut PRO Drill Down Pie PRO Drill Down TimeSeries PRO Drill Down Timeline PRO Drill Down Map PRO Drill Down Scatter PRO All Visuals

Resources

Report Examples Webinars Blog ZoomCharts Academy Visuals Gallery Documentation Custom Visual Development Subscribe to News

Solutions

Custom Visual Development

Company

Pricing About Us Partners Leave feedback Join PowerGroup EU Funding

Help

ZoomCharts Assistance Contact Sales Contact Support FAQ

Drill Down Network PRO Drill Down Waterfall PRO Drill Down Graph PRO Drill Down Combo PRO Drill Down Combo Bar PRO Drill Down Donut PRO Drill Down Pie PRO Drill Down TimeSeries PRO Drill Down Timeline PRO Drill Down Map PRO Drill Down Scatter PRO All Visuals

Report Examples Webinars Blog ZoomCharts Academy Visuals Gallery Documentation Custom Visual Development Subscribe to News

Custom Visual Development

Pricing About Us Partners Leave feedback Join PowerGroup EU Funding

ZoomCharts Assistance Contact Sales Contact Support FAQ
+44 204 577 3993
[email protected]

Ready to get in touch?

Contact our experts with any question about Power BI and ZoomCharts for Free!

Contact us

© 2025, Data Visualization Software Lab

U.S. Patents No. 11,645,343; 11,921,804

Cookies Policy
Manage cookies
Privacy Policy
Global
EULA
Patent
warning

Error message

success

Success info: Done!

ZoomCharts AI Assistant

We noticed you're using an old OS version.

For the best experience, we recommend upgrading to ensure that all website features display correctly.

Cookie settings

We use necessary cookies for site functionality, as well as statistic, marketing, and preference cookies to enhance your experience. For more information and to manage your preferences, please visit our Cookie policy