Nov 02, 2026
8 Best Power BI ECommerce Dashboard Examples for 2027
Explore 8 real dashboard examples covering e-commerce sales performance, customer profitability, inventory, returns, and operational efficiency. Each example includes a link to the interactive report and its downloadable PBIX template.
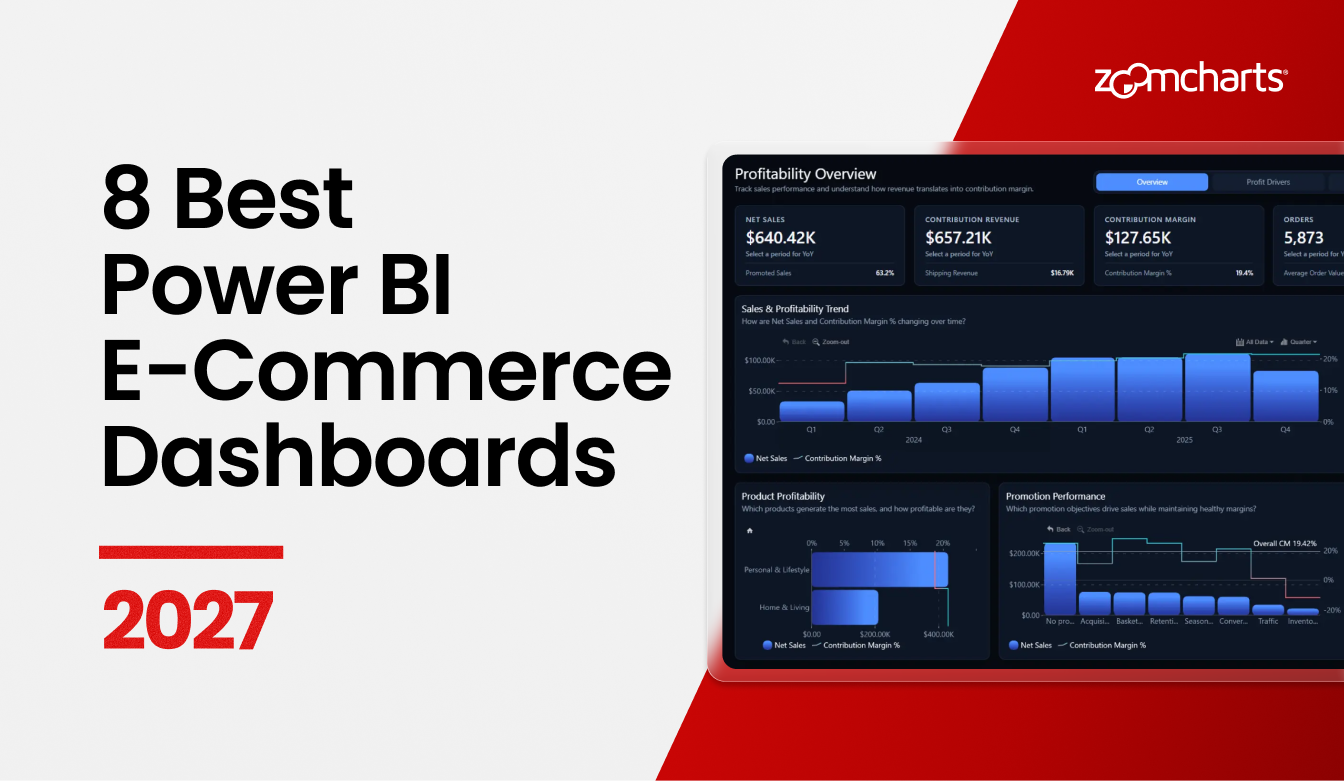
Explore 8 real dashboard examples covering e-commerce sales performance, customer profitability, inventory, returns, and operational efficiency. Each example includes a link to the interactive report and its downloadable PBIX template.
What does a profitable online store look like beyond its sales figures? A well-designed Power BI e-commerce dashboard should help you see which products earn their margin, where discounts and returns eat into revenue, and whether fulfillment and inventory are keeping up.
We selected eight real reports from the ZoomCharts Template Gallery for their clear layouts, useful interactions, and thoughtful approach to e-commerce analysis. The selection includes recognized designs from the September 2026 Power BI challenge and a ZoomCharts-built template. Each example links to a report you can explore and a PBIX template you can use as a starting point.
How to Choose an E-commerce Dashboard
Choose by the question you need to answer. The first two reports connect commercial results with operations. The interactive analytics report supports scenario testing, while Margin Ledger is designed for guided exploration. If you prefer fewer chart types, look at the profit and margin dashboard.
1. E-Commerce Profitability & Operations Power BI Dashboard
Best for: Connecting profitability with customers, inventory, fulfillment, and returns
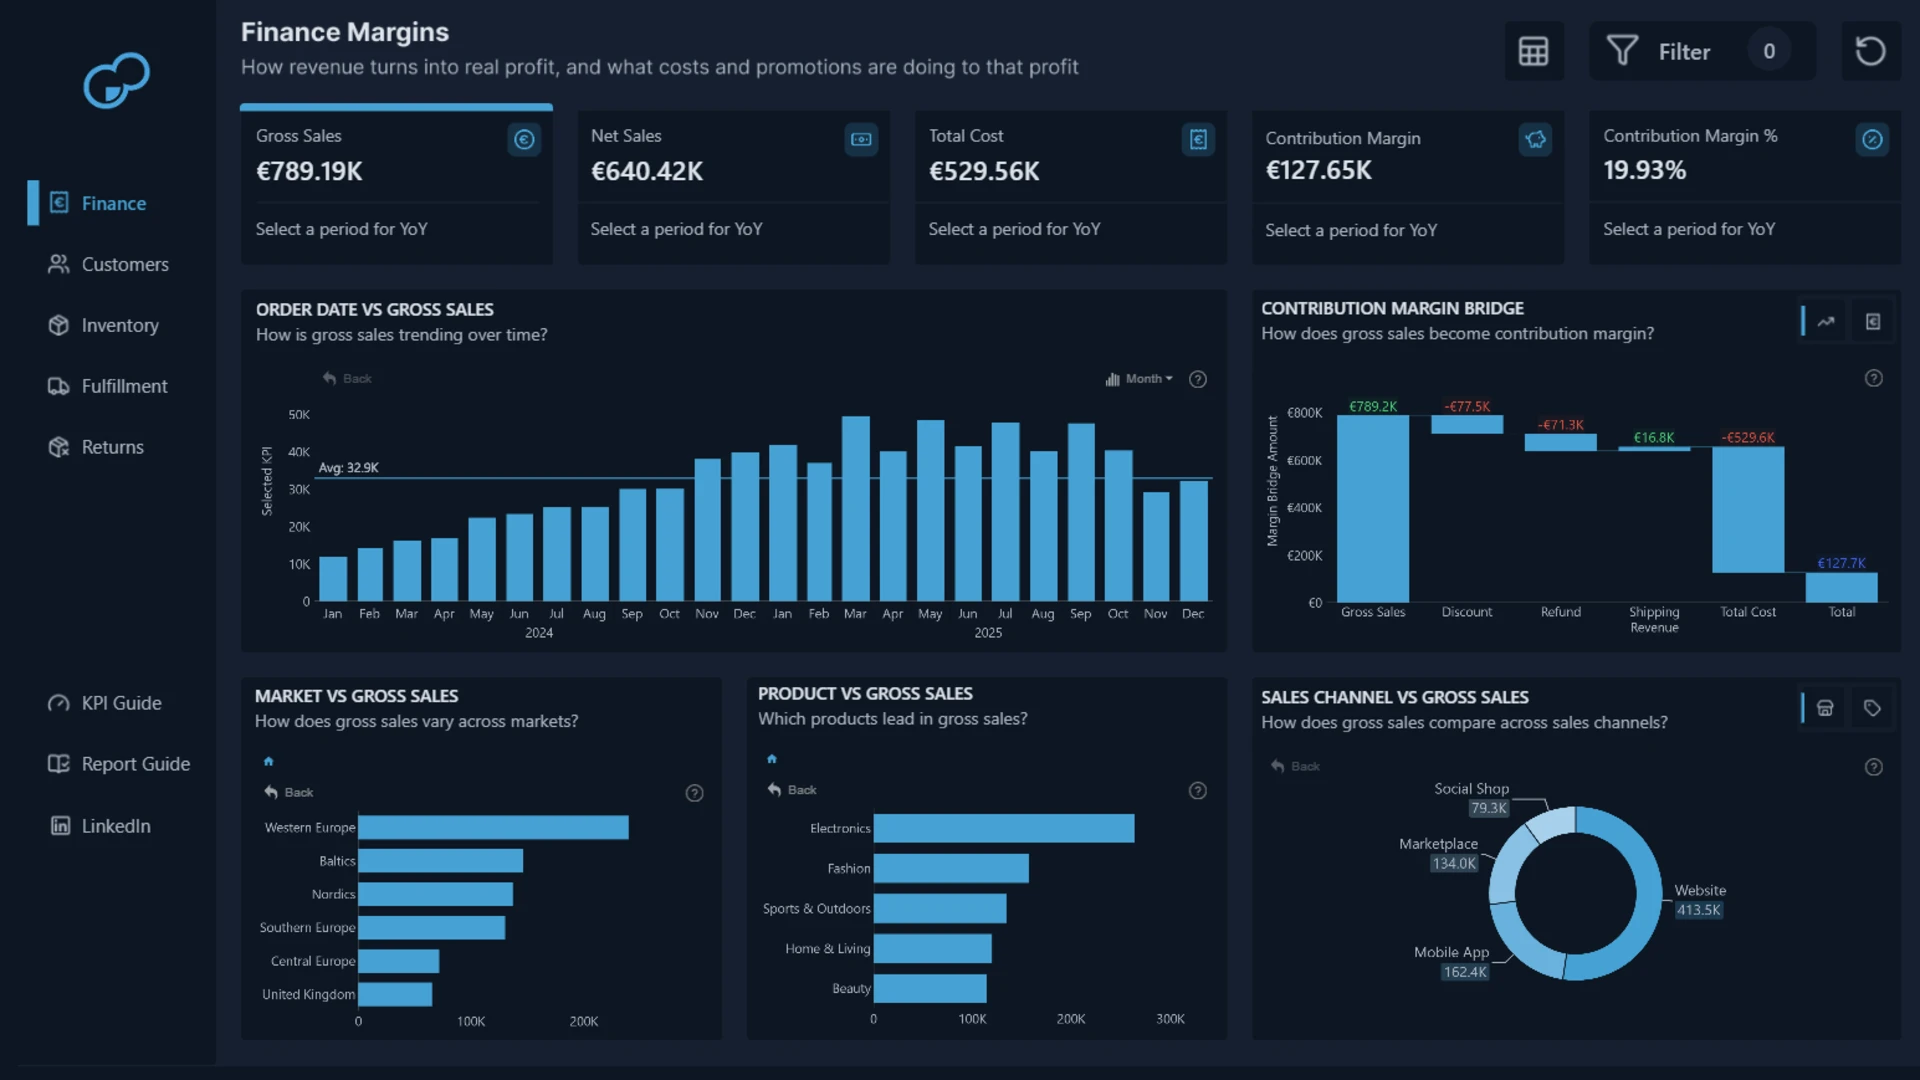
This winning report analyzes more than 9,100 order-line records across 12 European countries. Its five views cover Finance, Customers, Inventory, Fulfillment, and Returns.
The structure is the reason this broad report stays readable. Finance establishes how gross sales become net sales and contribution margin. The other pages explain the conditions behind that result, including loyalty, stock availability, delivery performance, refunds, processing costs, and lost product value.
Dashboard Author: Mantena Chakradhar
ZoomCharts visuals used: Drill Down Combo PRO, Drill Down Combo Bar PRO, Drill Down Timeline PRO, and Drill Down Donut PRO.
Explore this dashboard template
2. Power BI E-commerce Performance Tracker Dashboard
Best for: A balanced commercial and operational performance view
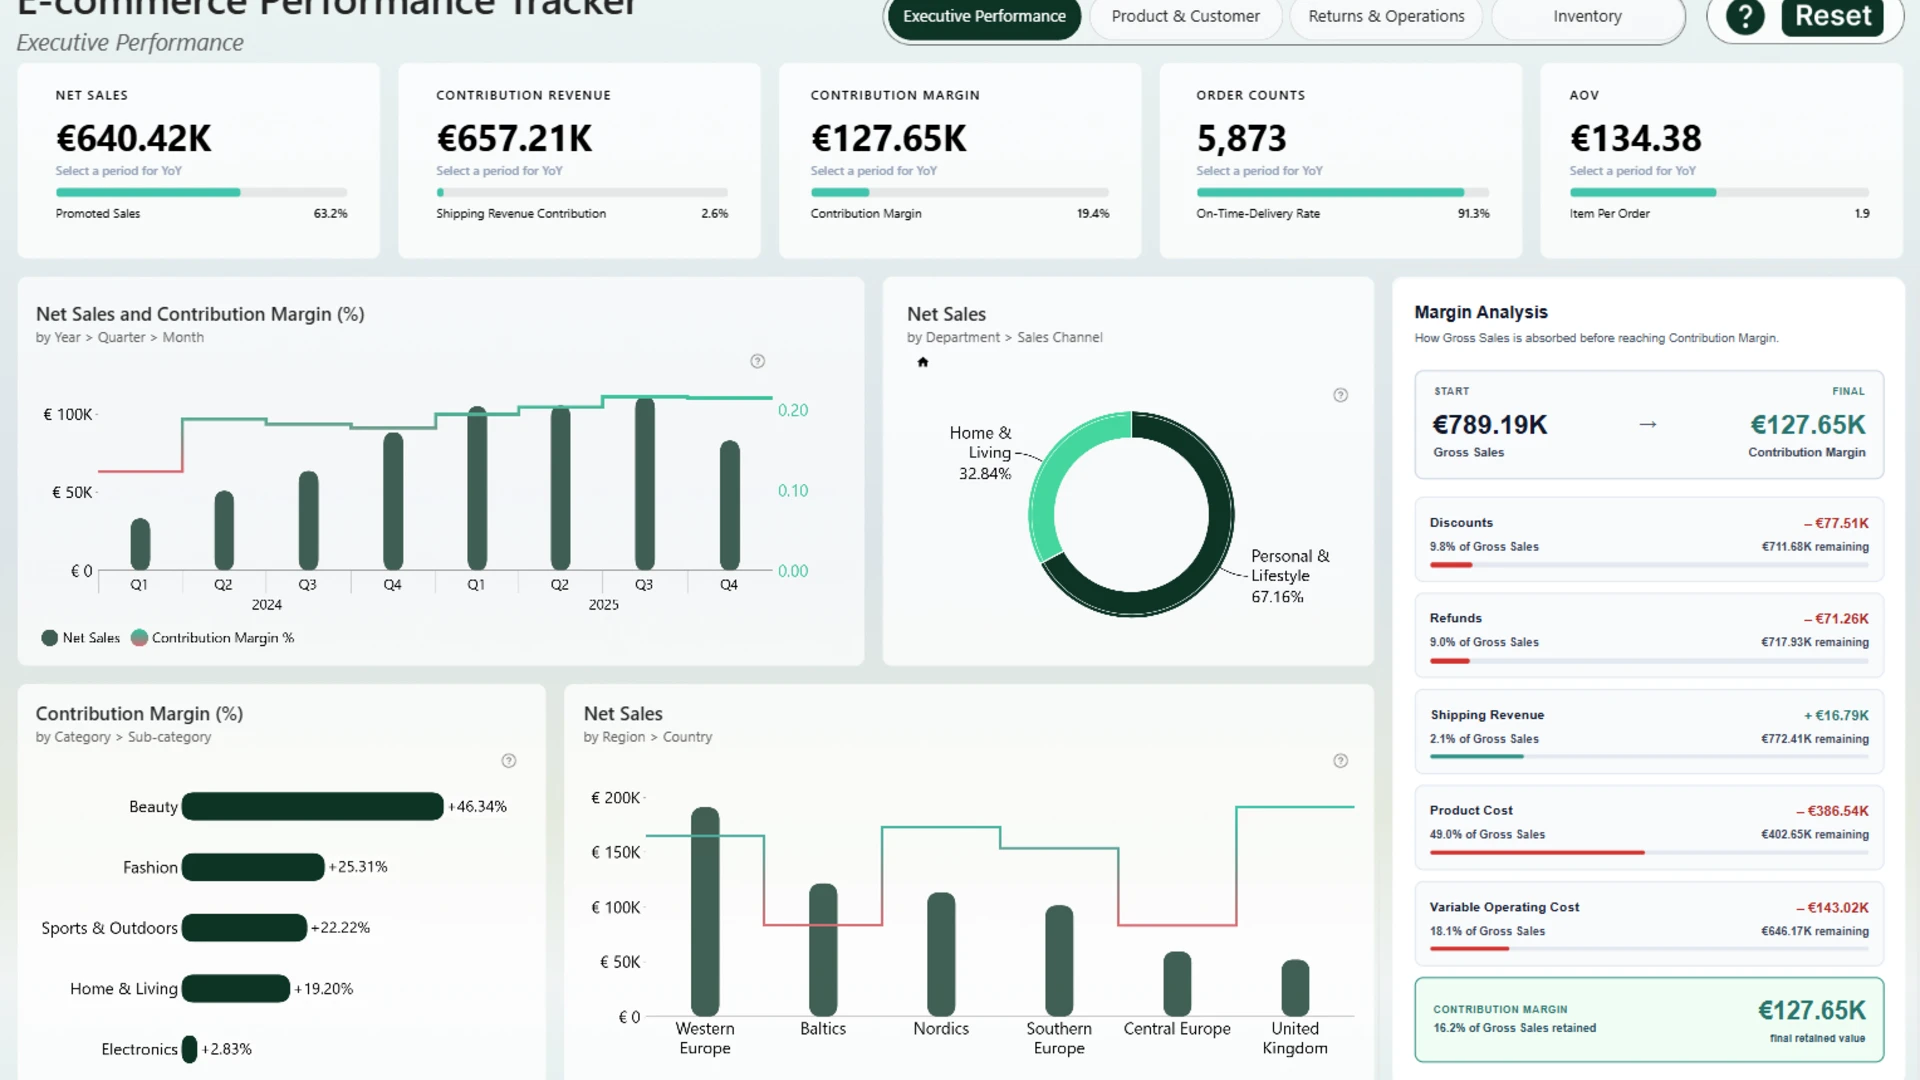
This four-page dashboard covers sales, customers, promotions, returns, fulfillment, and inventory. It connects revenue and margin with customer behavior, promotion effectiveness, delivery performance, stock availability, and potential revenue leakage.
The report handles that breadth with a consistent set of visuals. Scatter charts support relationship analysis, timelines show change, and combo and composition views provide comparison without introducing a new design pattern on every page.
Dashboard Author: Agbata Dickson Ukolojo
ZoomCharts visuals used: Drill Down Scatter PRO, Drill Down Combo PRO, Drill Down Combo Bar PRO, Drill Down Timeline PRO, and Drill Down Donut PRO.
Explore this dashboard template
3. Interactive E-Commerce Analytics Power BI Report
Best for: Combining profitability analysis with scenario testing
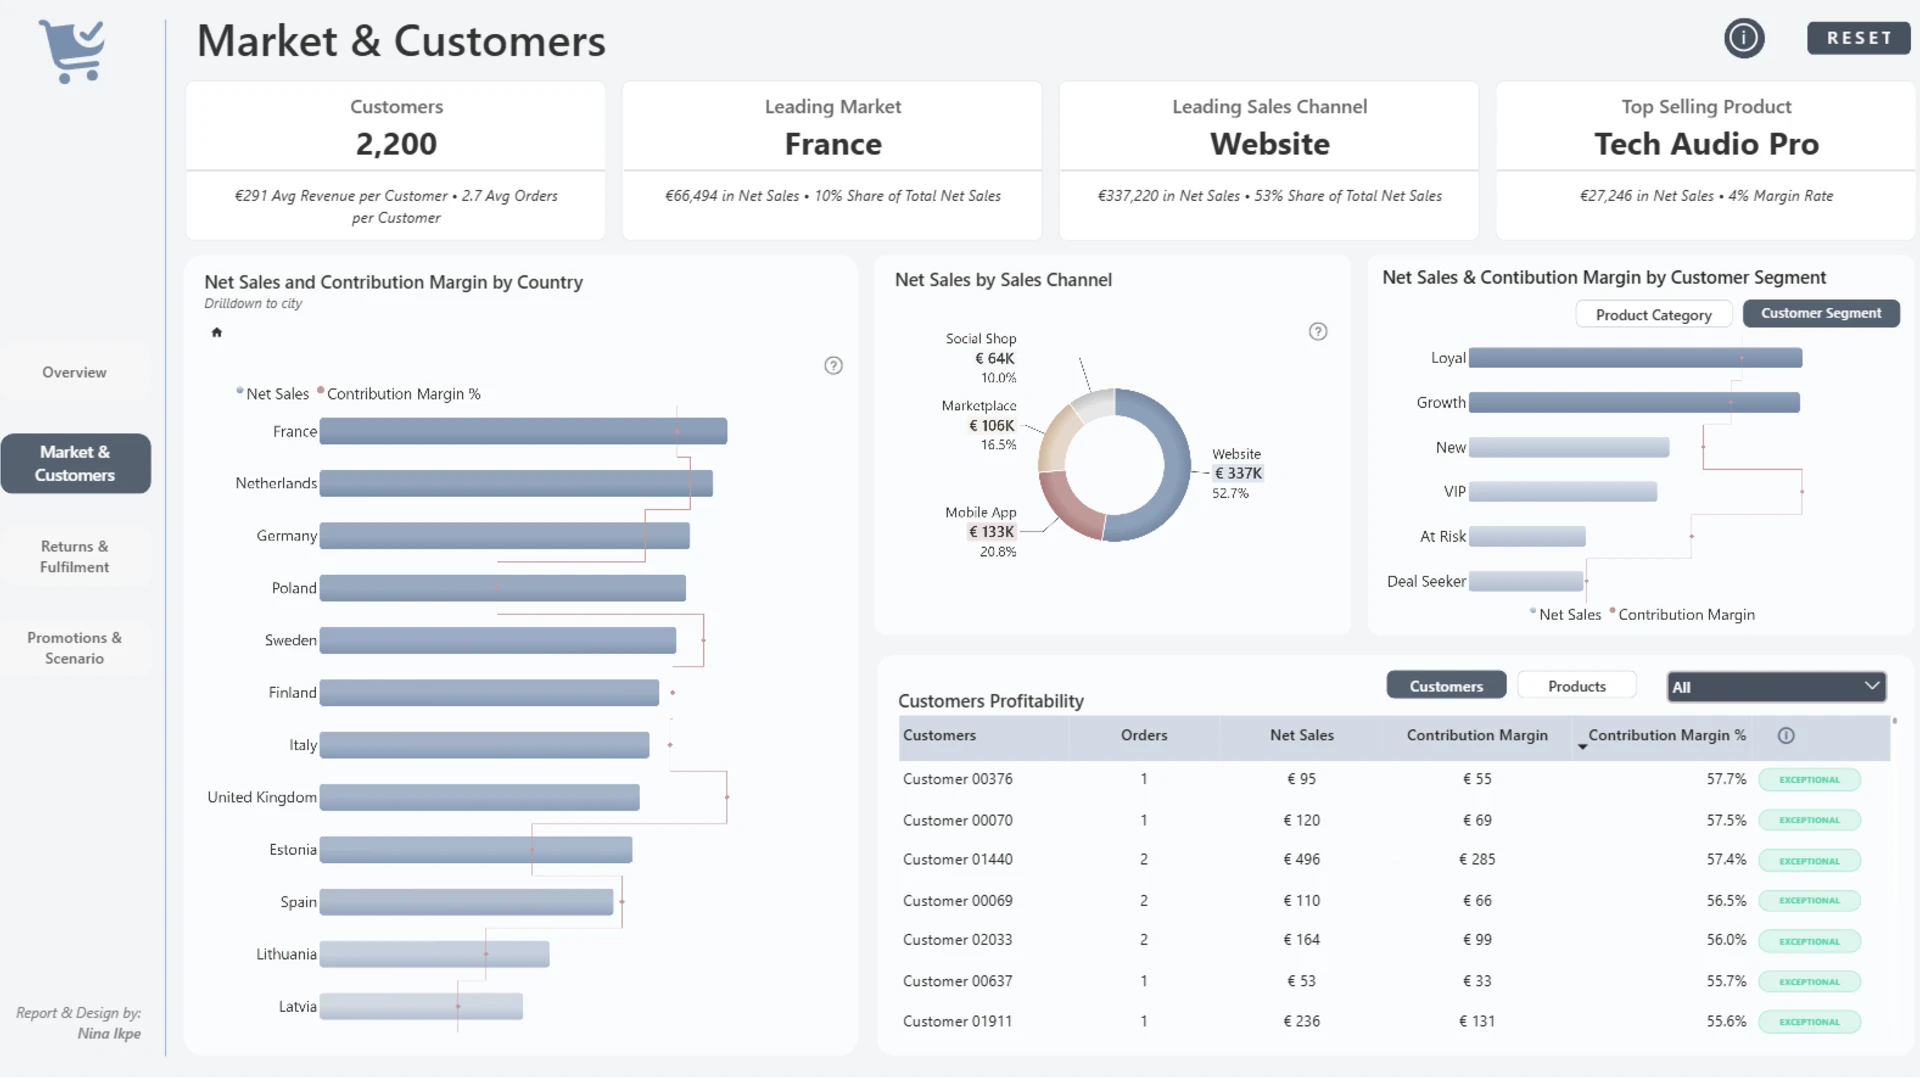
The report starts from a useful premise: more sales do not always create more value. It examines what the business sold, what it kept after costs, and where discounts, refunds, returns, fulfillment, and missed sales weakened the result.
The analytical scope includes customers, markets, campaigns, discount economics, product performance, and return patterns. The final page then changes the report from a review tool into a planning tool. Users can test different demand, discount, and return-rate assumptions and see how those changes could affect sales and contribution margin.
Dashboard Author: Nina Ikpe
ZoomCharts visuals used: Drill Down Bubble PRO, Drill Down Combo PRO, Drill Down Combo Bar PRO, Drill Down Timeline PRO, and Drill Down Donut PRO.
Explore this dashboard template
4. Margin Ledger: E-commerce Profitability Report
Best for: Guided analysis with findings that update as users filter
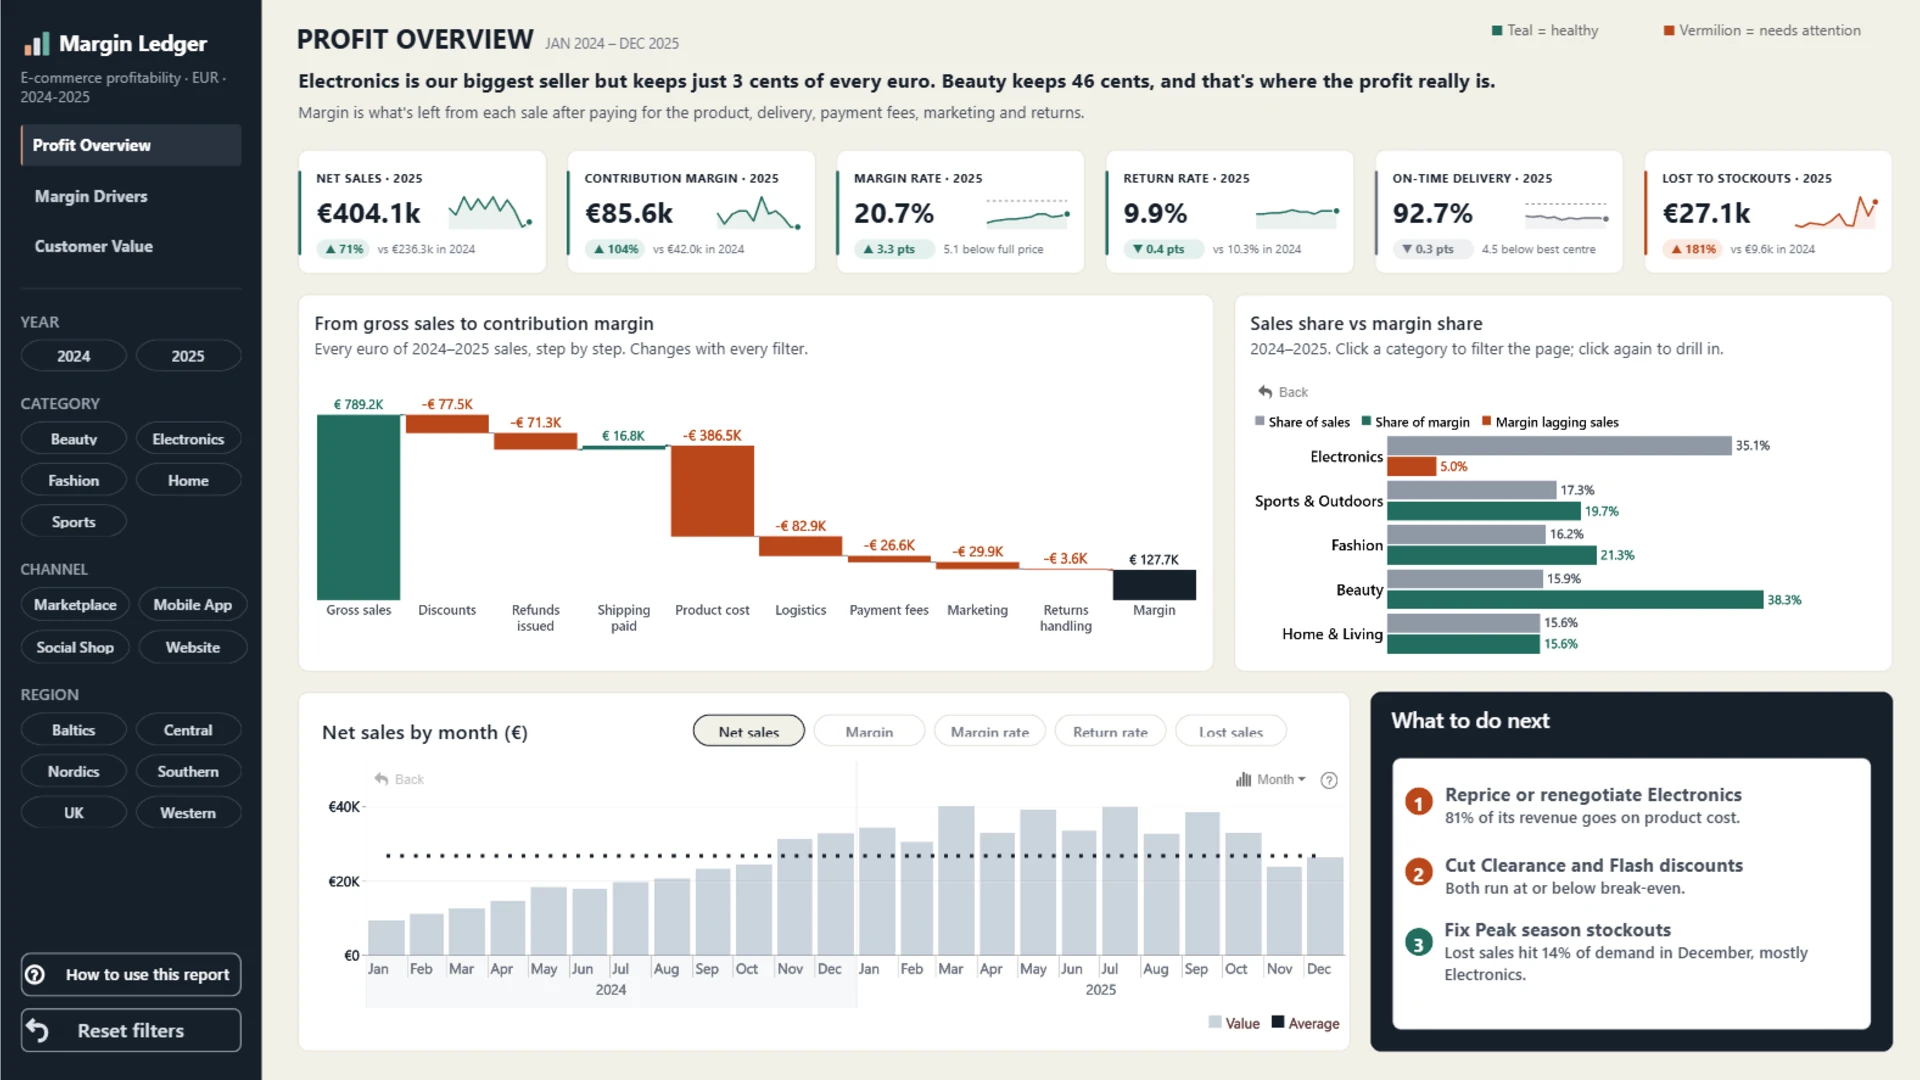
Margin Ledger follows a disciplined three-part story. The first page traces every euro from gross sales to contribution margin. The second examines how discounts, returns, fulfillment, and channels affect margin. The third compares customers by acquisition channel, segment, cohort, and lifecycle stage.
Each page opens with its main finding, and the headline changes with the active filters. This makes the dashboard easier to present and easier to explore. A stakeholder can read the conclusion, inspect the evidence, and then change the selection to see whether the pattern holds elsewhere.
Dashboard Author: Mubarak Lawal
ZoomCharts visuals used: Drill Down Scatter PRO, Drill Down Combo PRO, Drill Down Waterfall PRO, Drill Down Combo Bar PRO, and Drill Down Timeline PRO.
Explore this dashboard template
5. E-commerce Sales Analysis Power BI Dashboard
Best for: Turning profit leakage into specific commercial opportunities
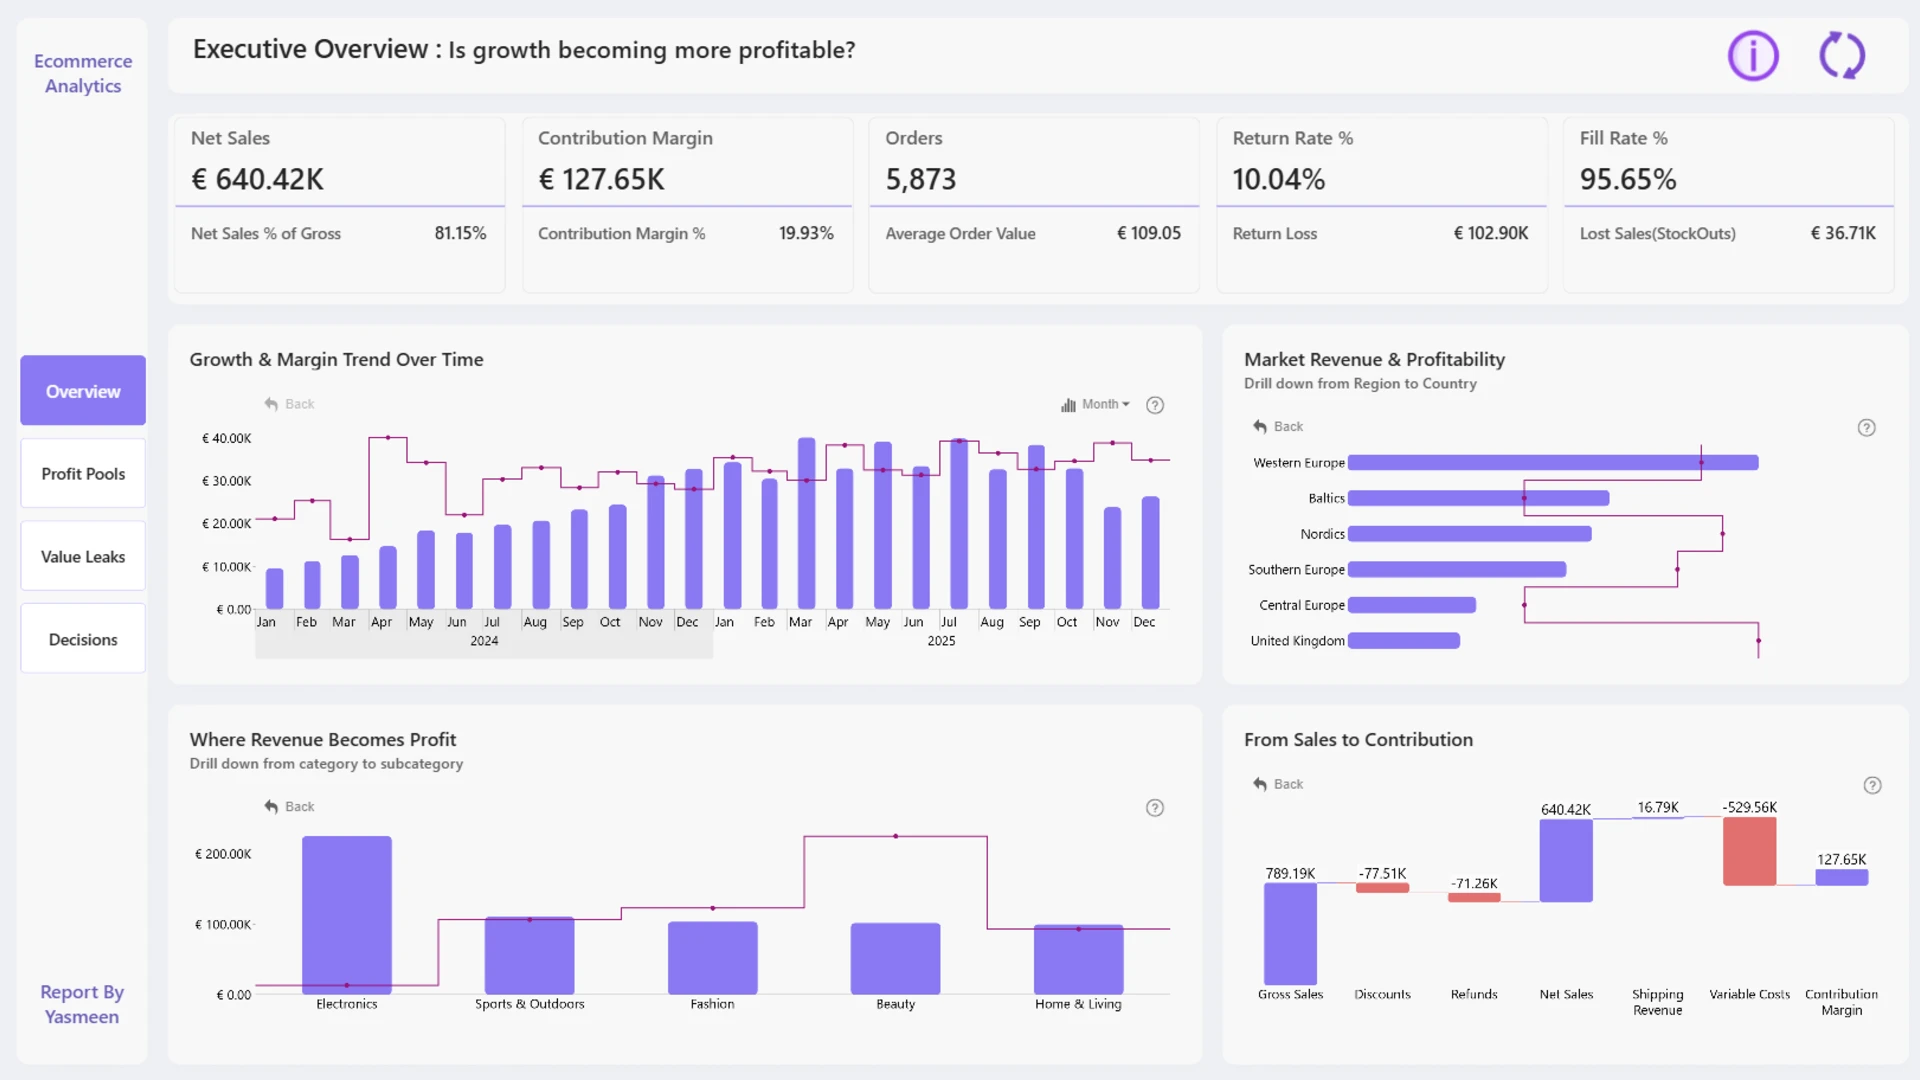
The report examines what remains profitable after discounts, returns, stockouts, fulfillment, shipping, and other variable costs. Its analysis connects growth with promotions, customer segments, channels, geography, and operations.
The report gives its interactions a clear business purpose. A Profit Journey explains how revenue becomes margin. Discount-band analysis shows when promotional pressure becomes destructive. Geographic leakage and delivery health connect market performance with service. A strategic opportunity matrix helps identify where to scale and where to intervene.
Dashboard Author: Yasmeen Amjad
ZoomCharts visuals used: Drill Down Bubble PRO, Drill Down Combo PRO, Drill Down Waterfall PRO, Drill Down Combo Bar PRO, and Drill Down Timeline PRO.
Explore this dashboard template
6. E-commerce Profit and Margin Power BI Dashboard
Best for: A restrained dashboard with a small visual toolkit
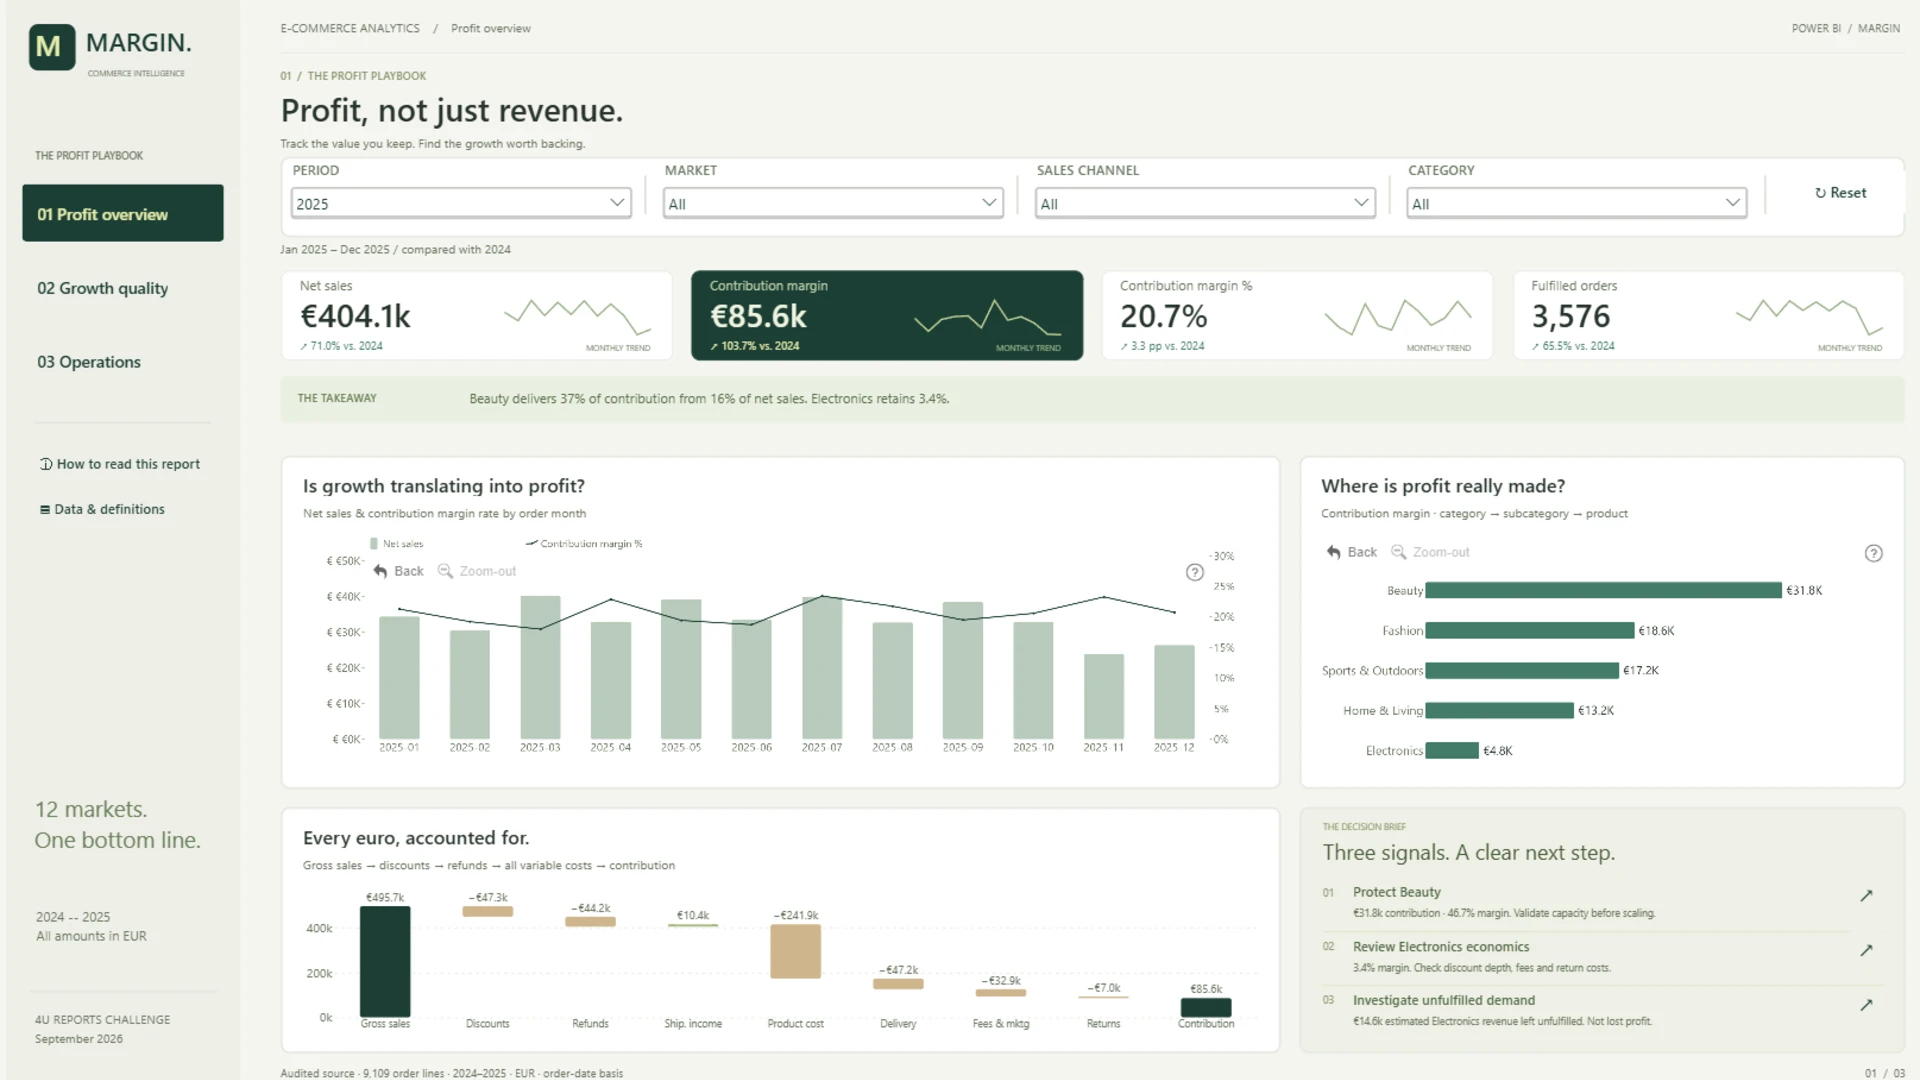
This three-page report examines profitability across 12 European markets using 2024 and 2025 data. It connects products, promotions, and customer behavior with returns, delivery performance, and unfulfilled demand.
Its design stands out for restraint. The report relies on Combo and Timeline visuals instead of adding a different chart type for every measure. That smaller visual vocabulary helps the pages feel related and keeps attention on the information hierarchy.
Dashboard Author: Sanju Yadav
ZoomCharts visuals used: Drill Down Combo PRO and Drill Down Timeline PRO.
Explore this dashboard template
7. Power BI E-Commerce Profitability Dashboard
Best for: A polished three-page view of profit drivers and value leakage
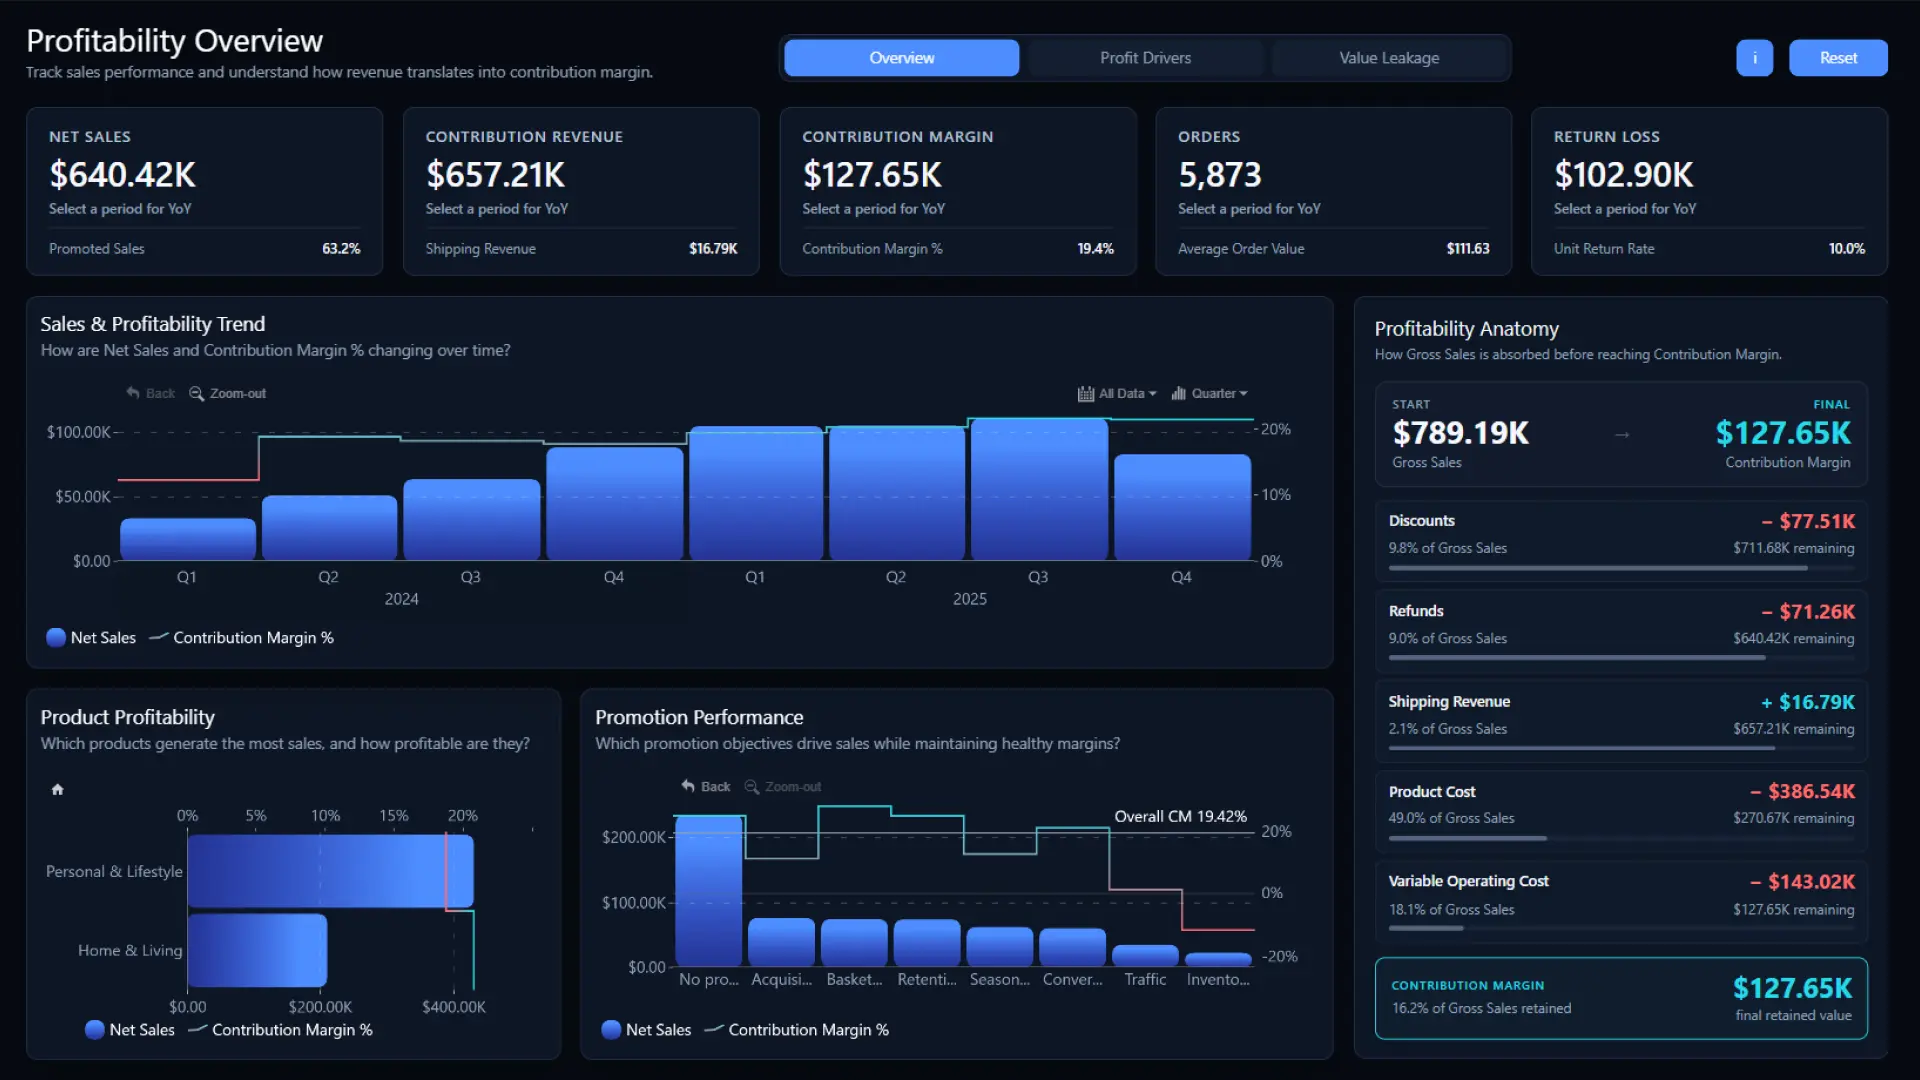
This ZoomCharts template follows a simple route from Overview to Profit Drivers and Value Leakage. It tracks net sales, contribution revenue, contribution margin, orders, average order value, promoted sales, and quarterly trends, then explains how discounts, refunds, product costs, shipping, and operating costs change the final result.
The report also compares brands, customer segments, acquisition channels, sales channels, and European markets. Returns and fulfillment are treated as financial questions, not separate operational footnotes.
Dashboard Author: ZoomCharts
ZoomCharts visuals used: Drill Down Bubble PRO, Drill Down Combo PRO, Drill Down Combo Bar PRO, and Drill Down Timeline PRO.
Explore this dashboard template
8. E-commerce Profitability Dashboard: Engine, Leaks & Action
Best for: A memorable narrative from growth drivers to operational action
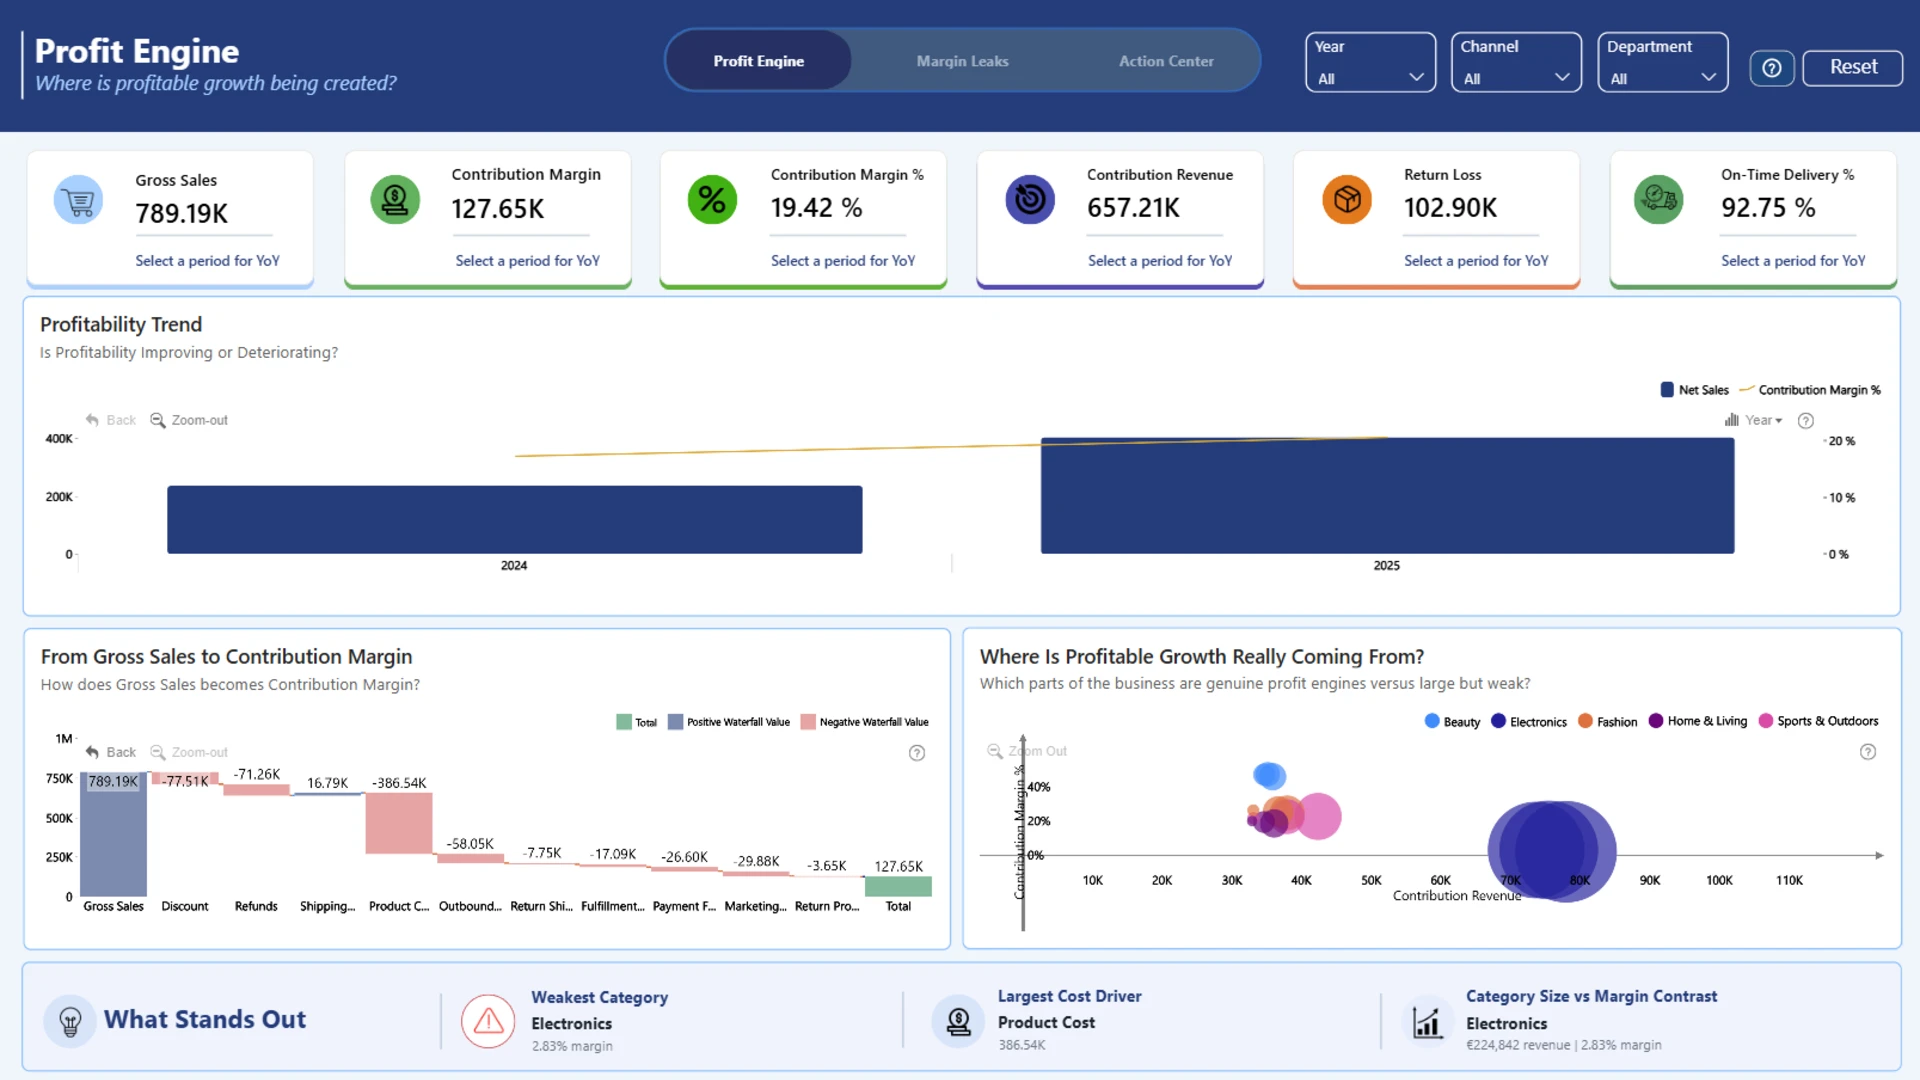
The report uses a language that is easy to remember: Profit Engine, Margin Leaks, and Action Center. The labels orient the reader before any interaction begins and make the analytical sequence clear.
The report connects contribution margin with products, discounts, returns, promotions, fulfillment, and stock availability. Users can move from headline KPIs into time, category, subcategory, and product detail through direct chart interaction.
Dashboard Author: Ines Boulbir
ZoomCharts visuals used: Drill Down Bubble PRO, Drill Down Combo PRO, Drill Down Waterfall PRO, Drill Down Combo Bar PRO, and Drill Down Timeline PRO.
Explore this dashboard template
What to include in E-Commerce dashboard
- Follow the money: Connect gross sales to net sales and contribution margin so the effect of discounts, returns, and costs is visible.
- Keep the overview focused: Give sales, customers, inventory, and fulfillment their own space when one page would become crowded.
- Make interactions predictable: Consistent filters and drill-down behavior help users investigate without learning a new interface on every page.
- Design for action: Show where profitability is lost, then provide enough product, channel, or customer detail to investigate the cause.
No single layout works for every online retailer. A commercial team may need campaign and customer views, while a finance team may care more about contribution margin and returns. Browse the reports above, test the interactions, and choose a PBIX template that matches the questions your team actually asks.
Browse the ZoomCharts Template Gallery
Try ZoomCharts Drill Down Visuals Free for 30 Days
Explore direct chart selection, cross-filtering, and drill-down in your own Power BI reports with a 30-day trial.

Want more info like this?
Subscribe to our newsletter and be the first to read our latest articles and expert data visualization tips!