225
ECommerce Profit and Marging Power BI Dashboard
ECommerce Profit and Marging Power BI Dashboard
More Report pages
Report Author: sanju yadav
225
Share template with others
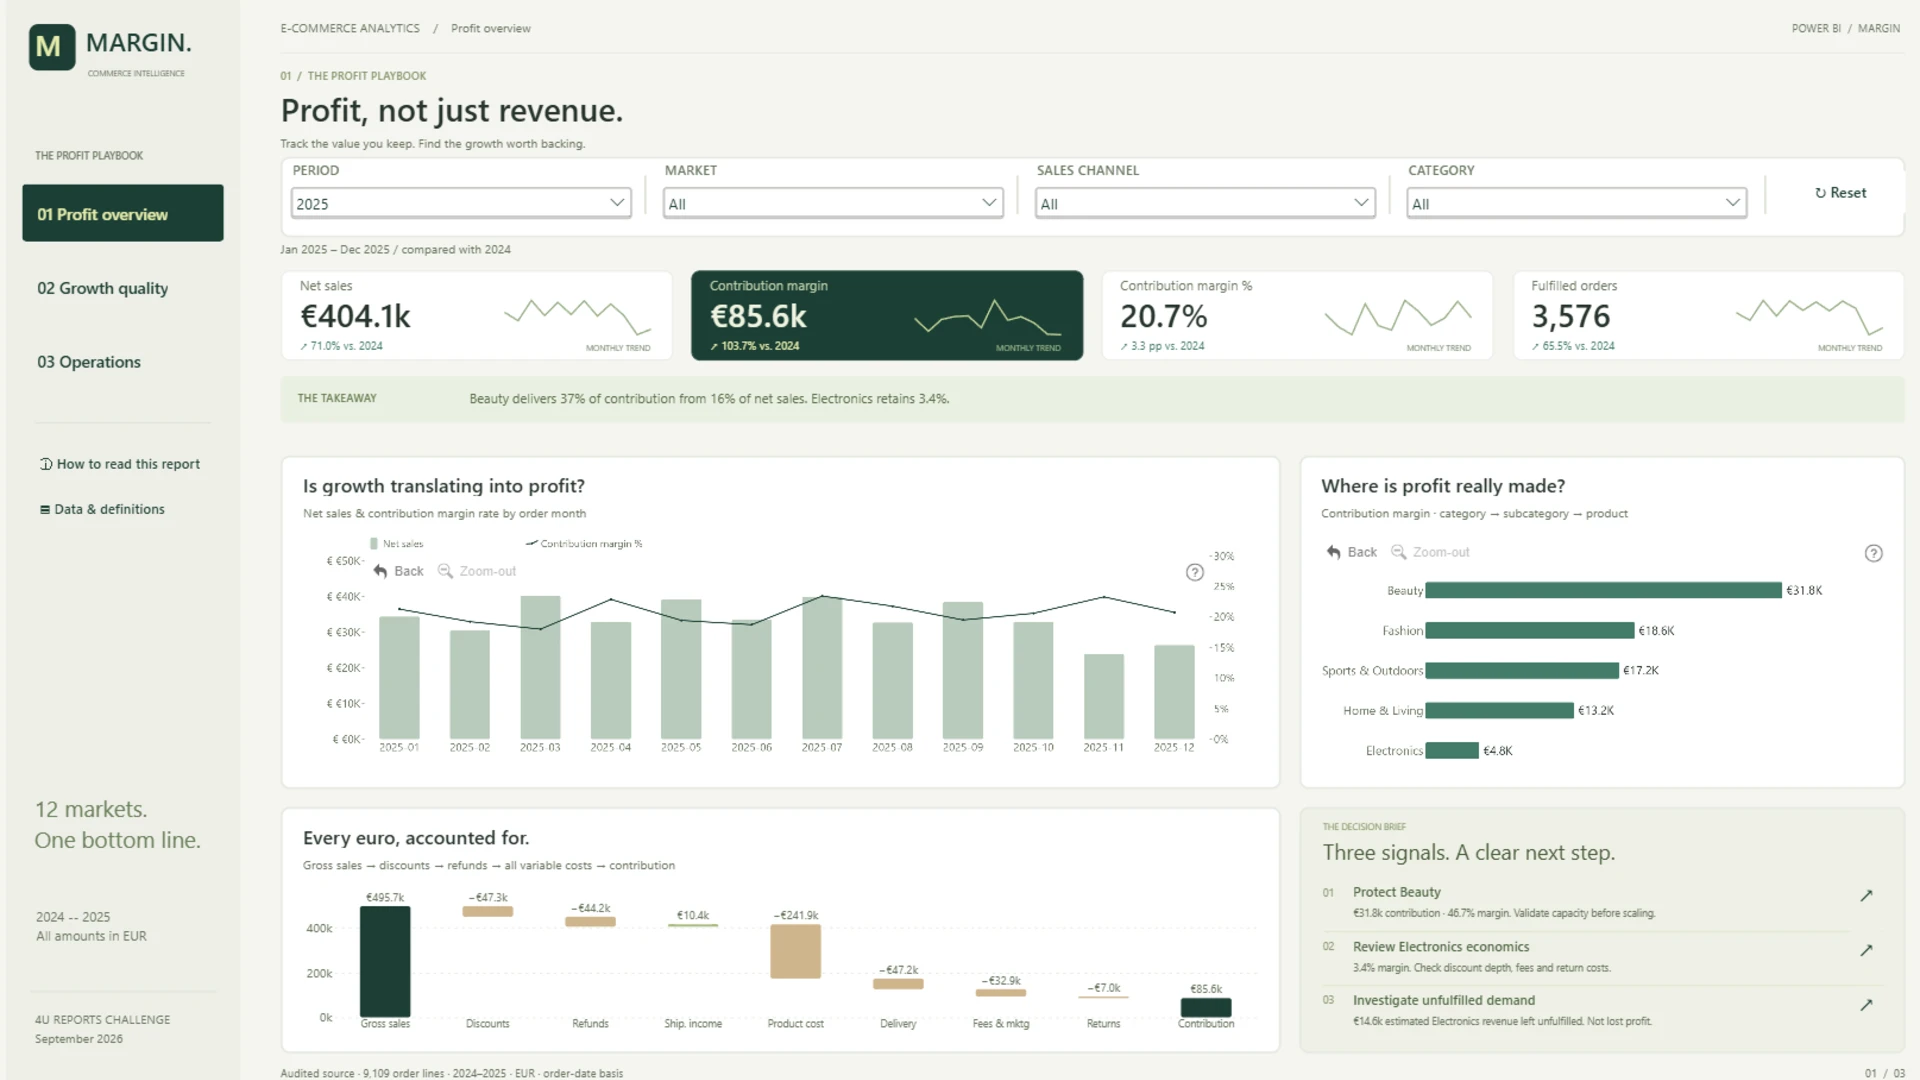
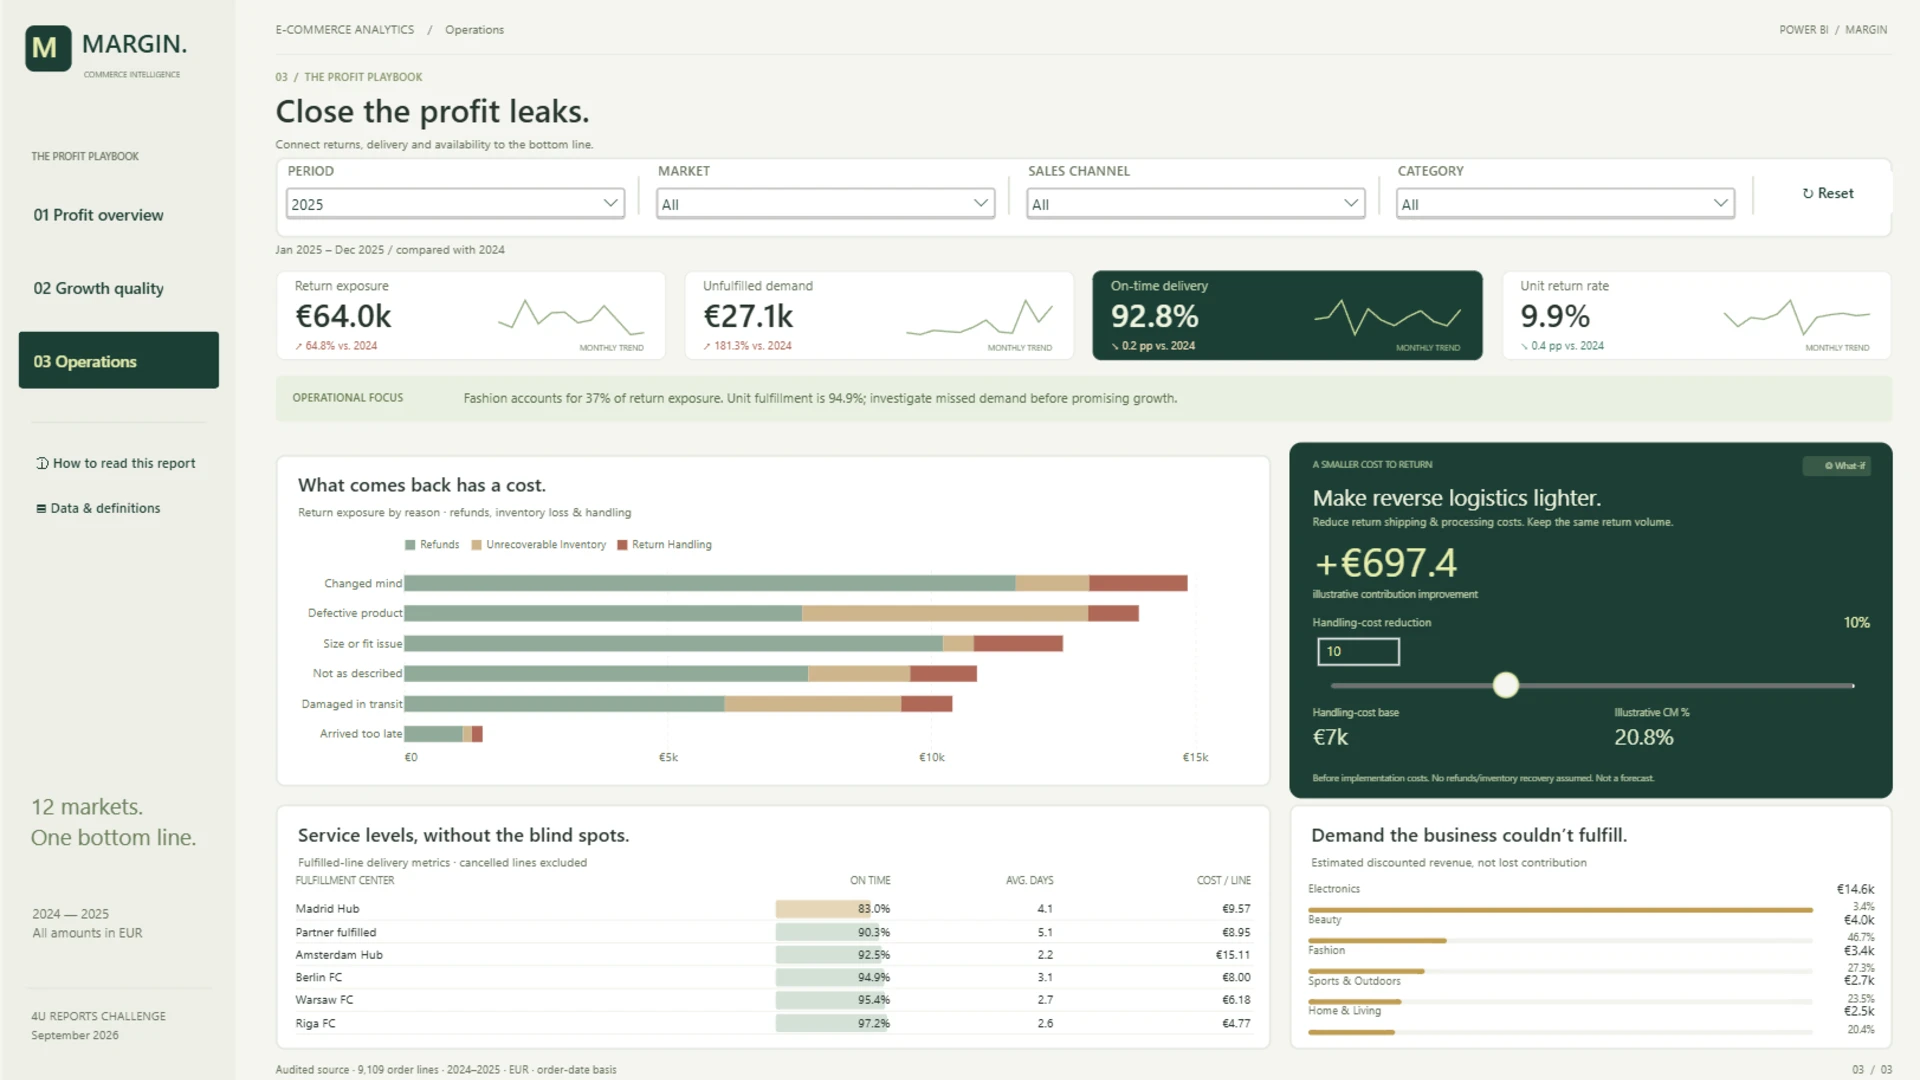
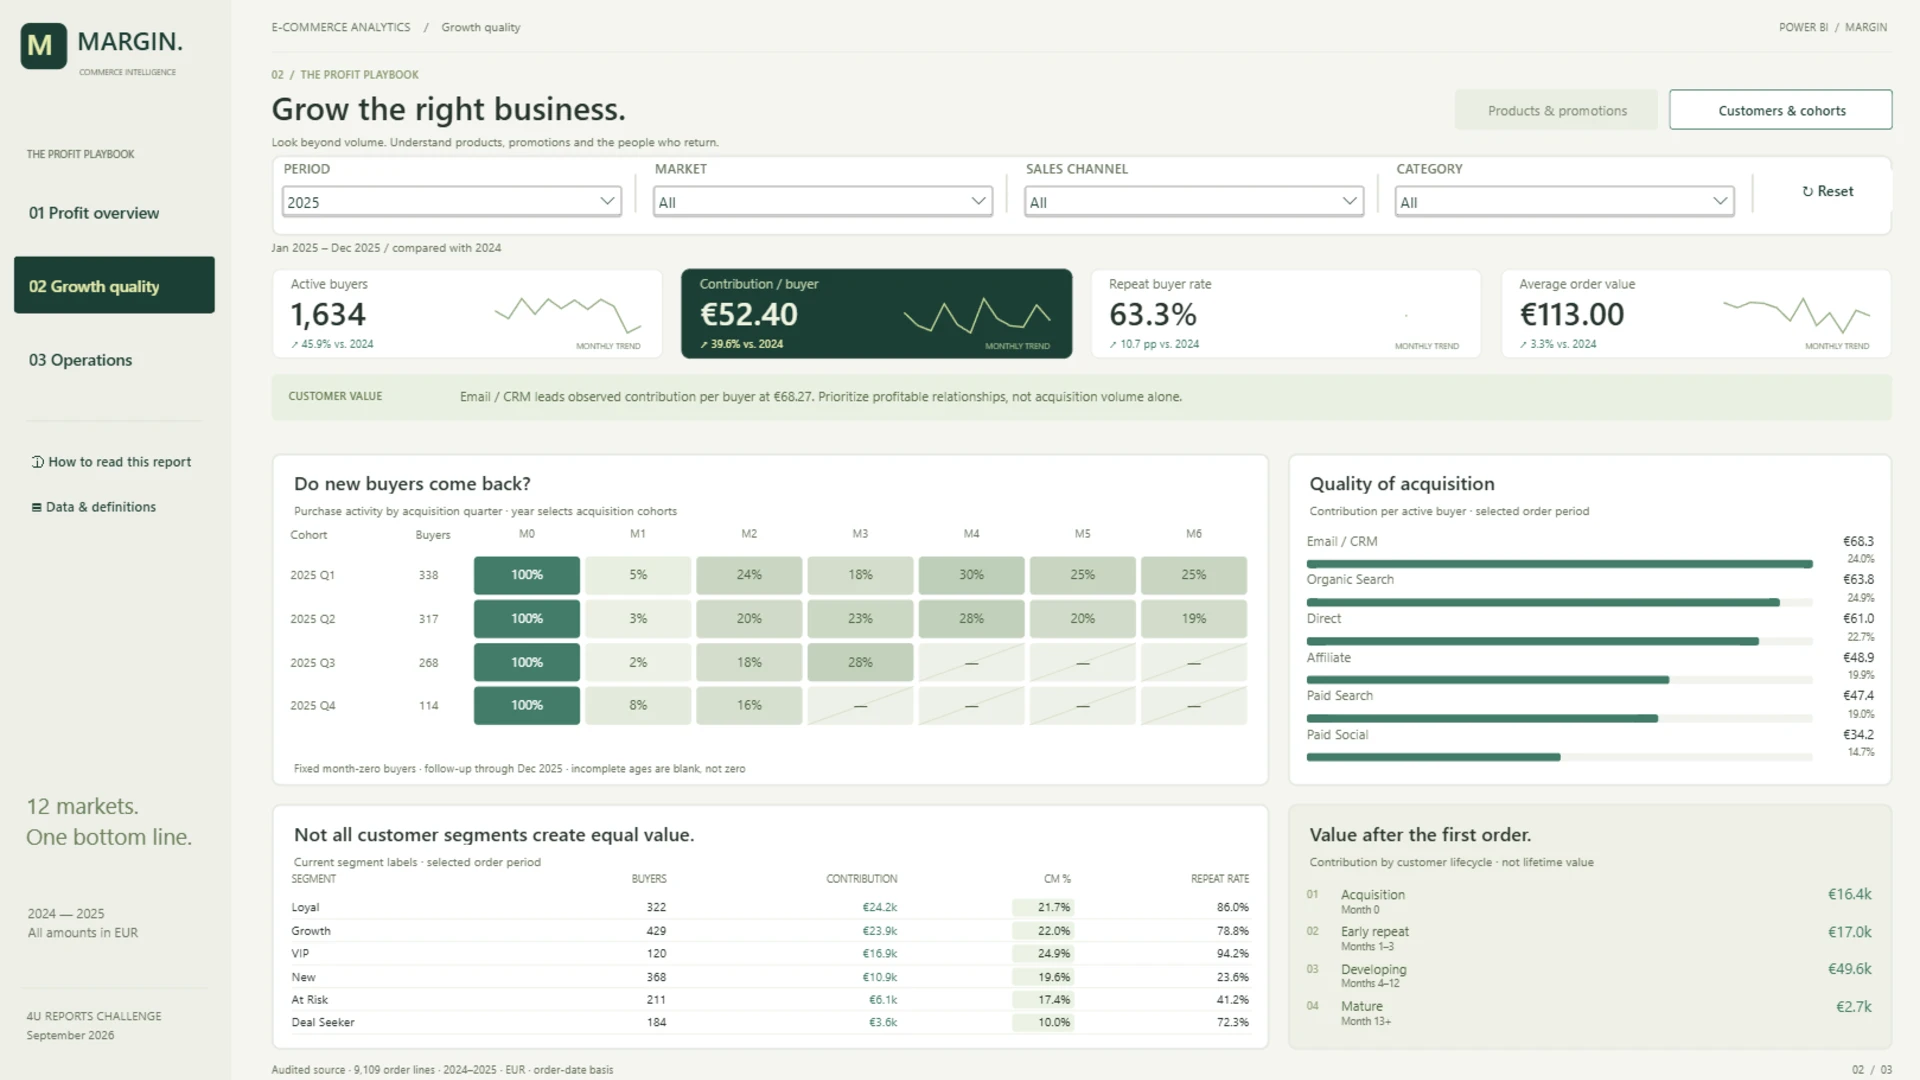
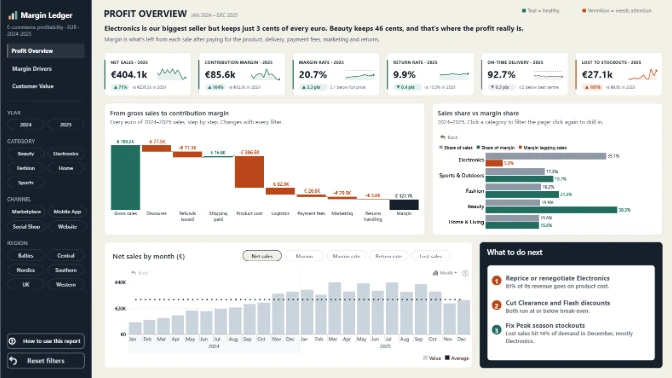
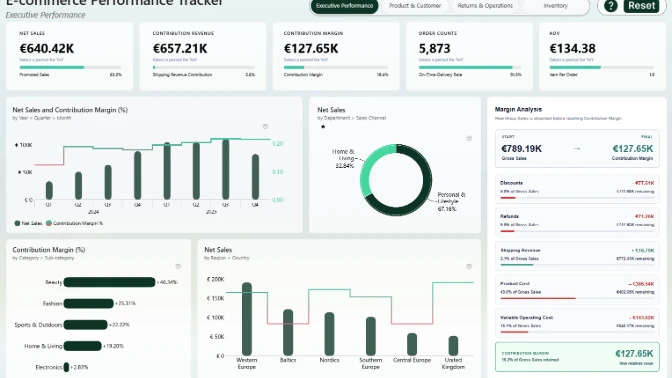
ECommerce Profit and Marging Power BI Dashboard explores e-commerce profitability across 12 European markets using 2024–2025 data. Three interactive pages examine profit performance, growth quality and operational efficiency, connecting products, promotions and customer behavior with returns, delivery performance and unfulfilled demand. ZoomCharts drill-downs and an illustrative return-handling cost scenario help identify margin pressure and prioritize improvement opportunities.


4U Report Challenges
Participate in data challenges, build and submit reports to get free template downloads.
Join CommunityMobile view allows you to interact with the report. To Download the template please switch to desktop view.
How to use a PBIX template
Preview the interactive report, download the PBIX file, open it in Power BI Desktop, and replace the same data connection with your own dataset.
Preview and download
Explore the report online and download the PBIX template file.
Open in Power BI Desktop
Open the downloaded PBIX file in Power BI Desktop.
Connect your data
Replace the sample data source with your own dataset.
Refresh and adjust
Refresh the model and update fields or visual were needed.
Save and share
Save your report and publish it for your audience.


