697
Interactive E-Commerce Analytics Power BI Report
Interactive E-Commerce Analytics Power BI Report
More Report pages
Report Author: Nina Ikpe
697
Share template with others
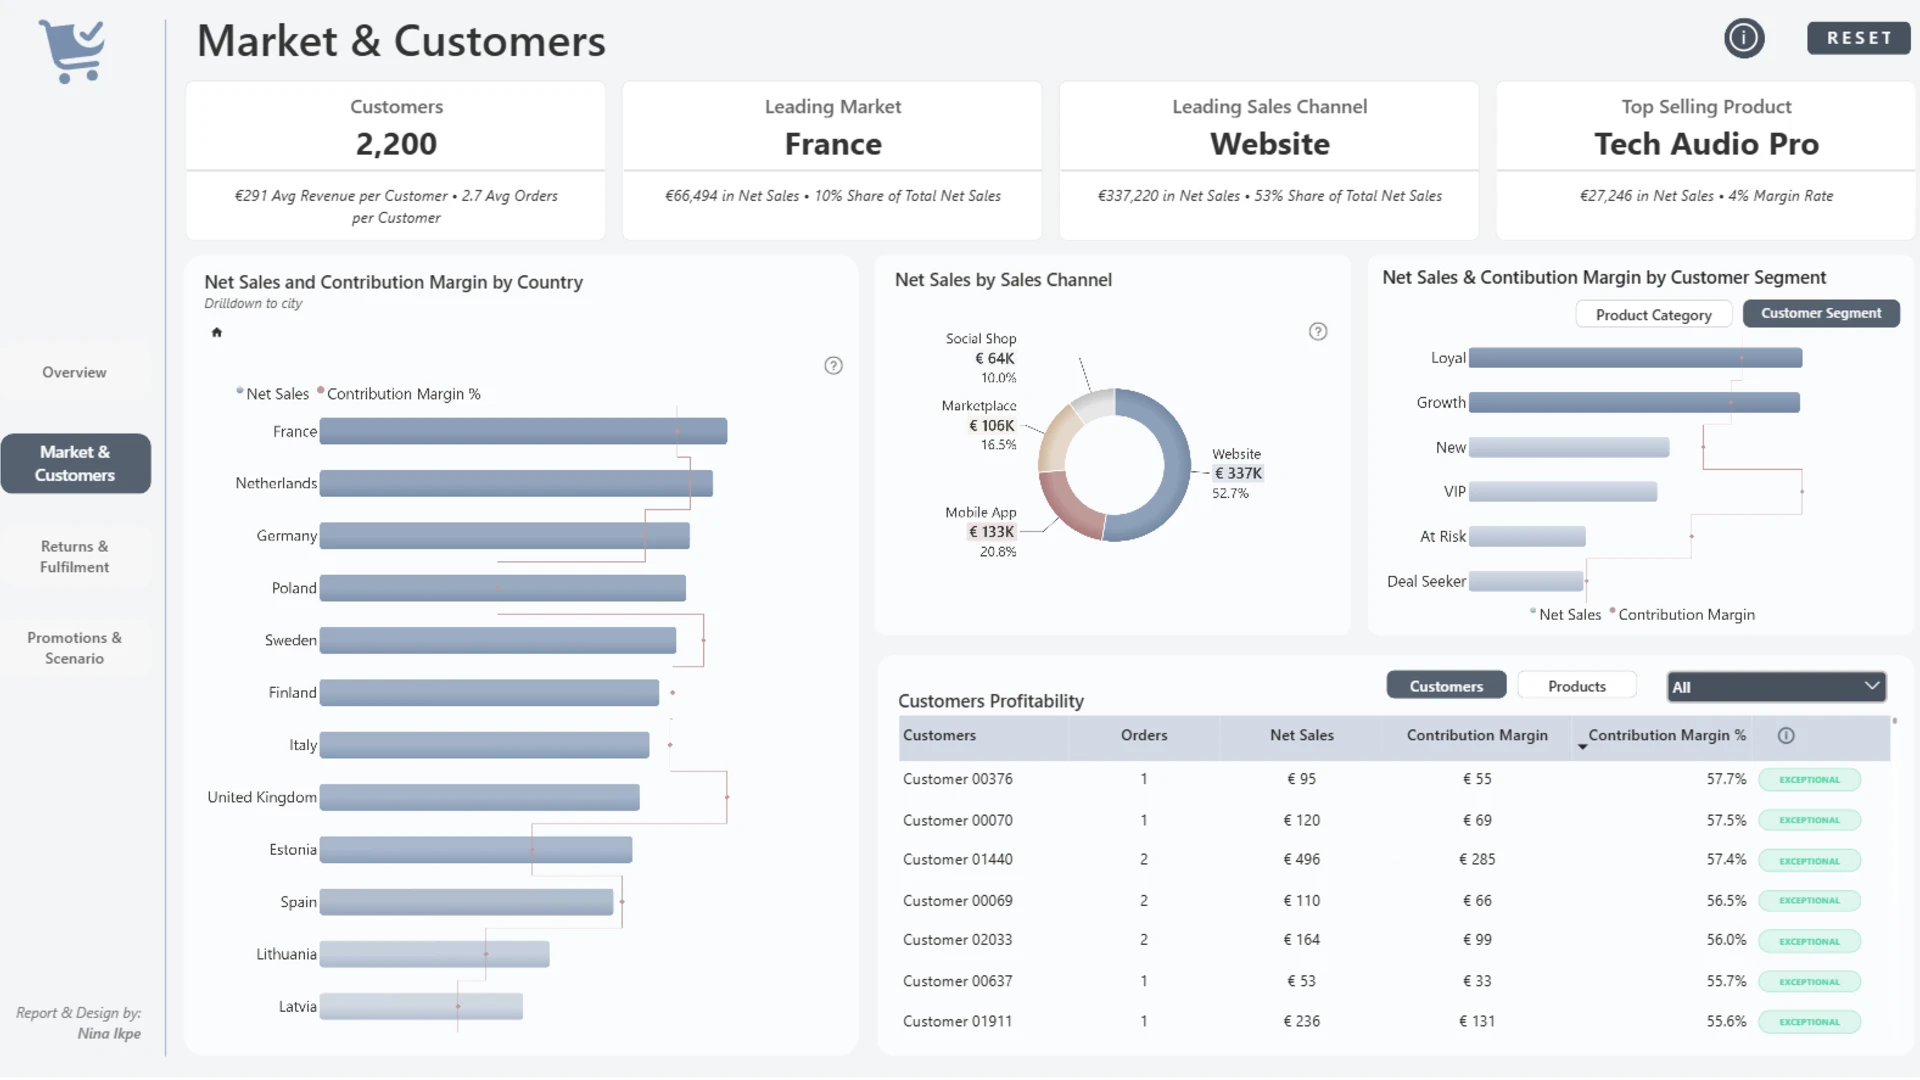
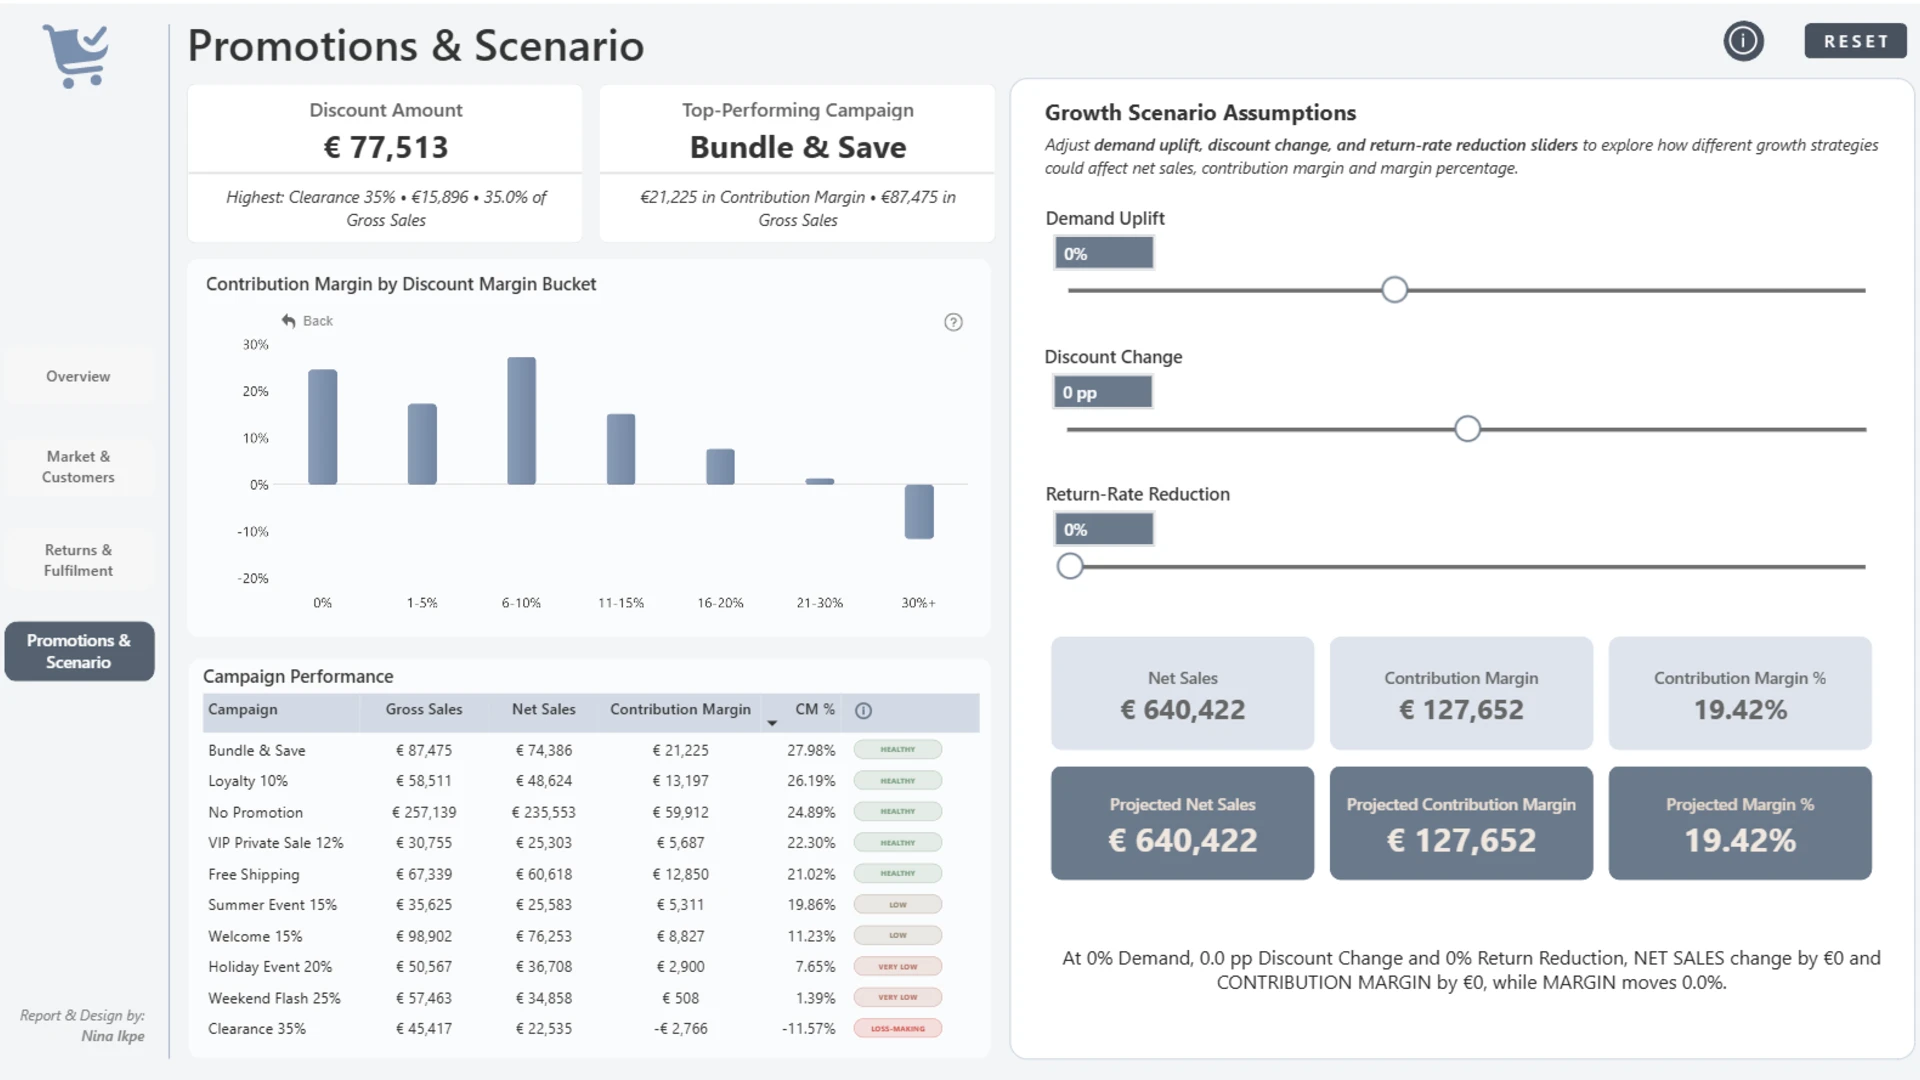
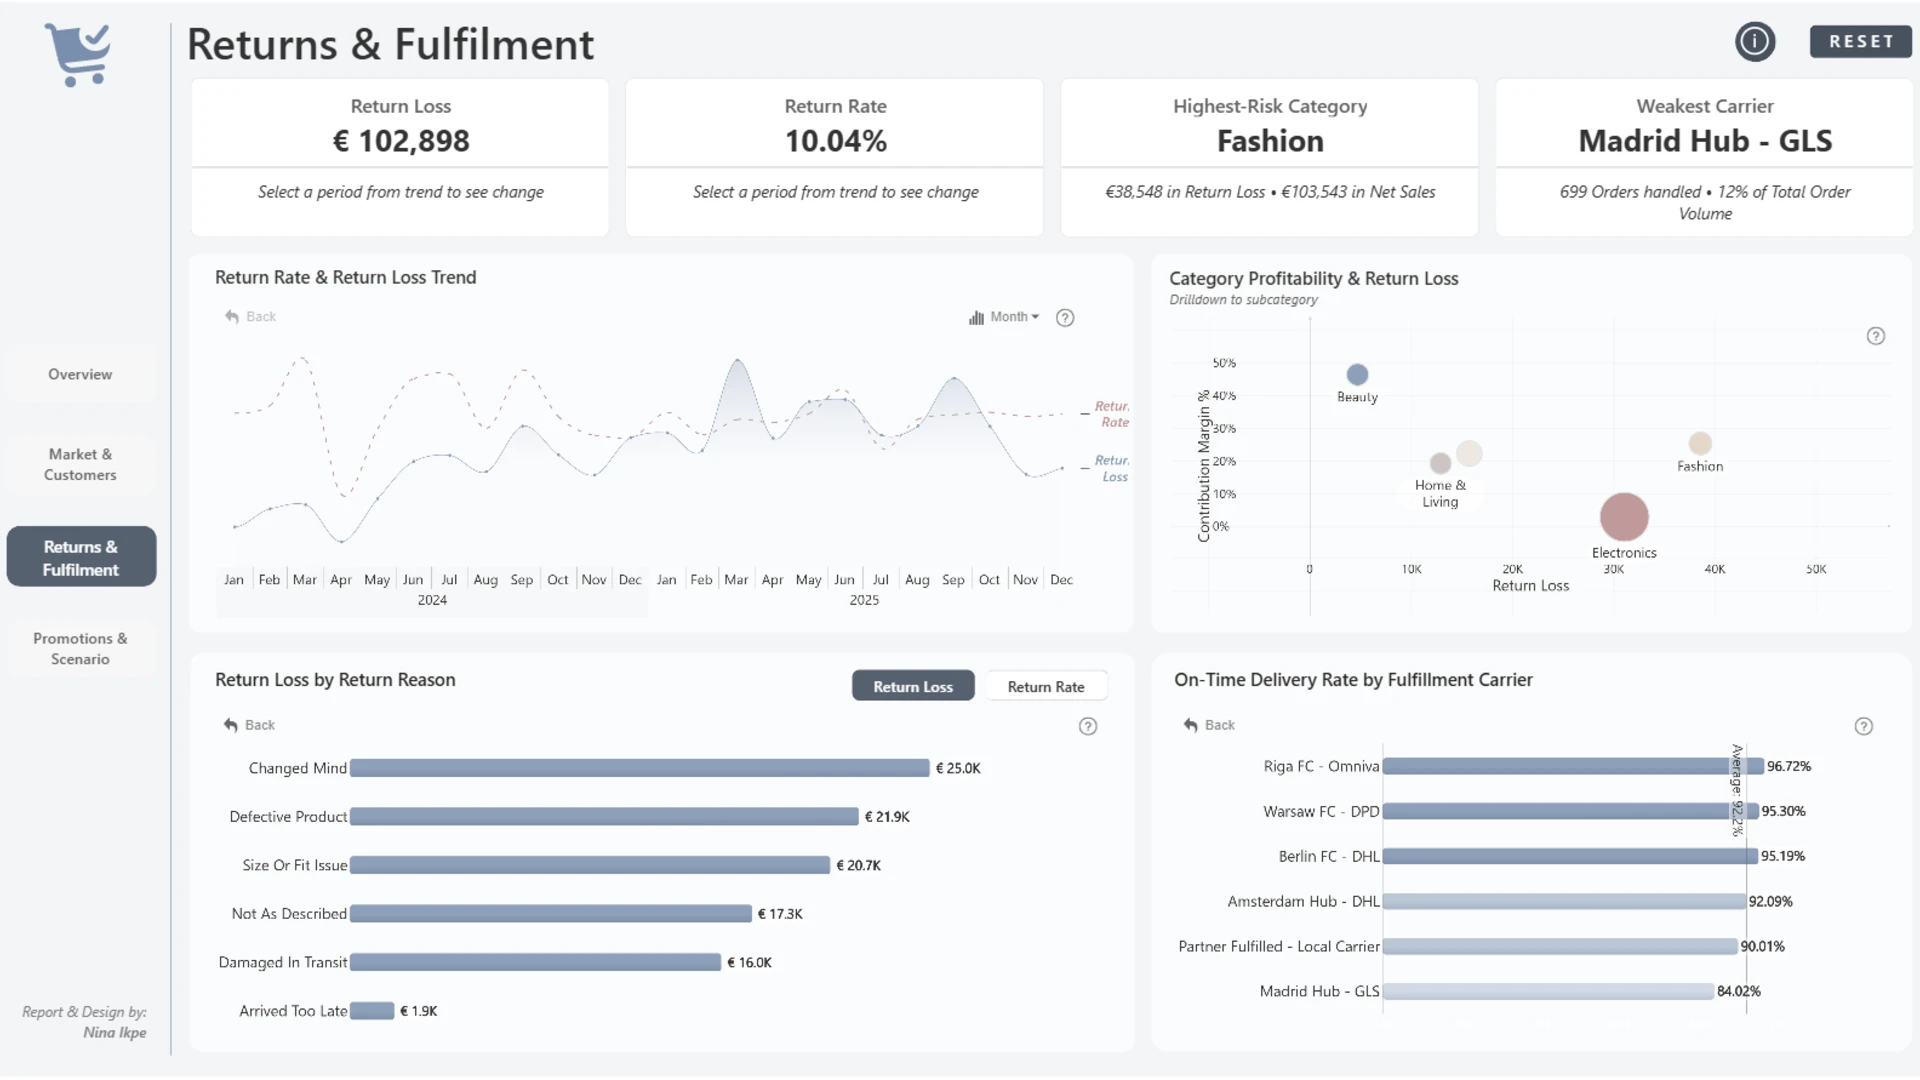
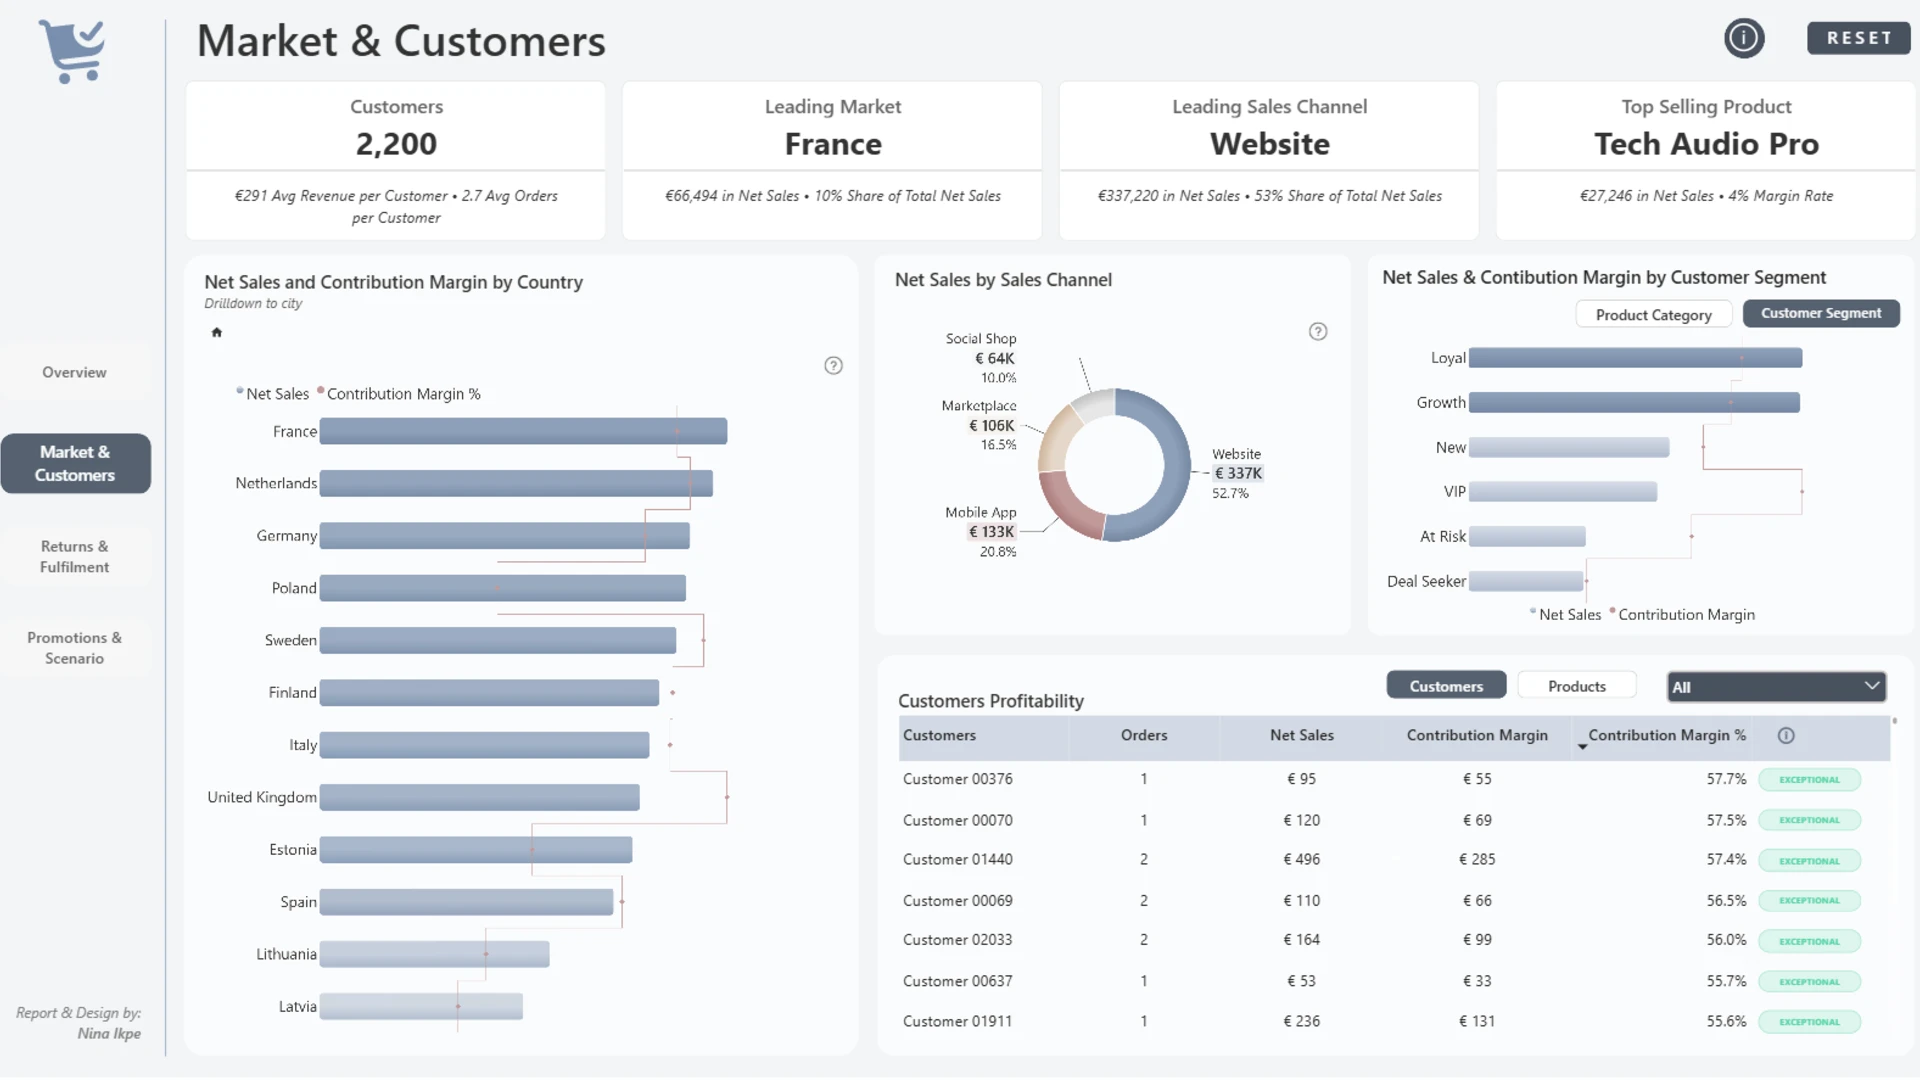
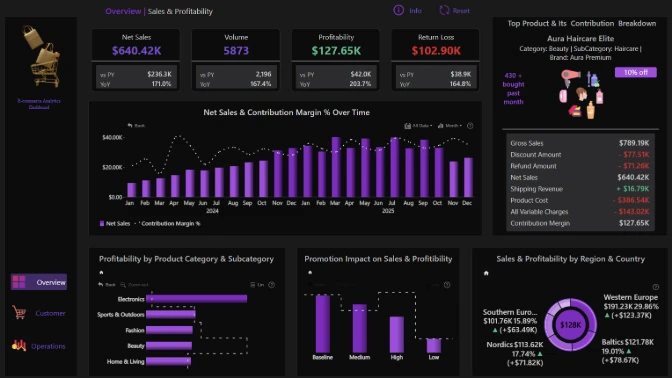
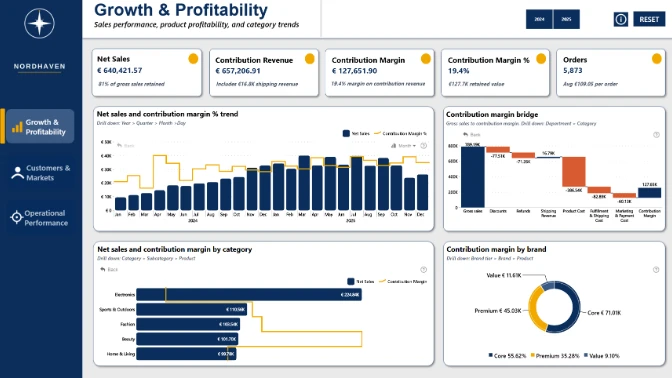
More sales do not always mean more value. An e-commerce business can generate strong revenue while quietly giving a lot of that value back through discounts, refunds, returns, fulfillment costs, and missed sales. This report looks beyond the top-line numbers to understand what was sold, what was actually kept, and where profitability is being won or lost. It explores customer and market performance, campaign and discount economics, return and fulfillment patterns, and the categories and products contributing most to the bottom line. But understanding what happened is only part of the story. The final page lets you test different demand, discount, and return-rate assumptions to see how potential changes could affect sales and contribution margin. The goal is to turn the numbers into a clearer picture of where growth creates value and where more sales may not necessarily mean more profit.
ZoomCharts visuals used





4U Report Challenges
Participate in data challenges, build and submit reports to get free template downloads.
Join CommunityMobile view allows you to interact with the report. To Download the template please switch to desktop view.
How to use a PBIX template
Preview the interactive report, download the PBIX file, open it in Power BI Desktop, and replace the same data connection with your own dataset.
Preview and download
Explore the report online and download the PBIX template file.
Open in Power BI Desktop
Open the downloaded PBIX file in Power BI Desktop.
Connect your data
Replace the sample data source with your own dataset.
Refresh and adjust
Refresh the model and update fields or visual were needed.
Save and share
Save your report and publish it for your audience.


