1140
Student Performance Power BI Report 19
Student Performance Power BI Report 19
More Report pages
Report Author: Clayton Ma
1140
Share template with others
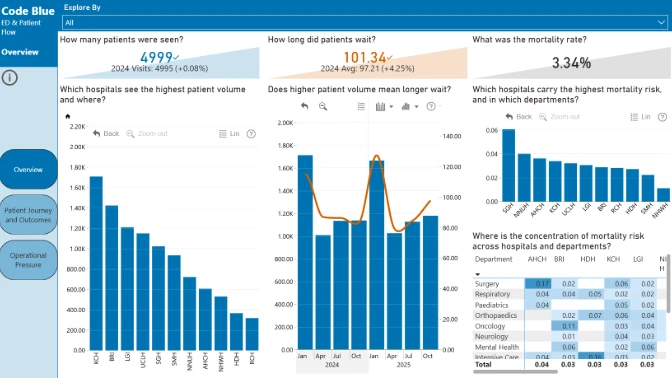
This Power BI report uses the Education/Student Performance dataset and features ZoomCharts Drill Down PRO custom visuals for Power BI. It was submitted to the FP20 Analytics ZoomCharts Data Challenge 31 in October 2025.
Author Description:
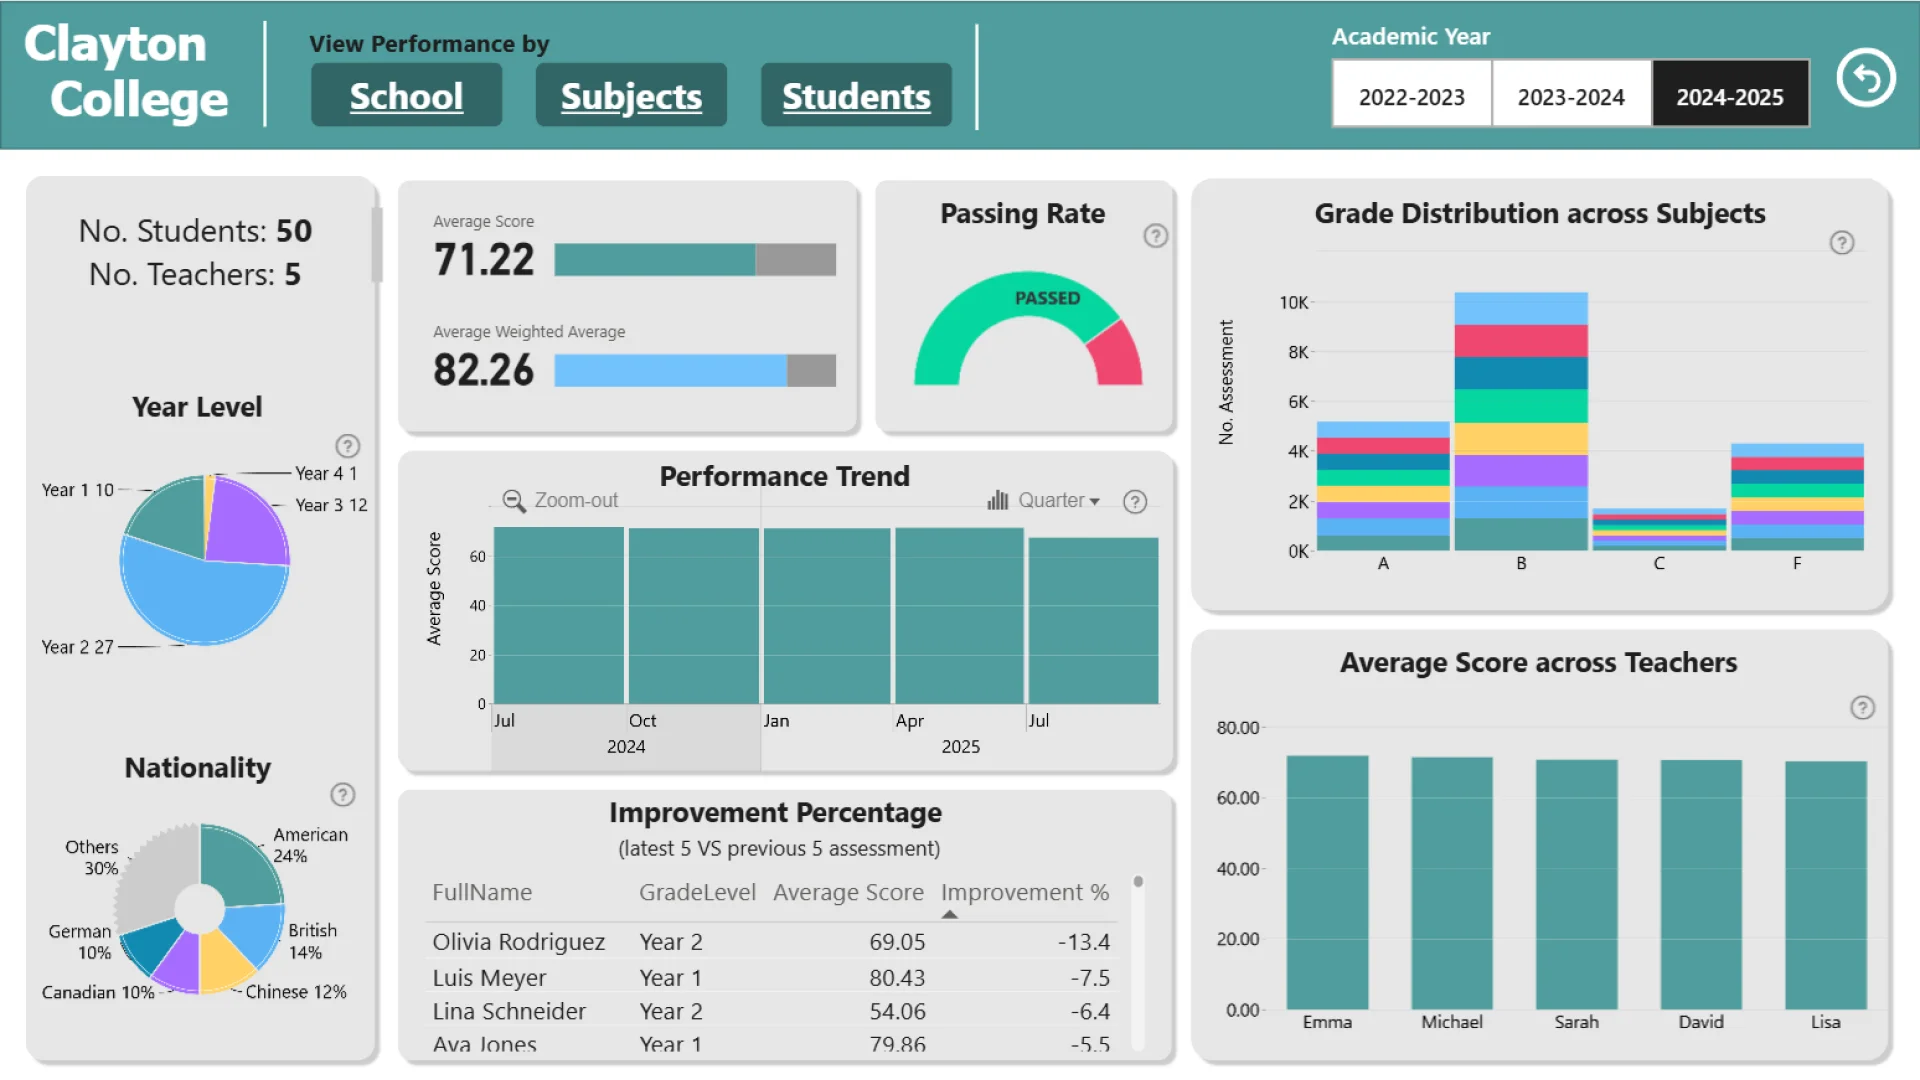
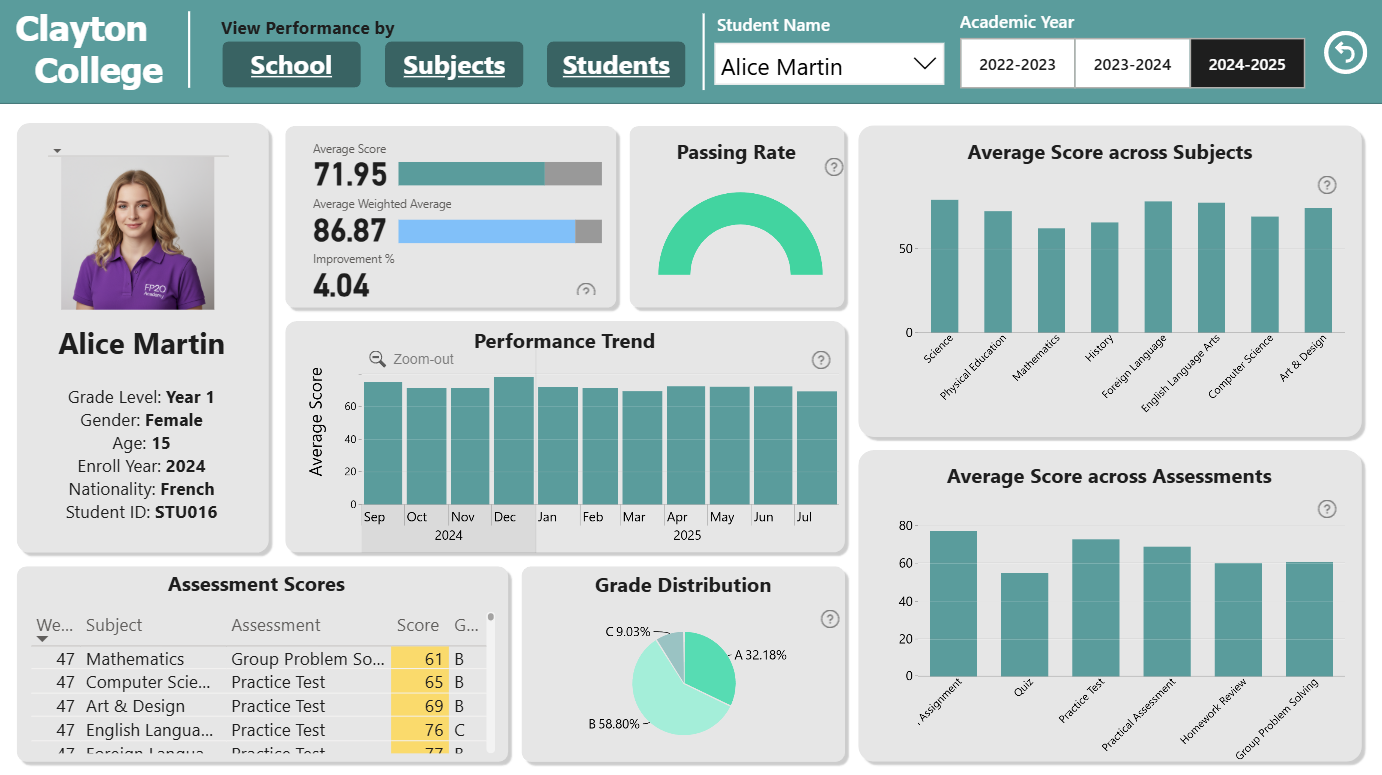
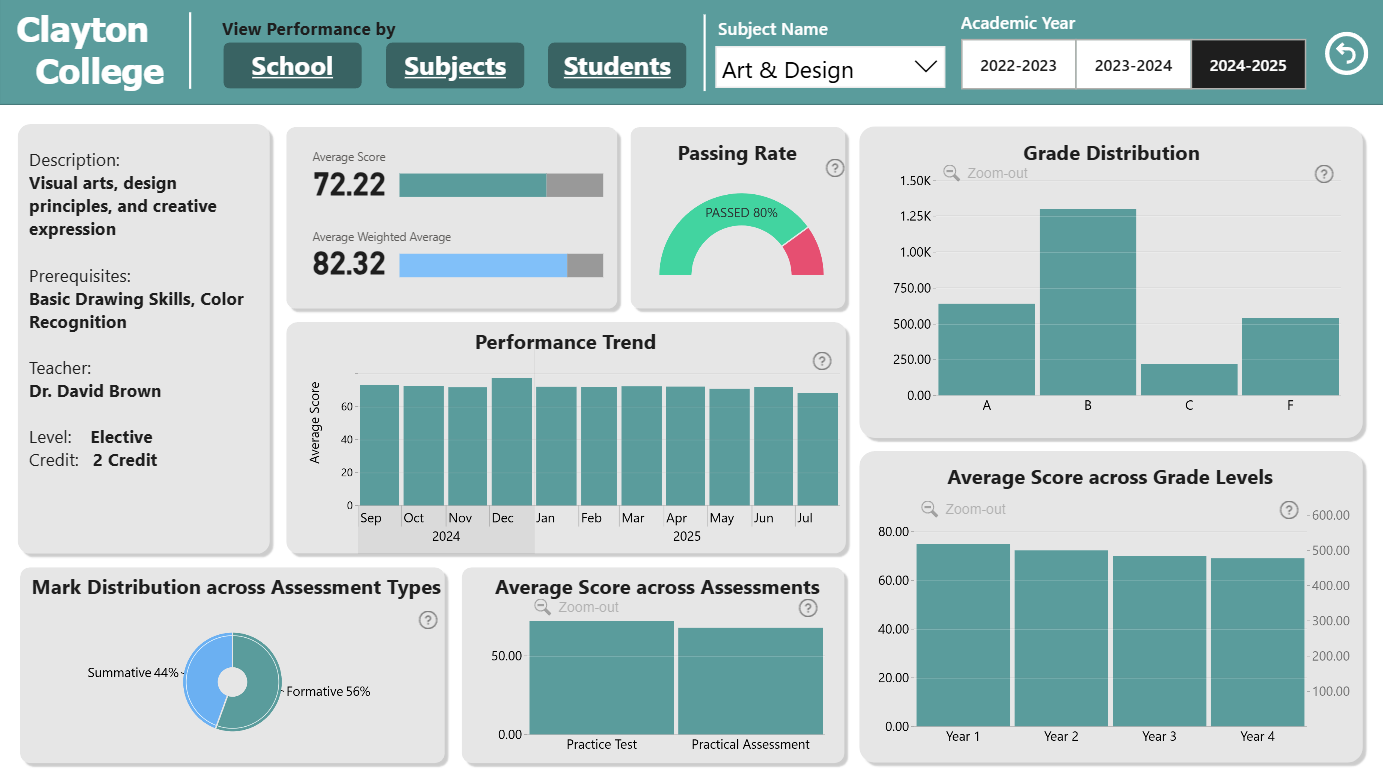
This dashboard provides a comprehensive overview of academic performance across the school through three key pages: By Whole School, By Subject, and By Students. The Whole School view summarizes overall trends such as pass rates, average scores, and improvement percentages, helping leaders identify progress and areas for support. The Subject view compares class averages and tracks performance across subjects to highlight strengths and gaps. The Students view focuses on individual progress using an Improvement % metric that compares each student’s latest five assessments with previous results, helping identify those who may need additional attention.
ZoomCharts visuals used
4U Report Challenges
Participate in data challenges, build and submit reports to get free template downloads.
Join CommunityMobile view allows you to interact with the report. To Download the template please switch to desktop view.

Was this helpful? Thank you for your feedback!
Sorry about that.
How can we improve it?