logo
For Power BI
  • Products
    • Drill Down Donut Pro Drill Down Donut PRO
    • Drill Down Pie Pro Drill Down Pie PRO
    • Drill TimeSeries Pro Drill Down TimeSeries PRO
    • Drill Combo Pro Drill Down Combo PRO
    • Drill Map Pro Drill Down Map PRO
    • Drill Scatter Pro Drill Down Scatter PRO
    • Drill Down Network Pro Drill Down Network PRO
    • Drill Down Waterfall Pro Drill Down Waterfall PRO
    • Drill Down Graph Pro Drill Down Graph PRO
    • Drill Down Timeline Pro Drill Down Timeline PRO
    • Drill Down Combo Bar PRO Drill Down Combo Bar PRO

    Video tutorials

    Watch Now

    More than 90 videos on how to enhance Power BI with ZoomCharts

    Learn more
    All visuals
  • Resources

      Resources

    • Documentation
    • Report Examples
    • Blog
    • Webinars
    • Video Tutorials
    • Visuals Gallery

    Support

    • ZoomCharts Assistance
    • Contact Sales
    • Contact Support
    • FAQ

    Challenges

    Challenges

    Improve your report creation skills by participating in free challenges for report creators.

    Learn more
    Start trial
  • Services
    • Power BI Report Development
    • Custom Visual Development
  • Challenges
  • Pricing
Request a quote Start Free Book a Demo Sign in
Get it now
Go back

Contents

Contest logo
Contest logo

Participate in challenges

Win prizes, build a professional portfolio, and become a star!

Register
Go back

Onyx Data May 2024 Challenge

Report Author: Iris Mejuto Crego

70370

Power BI Service Desk Dashboard by Iris Mejuto Crego

Report
Report Interact

Combo Combo Bar Timeline Map Donut KPI

Share template with others

Summary

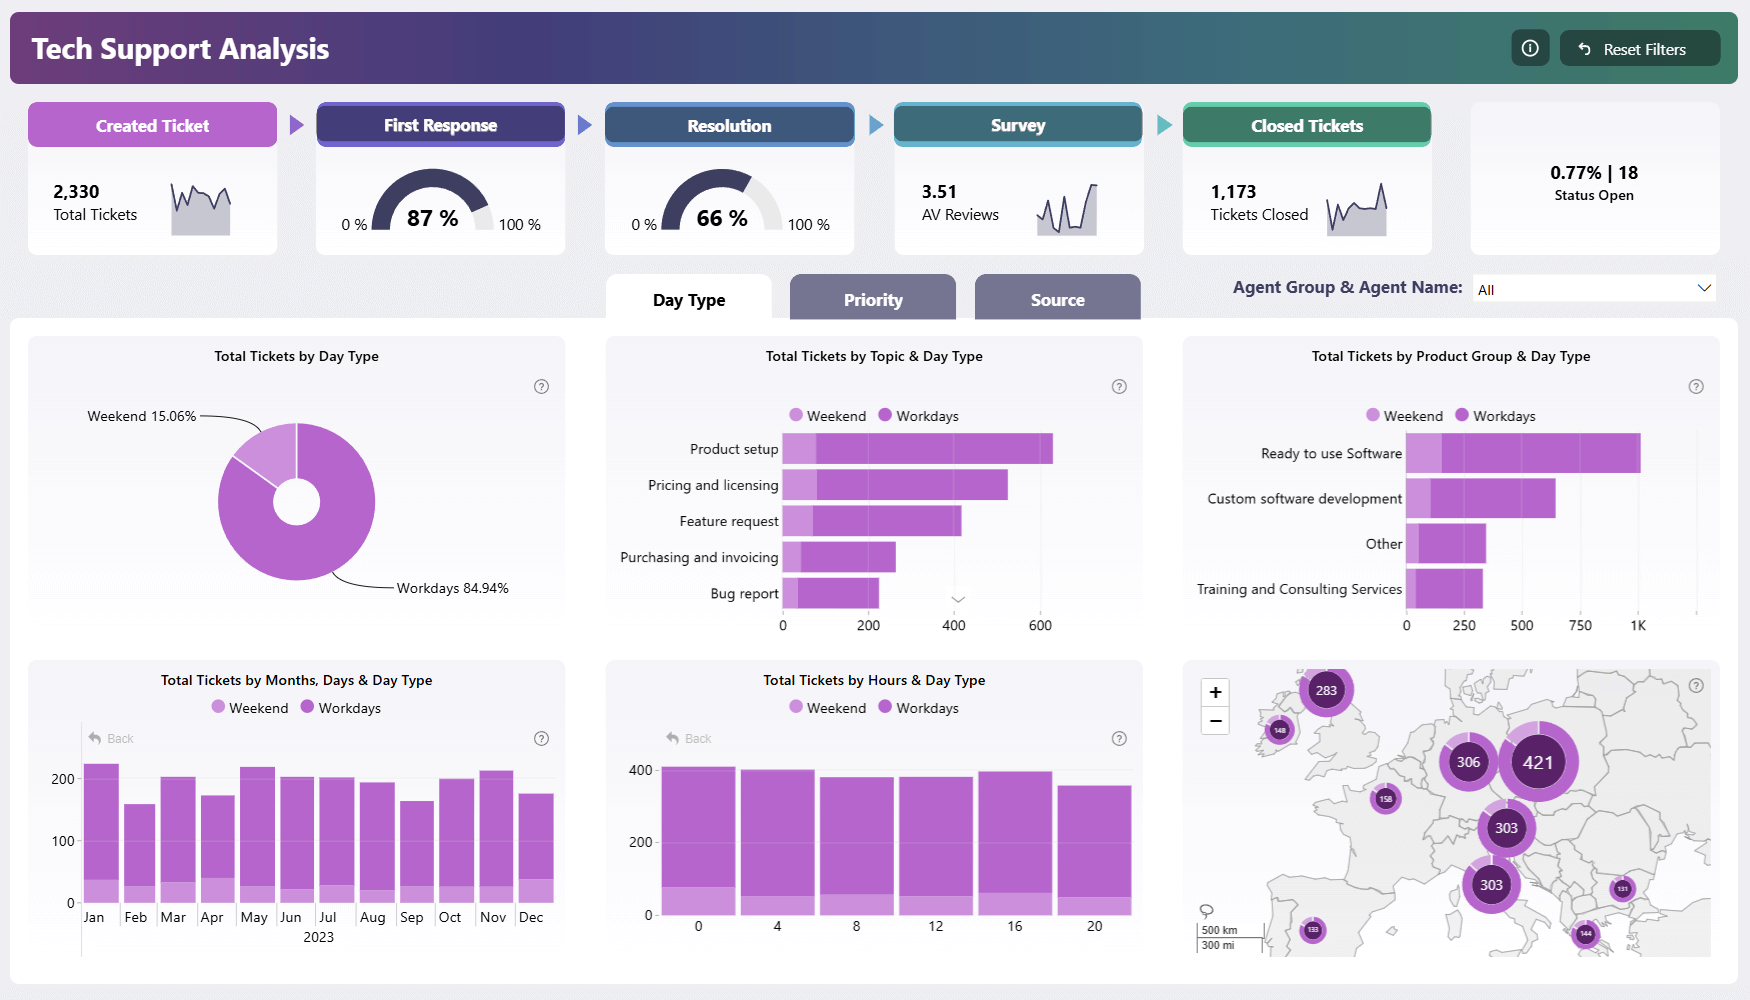
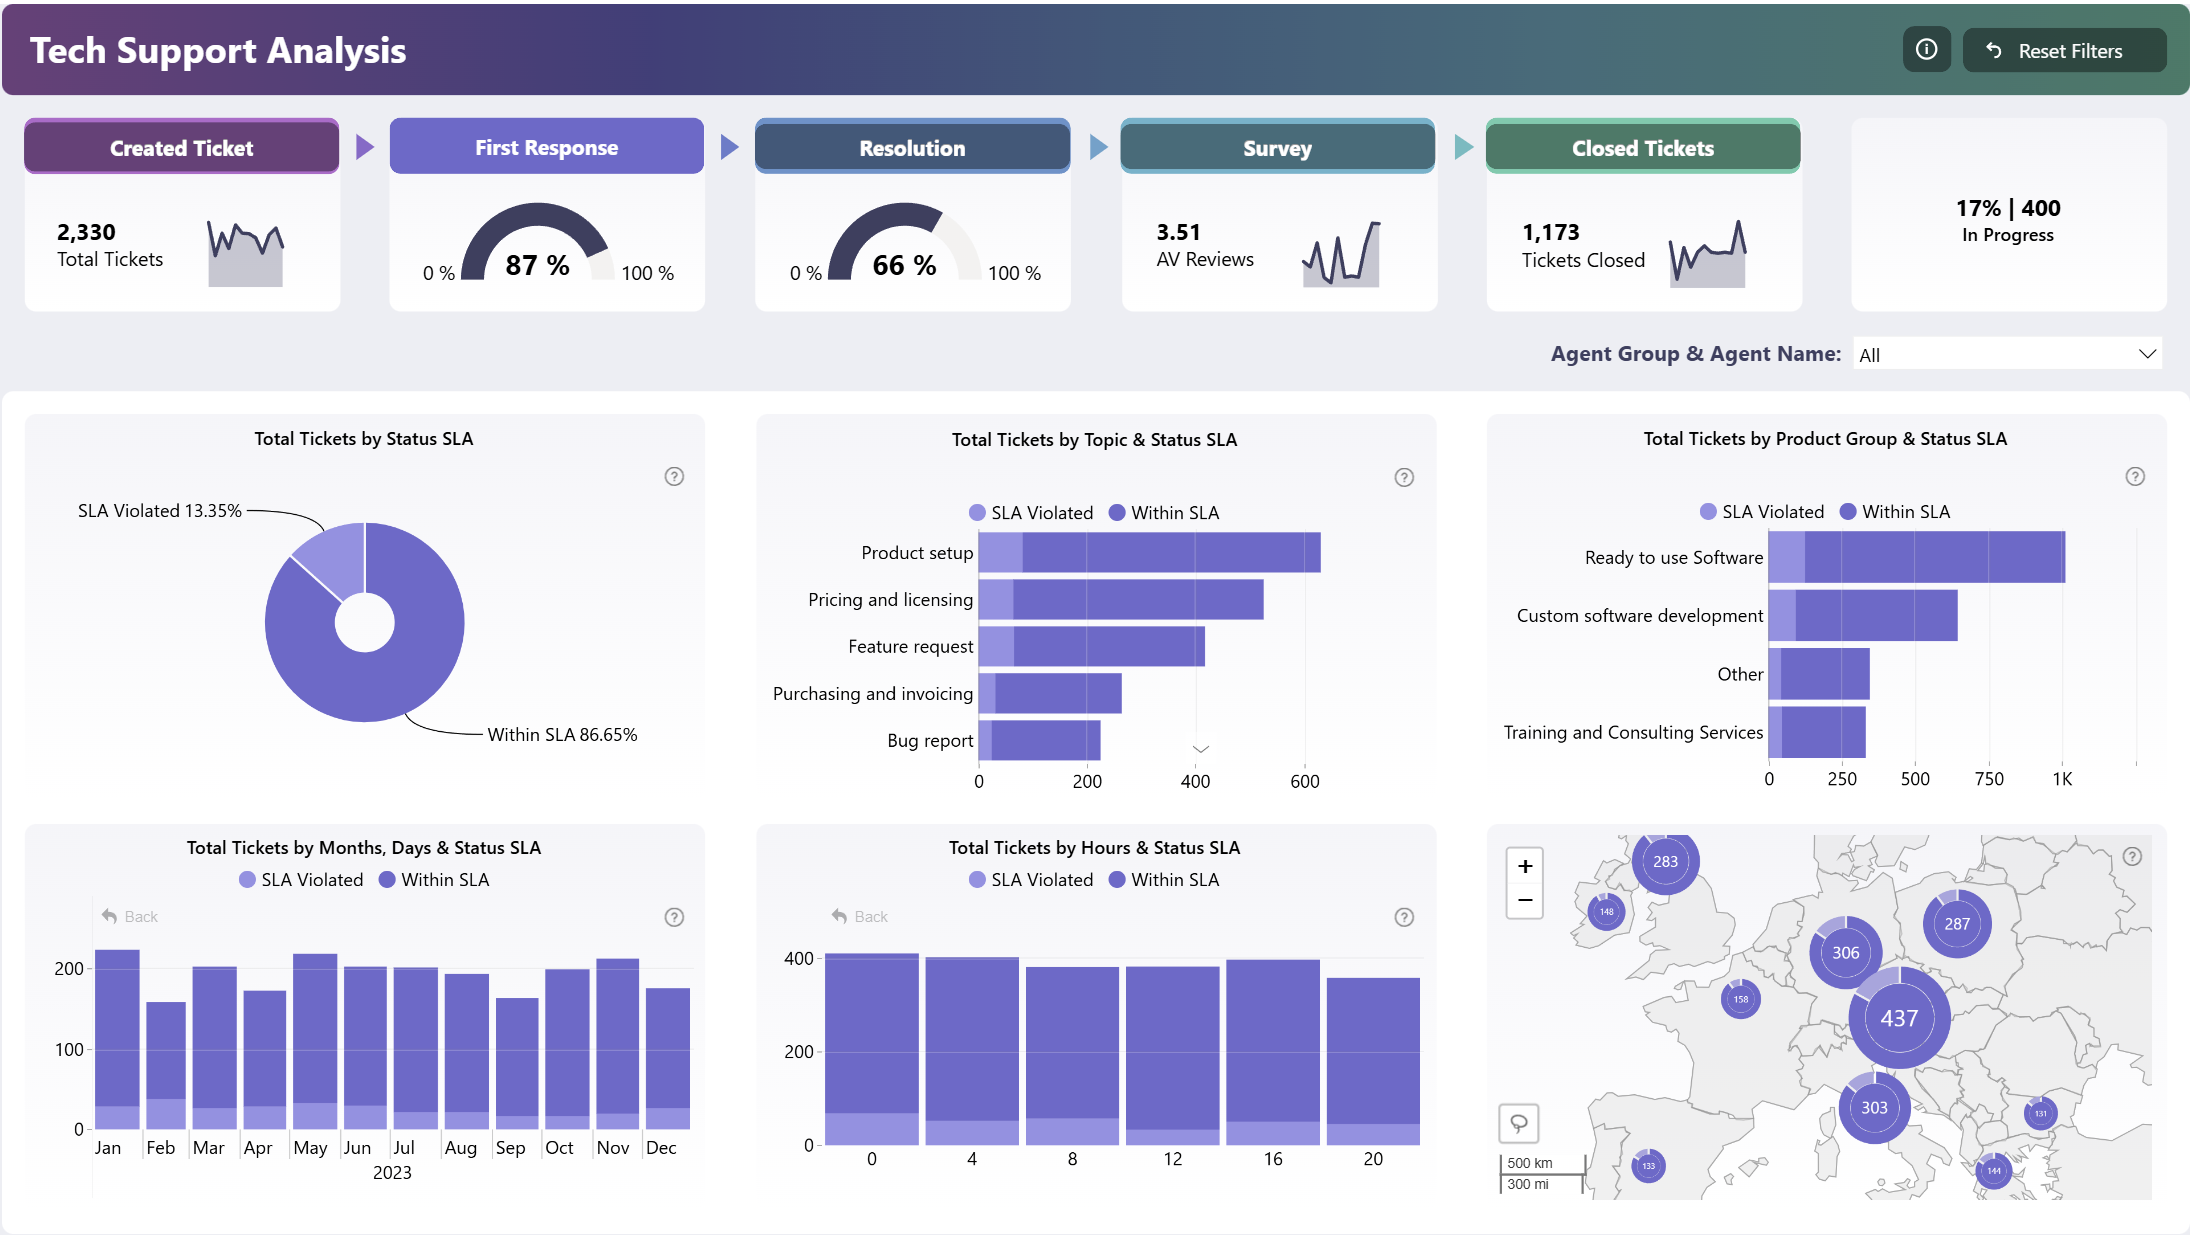
This Power BI service desk dashboard is the winning entry for ZoomCharts Mini Challenge which was hosted as a part of the Onyx Data May 2024 Challenge. This report is designed to analyze the daily operations of a tech support helpdesk and track KPIs.

Key Metrics of This Report

This Power BI service dashboard provides insights about various performance metrics, including:

  • Trends in ticket volume
  • First response speed vs. SLA rate
  • Ticket resolution speed vs. SLA rate
  • Peak times and locations
  • Customer satisfaction rate.

You can filter data to a specific helpdesk agent with a handy slicer, or select specific ticket topics, time periods or locations directly on the ZoomCharts visuals to cross-filter the entire report.

This Power BI service desk dashboard is based on the challenge submission with minor refinements by the ZoomCharts team. See the original submission here.

How To Use This Report Template

To interact with this Power BI service desk dashboard, simply click any active elements directly on the charts. 
Download this report to see all the settings, formulas, and calculations. Try it out with your own data by making a few adjustments.

ZoomCharts visuals used

Drill Down Donut PRO (Pin) Drill Down Donut PRO (Pin)
Drill Down Combo PRO Drill Down Combo PRO
Drill Down Combo Bar PRO Drill Down Combo Bar PRO
Drill Down Map PRO Drill Down Map PRO
Drill Down Timeline PRO Drill Down Timeline PRO

Need help?

Send your question to ZoomCharts assistant, and we will respond to you as soon as possible.

Contact Us

Mobile view allows you to interact with the report. To Download the template please switch to desktop view.

Report Overhaul

ZoomCharts Academy

Learn ZoomCharts with experts and become certified!

Go to Academy!
Report Overhaul

Try it in your Power BI!

Fill up the form below and download!

If you already have an account Login here

Enjoy!

Success

Thank you for downloading the template!
We have sent a download link to your email.

For any questions, please contact us at ZoomCharts Assistance

Log in

Forgot password

Reset Password

Was this helpful? Thank you for your feedback!

Sorry about that.

How can we improve it?

Power BI Service Desk Dashboard by Iris Mejuto Crego

Share

Close

logo
[email protected]
+44 204 577 3993
logo

Products

Drill Down Network PRO Drill Down Waterfall PRO Drill Down Graph PRO Drill Down Combo PRO Drill Down Combo Bar PRO Drill Down Donut PRO Drill Down Pie PRO Drill Down TimeSeries PRO Drill Down Timeline PRO Drill Down Map PRO Drill Down Scatter PRO All Visuals

Resources

Report Examples Webinars Blog ZoomCharts Academy Visuals Gallery Documentation Custom Visual Development Subscribe to News

Solutions

Custom Visual Development

Company

Pricing About Us Partners Leave feedback Join PowerGroup EU Funding

Help

ZoomCharts Assistance Contact Sales Contact Support FAQ

Drill Down Network PRO Drill Down Waterfall PRO Drill Down Graph PRO Drill Down Combo PRO Drill Down Combo Bar PRO Drill Down Donut PRO Drill Down Pie PRO Drill Down TimeSeries PRO Drill Down Timeline PRO Drill Down Map PRO Drill Down Scatter PRO All Visuals

Report Examples Webinars Blog ZoomCharts Academy Visuals Gallery Documentation Custom Visual Development Subscribe to News

Custom Visual Development

Pricing About Us Partners Leave feedback Join PowerGroup EU Funding

ZoomCharts Assistance Contact Sales Contact Support FAQ
+44 204 577 3993
[email protected]

Ready to get in touch?

Contact our experts with any question about Power BI and ZoomCharts for Free!

Contact us

© 2025, Data Visualization Software Lab

U.S. Patents No. 11,645,343; 11,921,804

Cookies Policy
Manage cookies
Privacy Policy
Global
EULA
Patent
warning

Error message

success

Success info: Done!

ZoomCharts AI Assistant

We noticed you're using an old OS version.

For the best experience, we recommend upgrading to ensure that all website features display correctly.

Cookie settings

We use necessary cookies for site functionality, as well as statistic, marketing, and preference cookies to enhance your experience. For more information and to manage your preferences, please visit our Cookie policy