1349
Student Performance Power BI Report 18
Student Performance Power BI Report 18
More Report pages
Report Author: Mariam Afzal Ali
1349
Share template with others
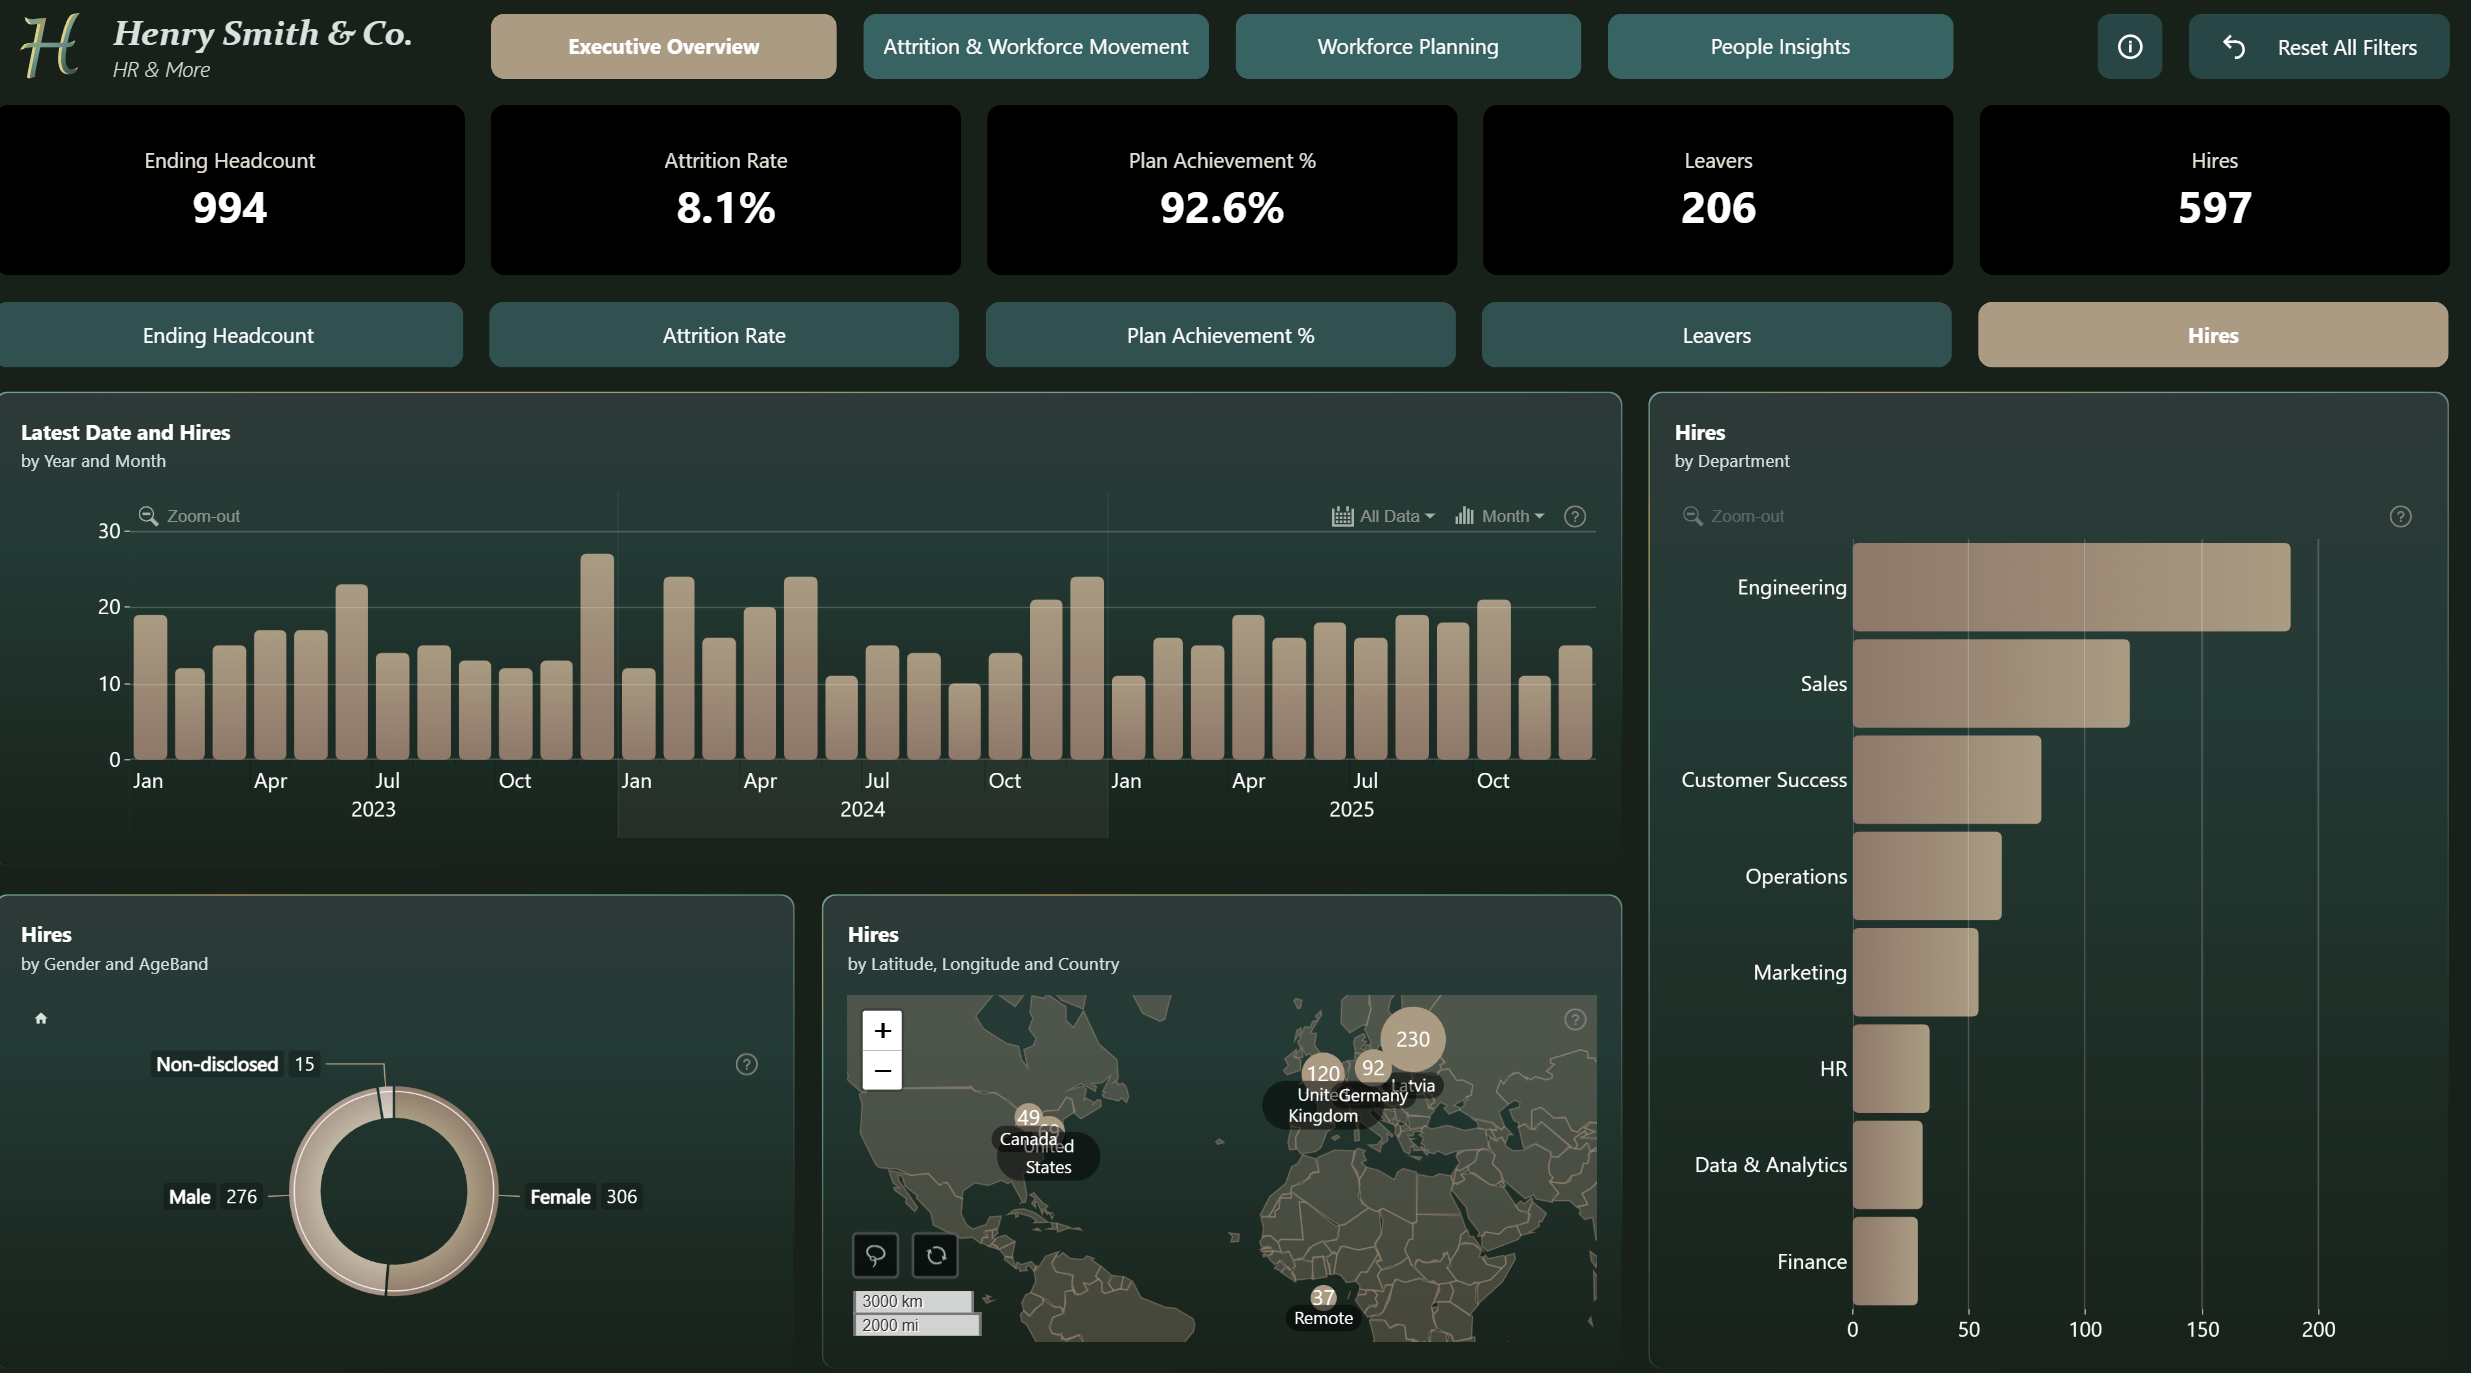
This Power BI report uses the Education/Student Performance dataset and features ZoomCharts Drill Down PRO custom visuals for Power BI. It was submitted to the FP20 Analytics ZoomCharts Data Challenge 31 in October 2025.
Author Description:
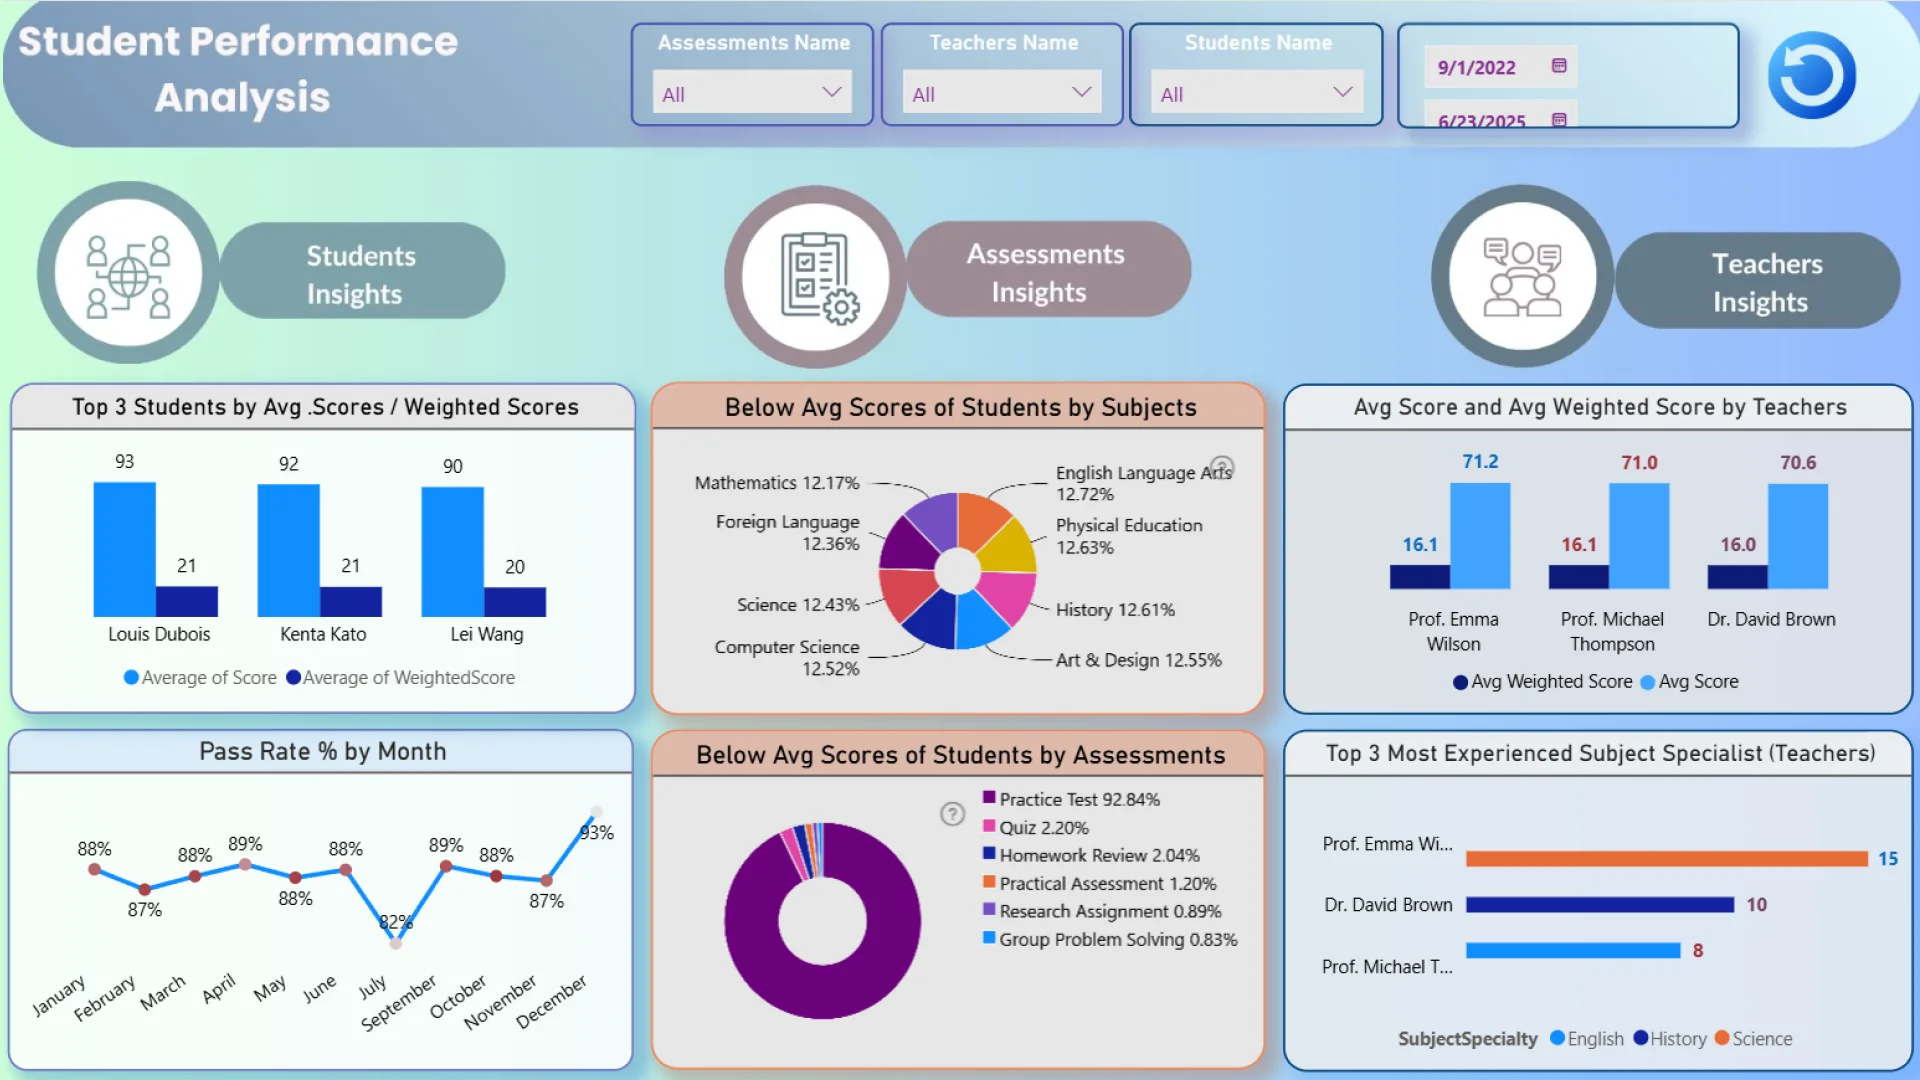
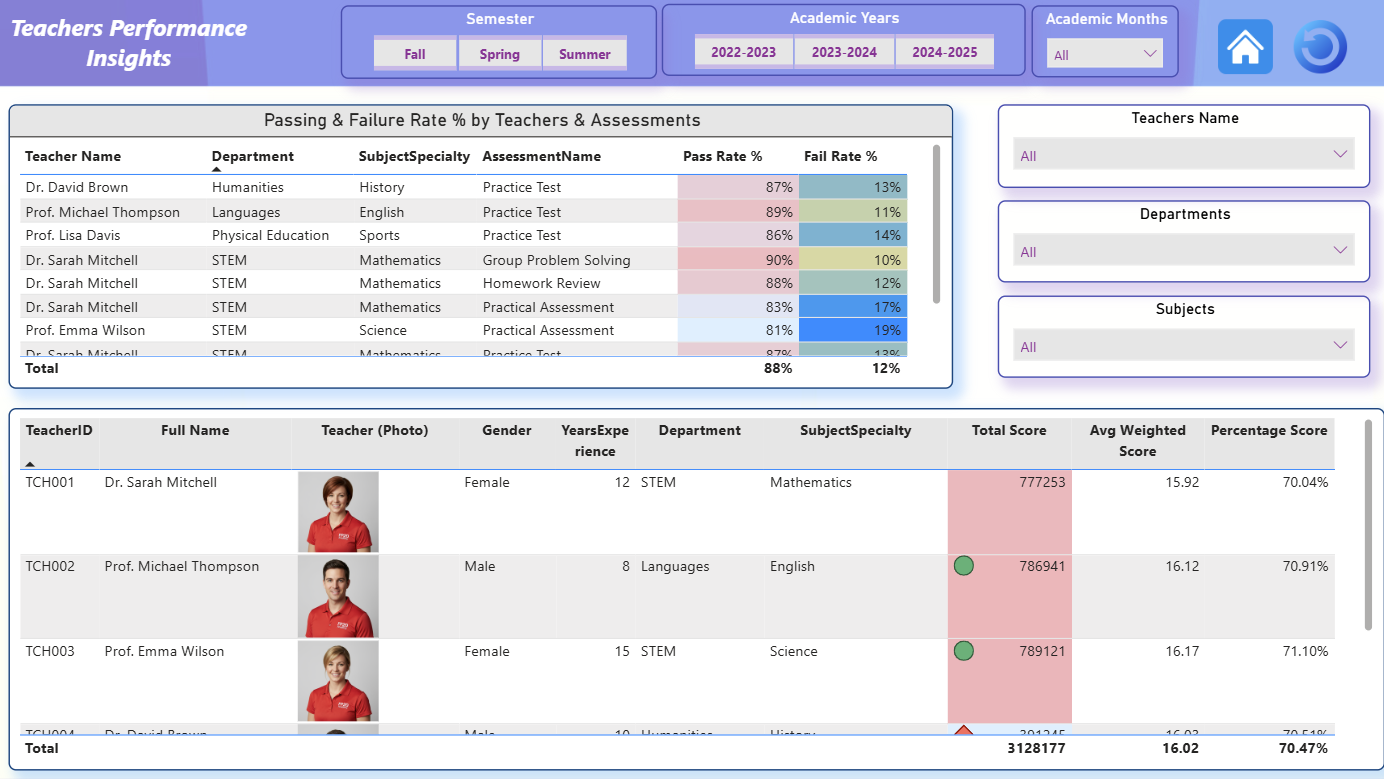
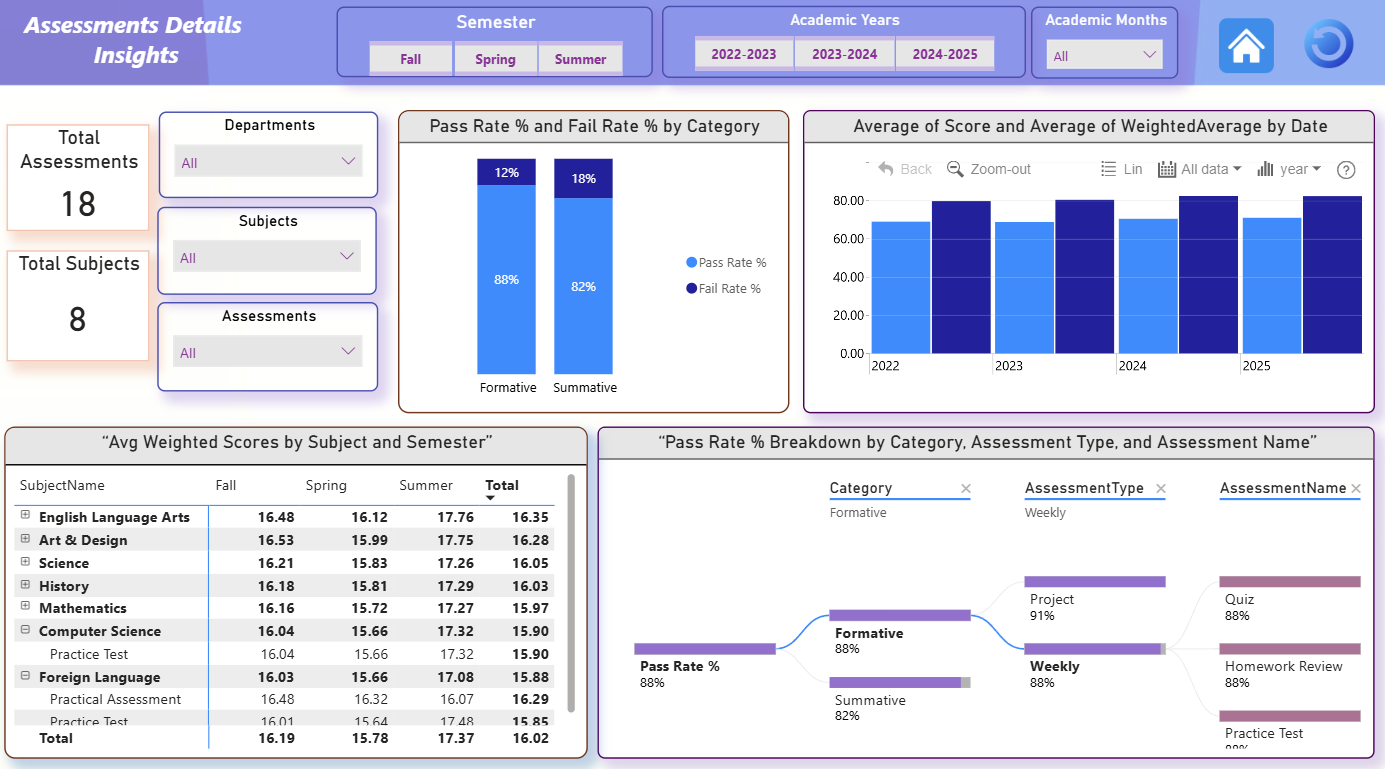
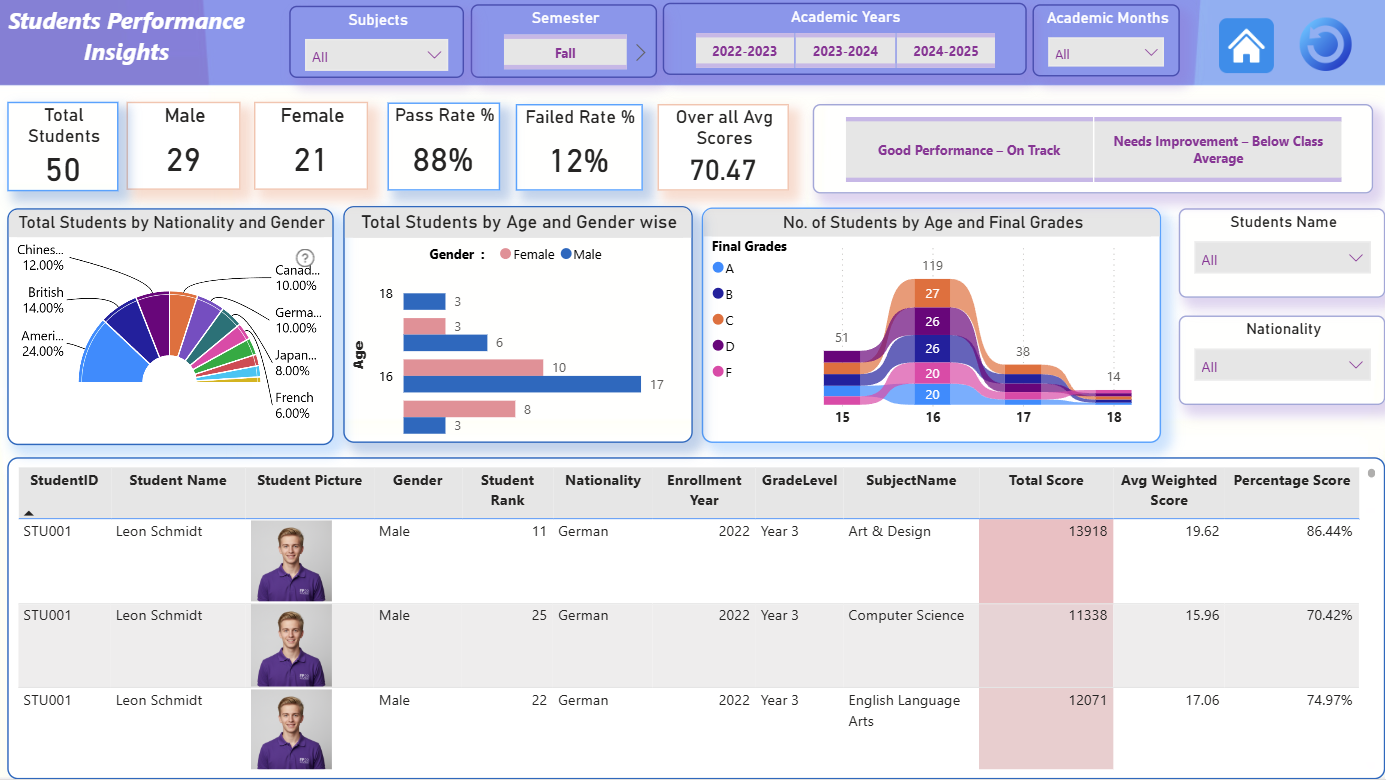
An interactive Power BI dashboard to analyze and visualize students’ academic performance across multiple subjects, assessments, and academic years (2022–2025). This project provides data-driven insights into student achievement, teacher effectiveness, and assessment outcomes — helping educators make informed decisions to improve learning outcomes.
4U Report Challenges
Participate in data challenges, build and submit reports to get free template downloads.
Join CommunityMobile view allows you to interact with the report. To Download the template please switch to desktop view.

Was this helpful? Thank you for your feedback!
Sorry about that.
How can we improve it?