73893
Power BI Banking Dashboard by Okeh Dono Efasa
Power BI Banking Dashboard by Okeh Dono Efasa
More Report pages
Overhauled by ZoomCharts
73893
Share template with others
Power BI Banking Dashboard
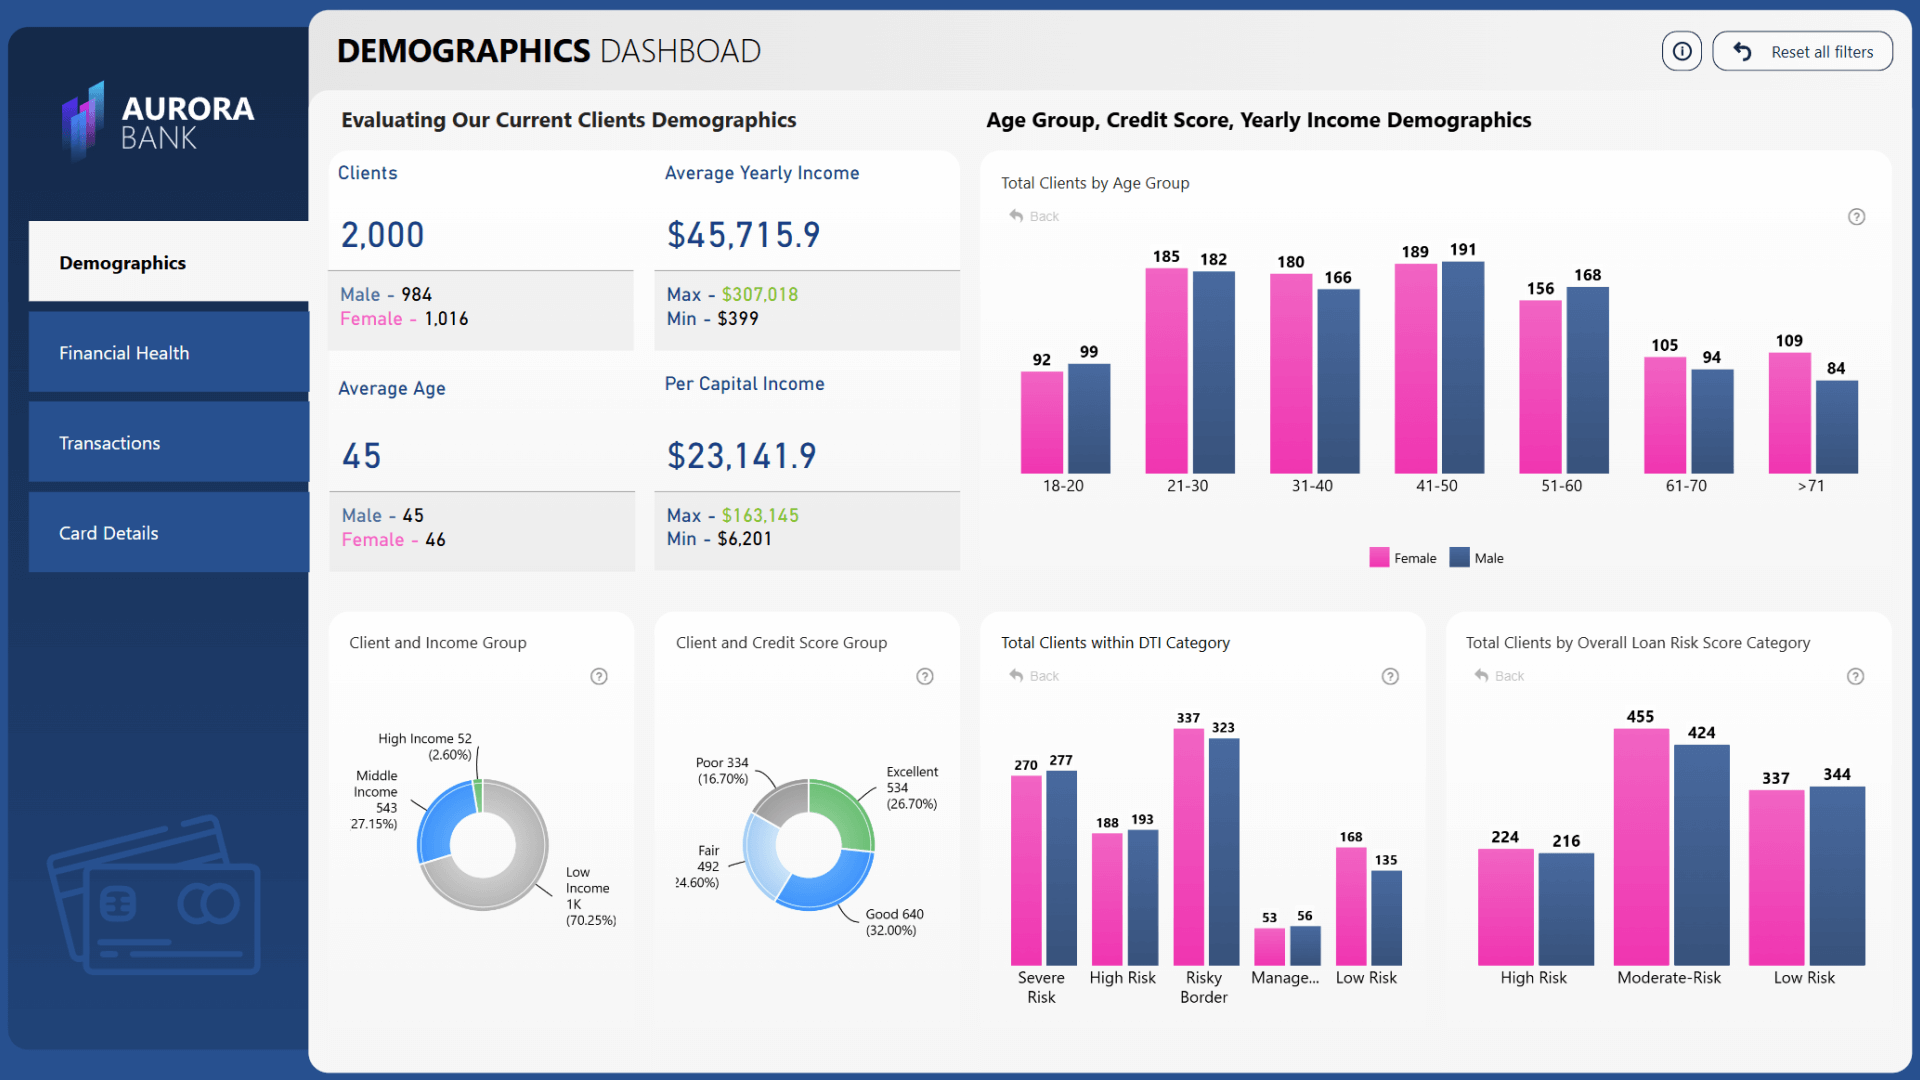
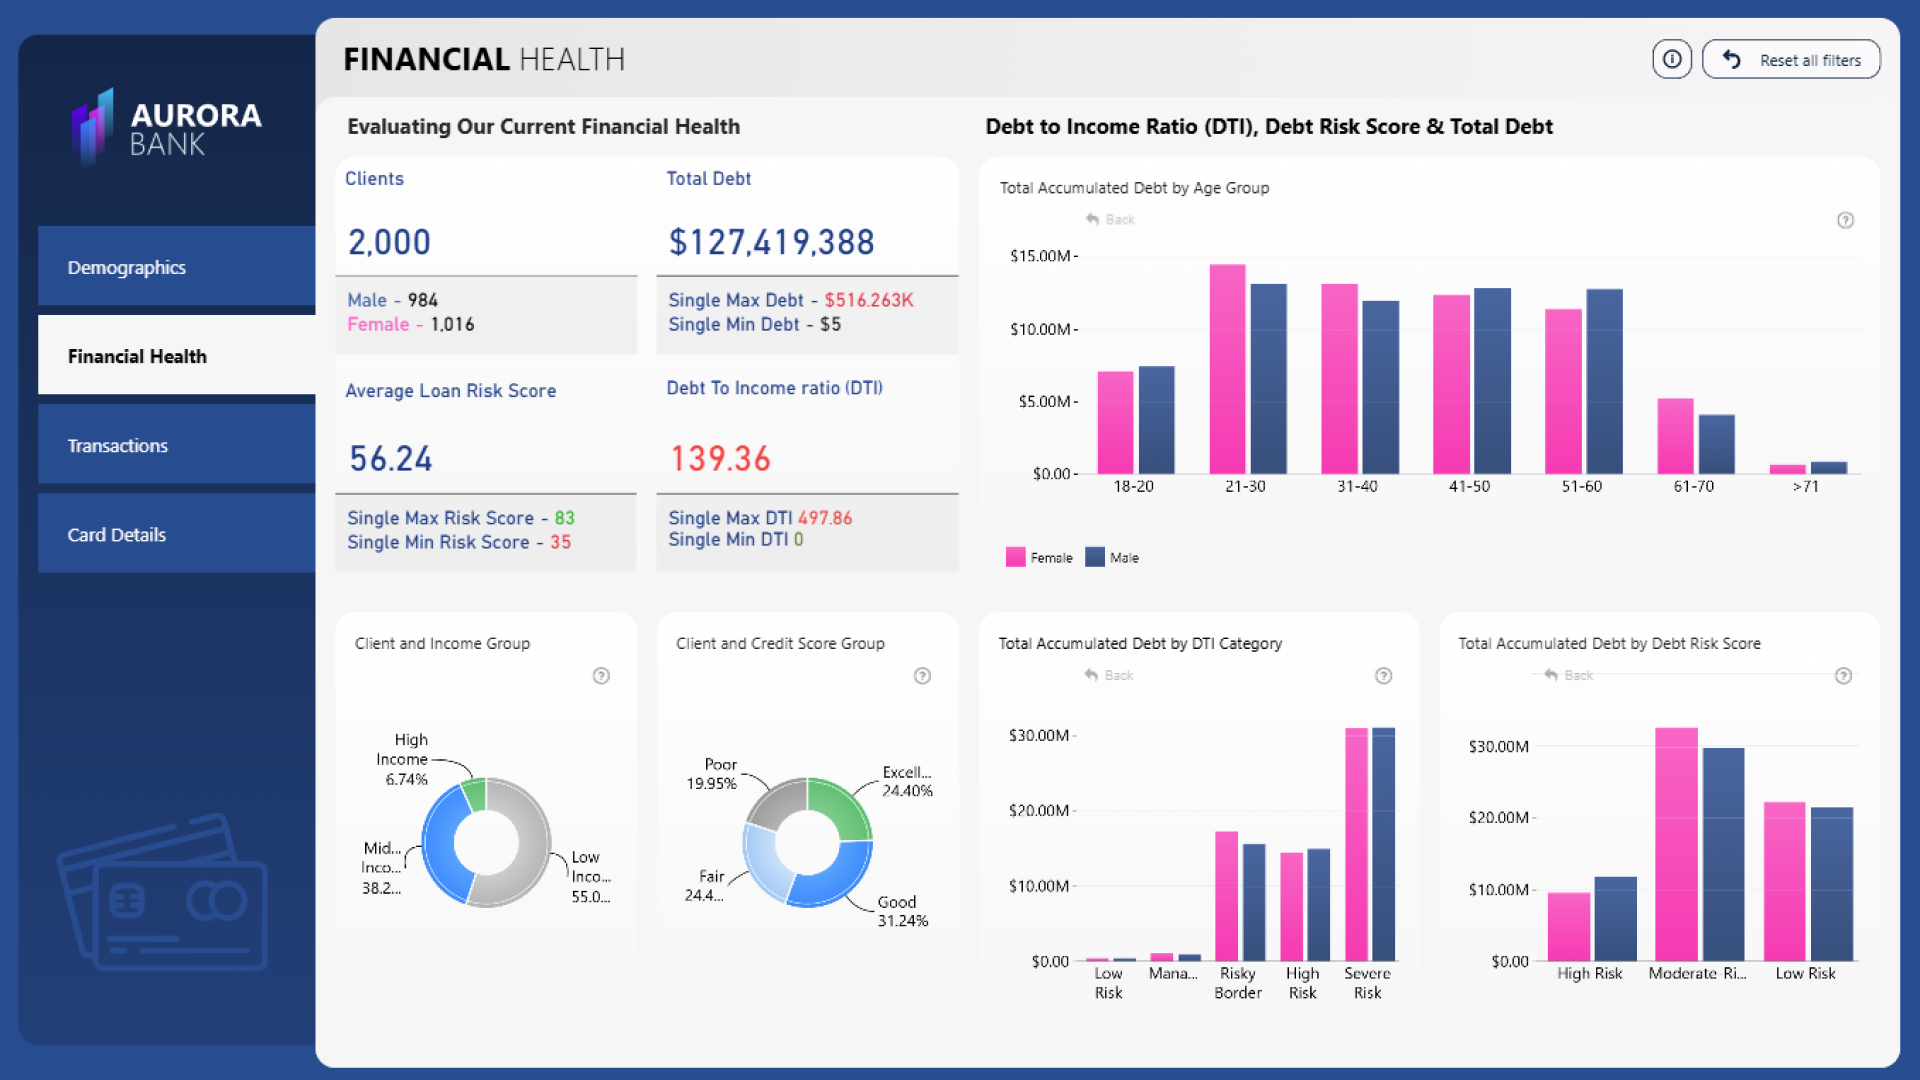
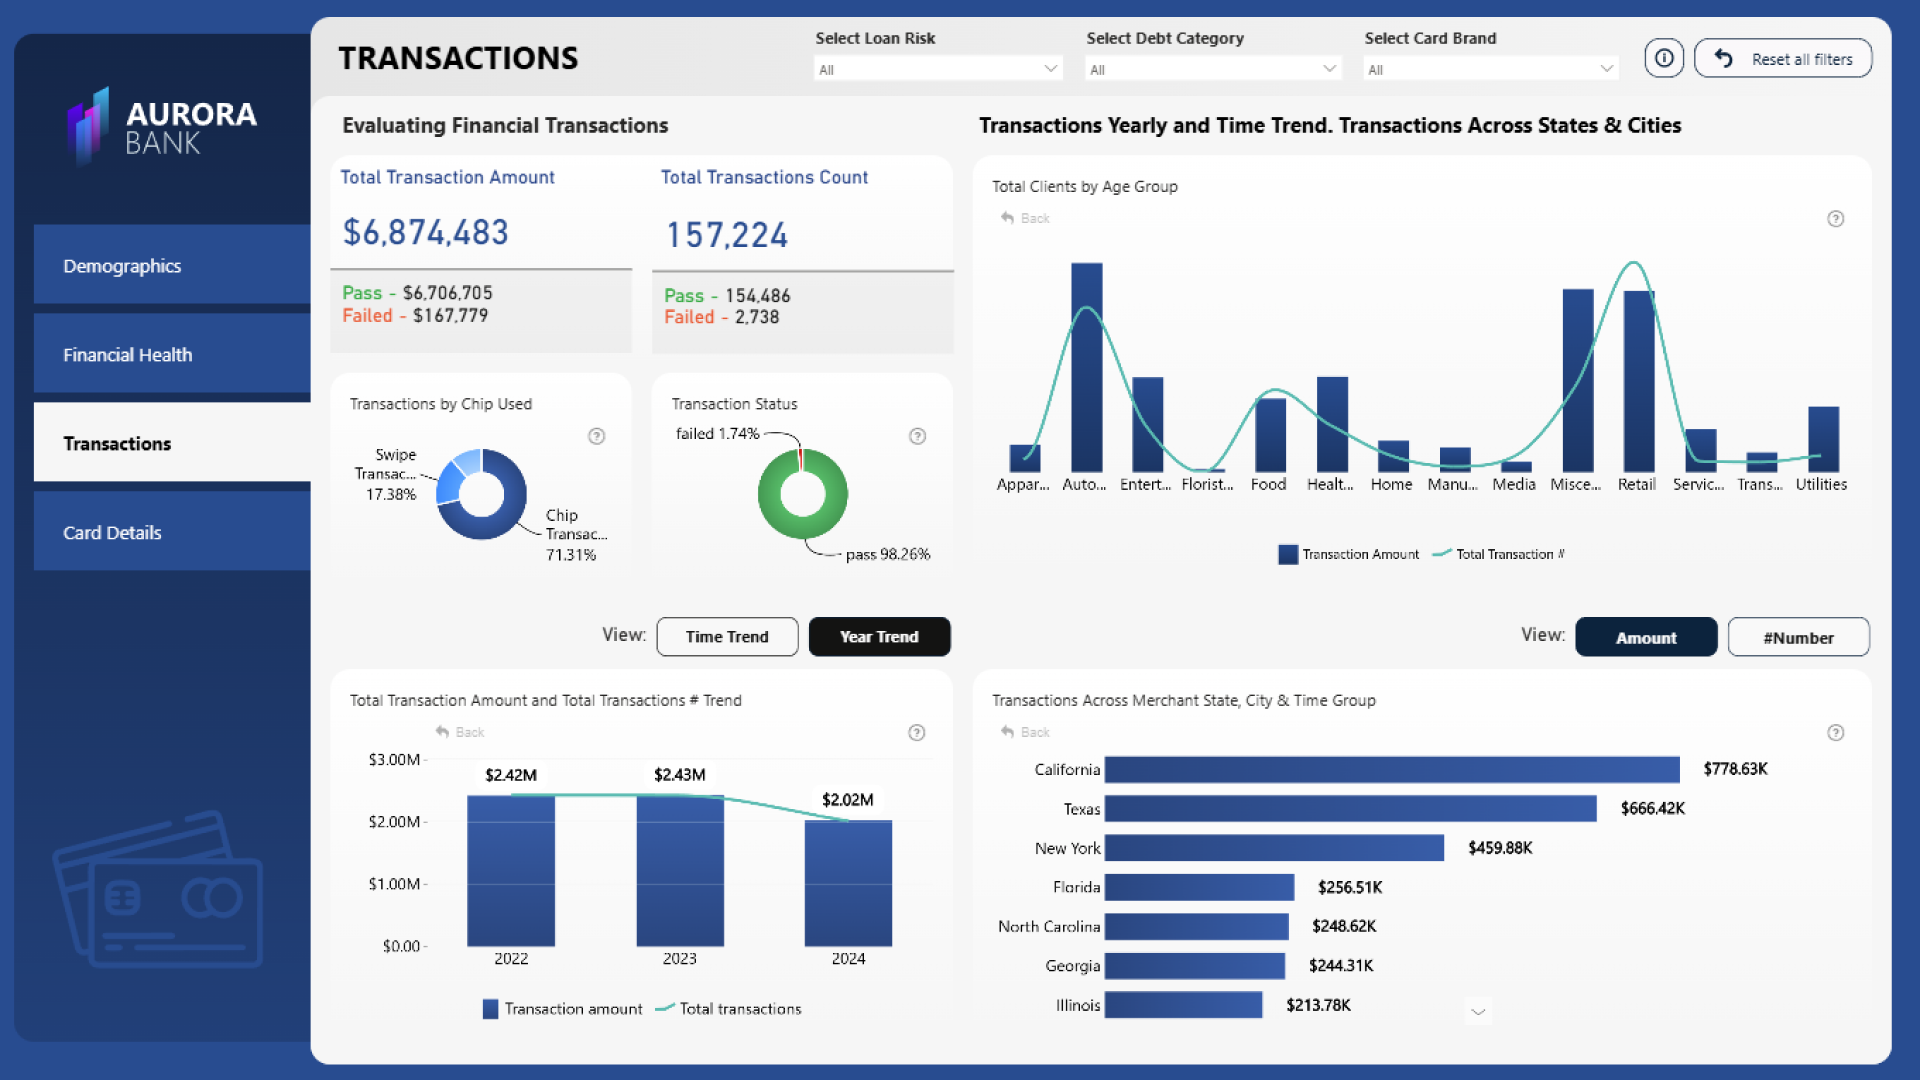
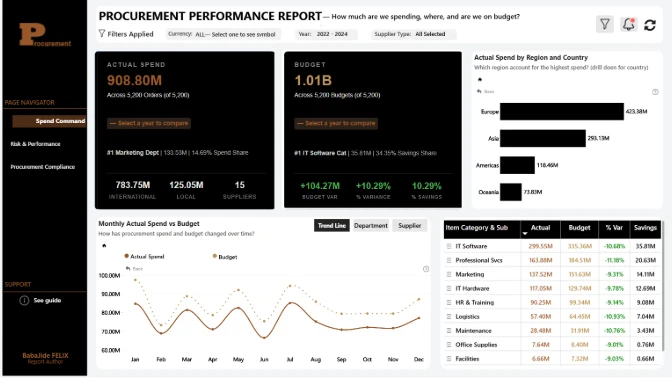
This Power BI banking dashboard can be used by banks or other financial institutions to analyze their clients across various dimensions, including demographics, income groups, financial health and transactions. It combines interactive navigation with a slick and easy-to-read design that’s easily adaptable for your bank’s branding guidelines.
This report is the winning entry for the ZoomCharts Mini Challenge as part of the Onyx Data December 2024 Challenge.
Key Metrics of This Report
This Power BI banking dashboard is designed for KYC analysis, and the interactive, cross-filtering visuals reveal multiple insights, including:
- Client demographics – age, gender, credit score, risk category.
- Overall financial health – debt, loan risk, debt-to-income ratio, etc.
- Transactions – total transactions, spending categories, locations, trends over time.
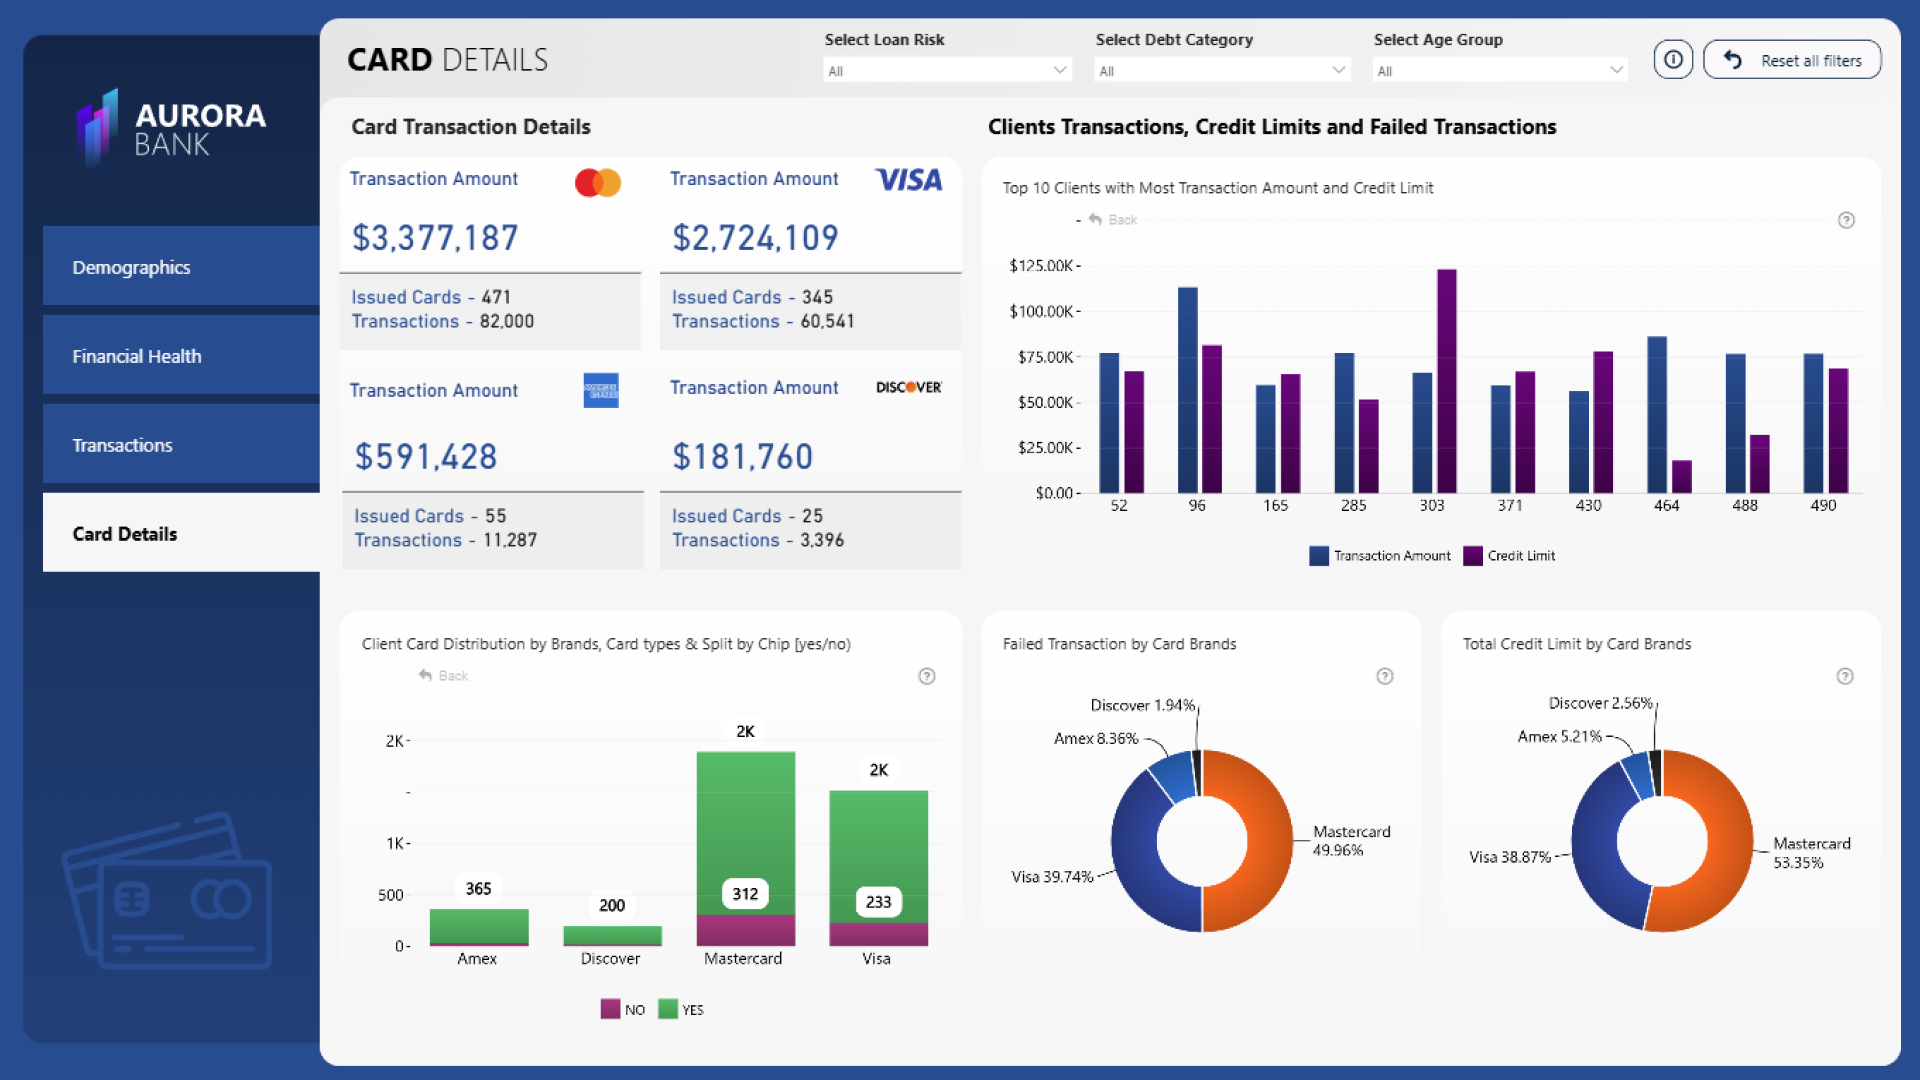
- Other insights – transactions per payment processor, payment method, status.
You can drill down and see more detailed insights directly in charts, and as you explore the report, other visuals will filter data to show relevant information across the entire report.
This Power BI banking dashboard is based on the challenge submission with minor refinements by the ZoomCharts team. See the original submission here.
How To Use This Report Template
To interact with this Power BI service desk dashboard, simply click any active elements directly on the charts.
Download this report to see all the settings, formulas, and calculations. Try it out with your own data by making a few adjustments.
4U Report Challenges
Participate in data challenges, build and submit reports to get free template downloads.
Join CommunityMobile view allows you to interact with the report. To Download the template please switch to desktop view.
Was this helpful? Thank you for your feedback!
Sorry about that.
How can we improve it?