780
Sales Pipeline Performance and Risk Analytics
Sales Pipeline Performance and Risk Analytics
Report Author: Douglas Atuboyedia
780
Share template with others
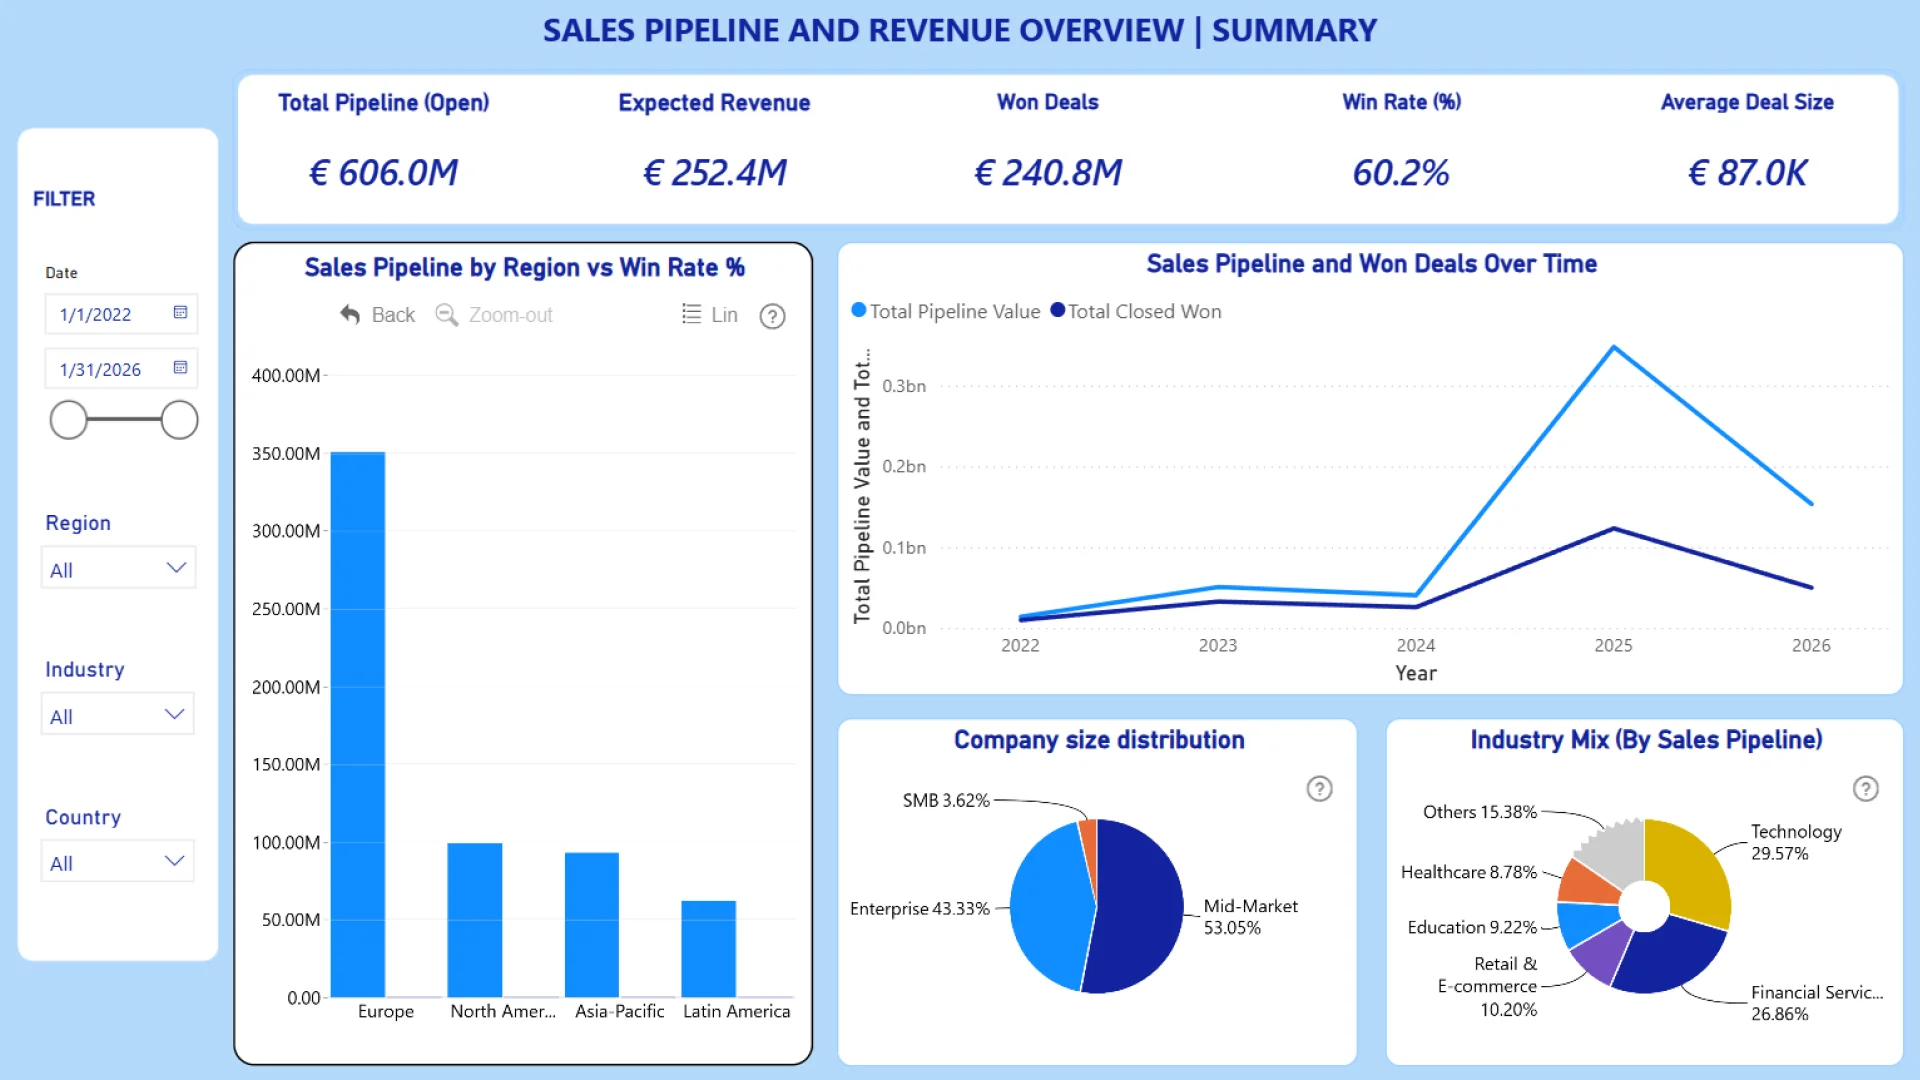
This interactive Power BI report explores the Global B2B Sales Pipeline & Deals Analytics dataset using ZoomCharts Drill Down PRO custom visuals for Power BI. It highlights pipeline value, deal progression, sales activity, and client engagement across regions and industries, helping teams monitor pipeline health and identify stalled or high-risk deals.
The report was submitted to the FP20 Analytics ZoomCharts Data Challenge #35 (February – March 2026).
Author’s Description:
This project focuses on transforming a large, realistic global B2B sales pipeline dataset into a clear and interactive Power BI report that supports effective decision-making. The report is designed for sales managers, account executives, and business leaders to use in their daily operations.
The project integrates data from deals, companies, sales representatives, activities, and dates into a unified analytical model. This enables users to track how deals progress through the pipeline, identify key sources of revenue, and highlight opportunities that require attention.
ZoomCharts visuals used
4U Report Challenges
Participate in data challenges, build and submit reports to get free template downloads.
Join CommunityMobile view allows you to interact with the report. To Download the template please switch to desktop view.

Was this helpful? Thank you for your feedback!
Sorry about that.
How can we improve it?