667
Sales Pipeline & Deals Analytics
Sales Pipeline & Deals Analytics
Report Author: Syed Daniyal Ahmed
667
Share template with others
This interactive Power BI report explores the Global B2B Sales Pipeline & Deals Analytics dataset using ZoomCharts Drill Down PRO custom visuals for Power BI. It highlights pipeline value, deal progression, sales activity, and client engagement across regions and industries, helping teams monitor pipeline health and identify stalled or high-risk deals.
The report was submitted to the FP20 Analytics ZoomCharts Data Challenge #35 (February – March 2026).
Author’s Description
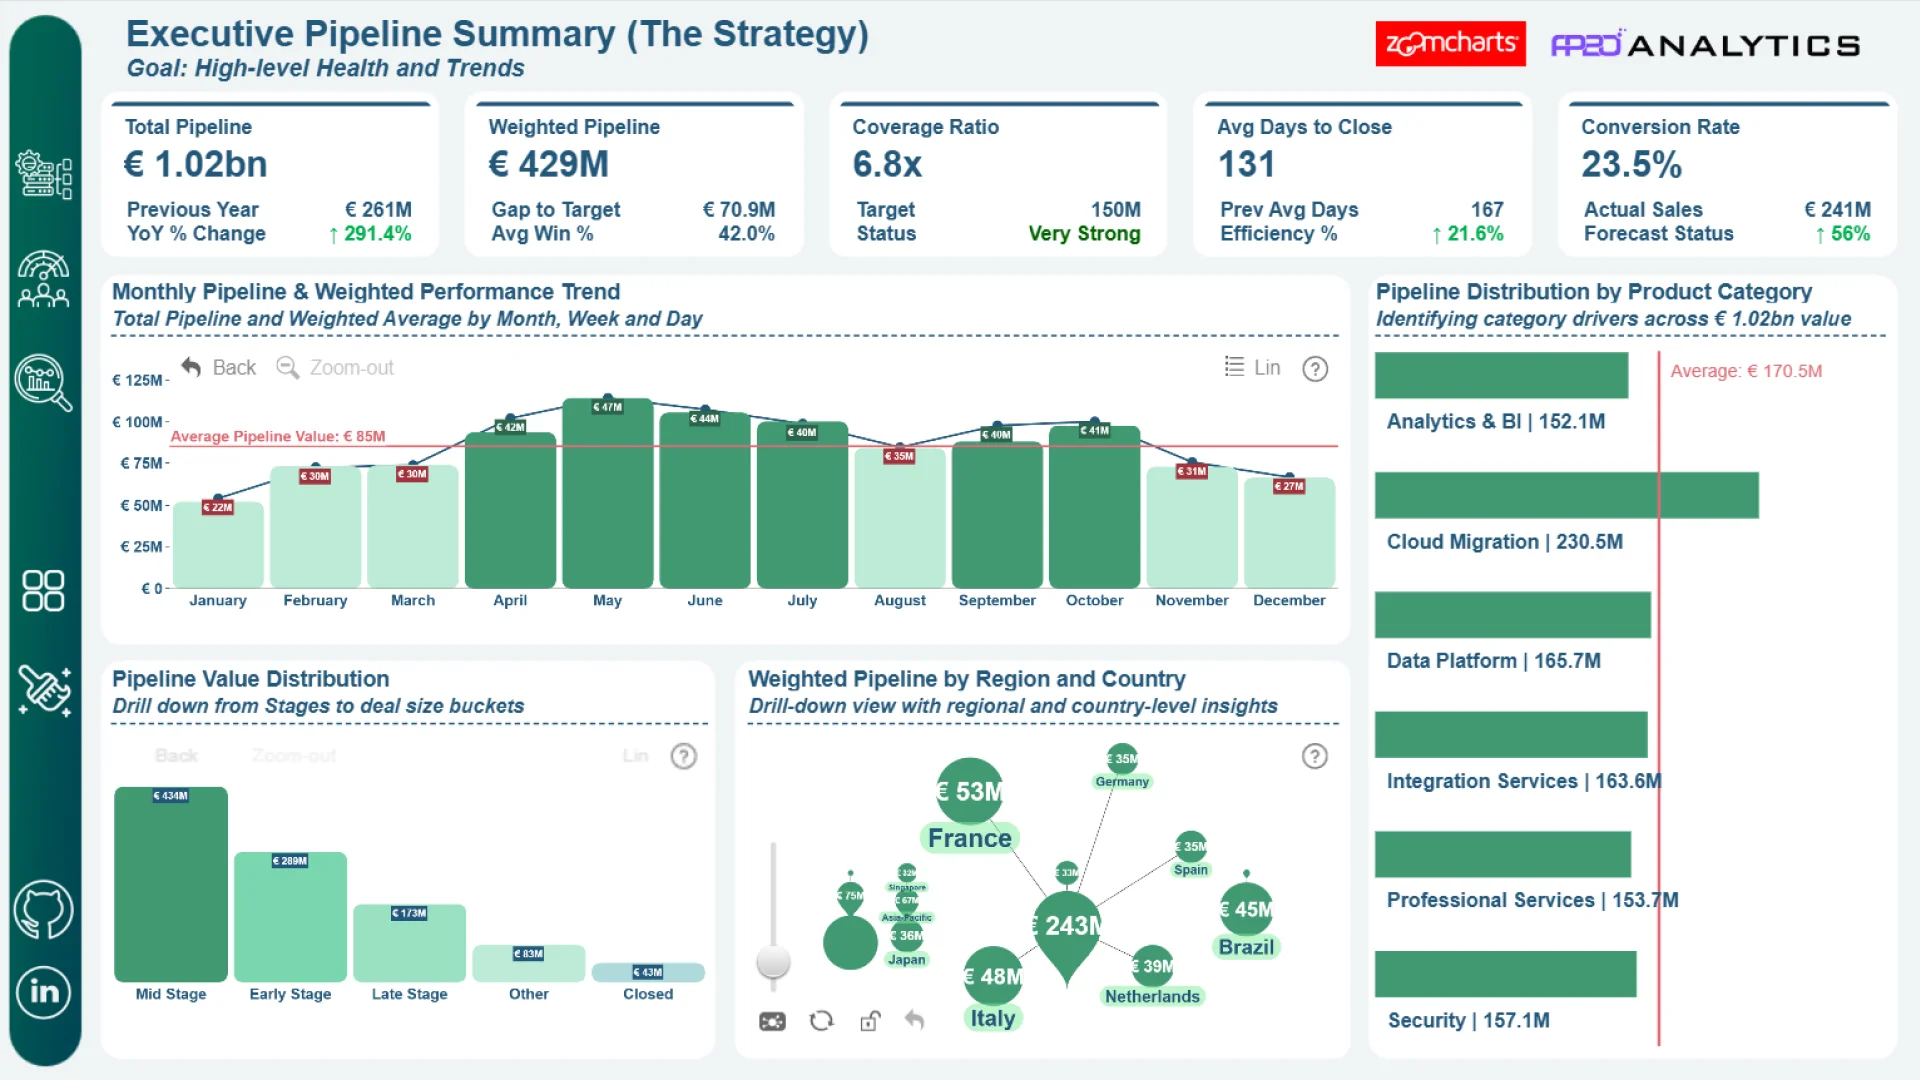
Enterprise sales analytics dashboard built in Power BI to evaluate a €1.02B pipeline with 291% year-over-year growth. The report covers executive KPIs, regional and product performance, and a sales team analysis of 4,981 deals with a 60% win rate. It also includes risk assessment, gap-to-target tracking, and revenue forecasting to support data-driven sales decisions.
ZoomCharts visuals used
4U Report Challenges
Participate in data challenges, build and submit reports to get free template downloads.
Join CommunityMobile view allows you to interact with the report. To Download the template please switch to desktop view.

Was this helpful? Thank you for your feedback!
Sorry about that.
How can we improve it?