511
Sales Pipeline Analysis
Sales Pipeline Analysis
Report Author: Monarch Edokpayi
511
Share template with others
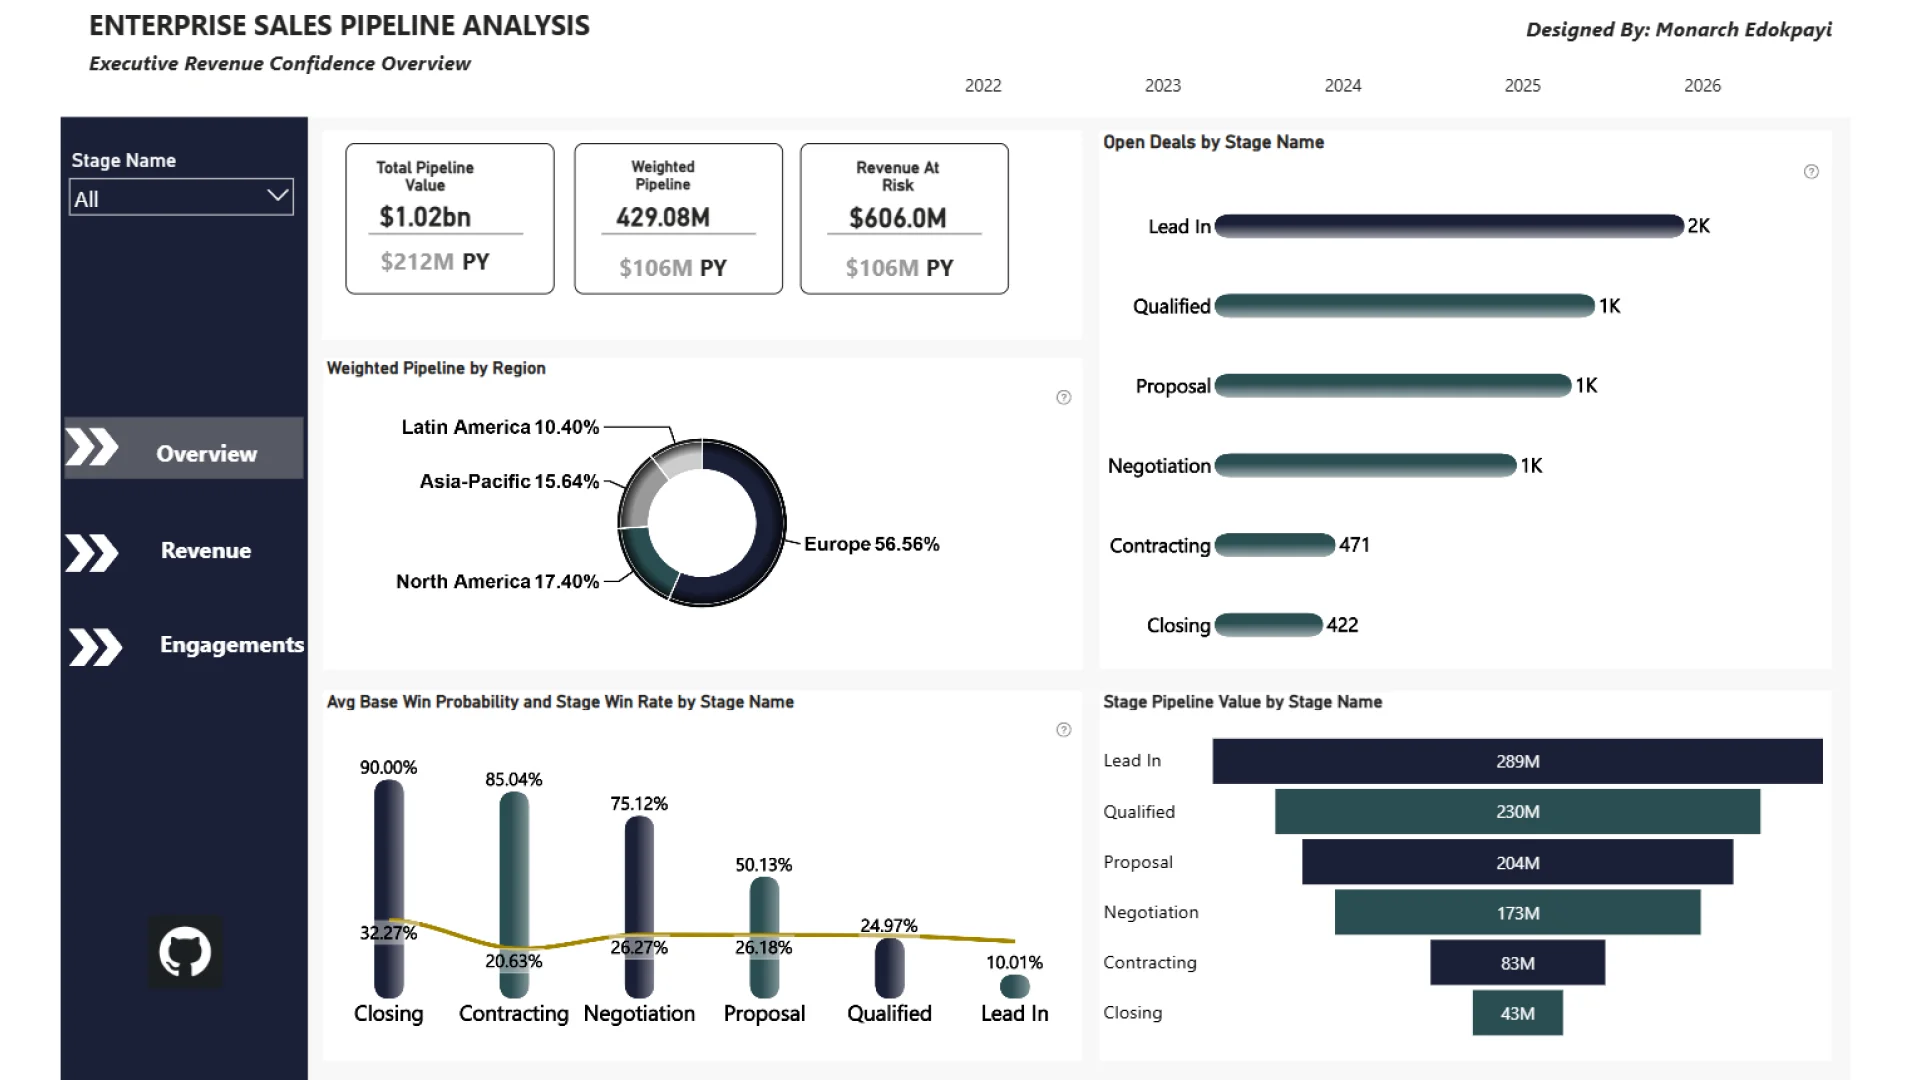
This interactive Power BI report explores the Global B2B Sales Pipeline & Deals Analytics dataset using ZoomCharts Drill Down PRO custom visuals for Power BI. It highlights pipeline value, deal progression, sales activity, and client engagement across regions and industries, helping teams monitor pipeline health and identify stalled or high-risk deals.
The report was submitted to the FP20 Analytics ZoomCharts Data Challenge #35 (February – March 2026).
Author’s Description
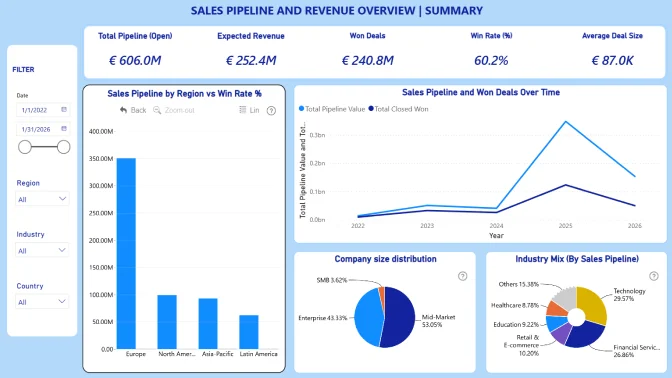
This project is an interactive Power BI dashboard designed to provide executive-level visibility into sales performance, pipeline health, and revenue forecasting. The dashboard delivers a comprehensive overview of key commercial metrics including Total Pipeline Value, Weighted Pipeline, Revenue at Risk, Actual Revenue, Forecast Revenue, and Deal Volume. It enables stakeholders to compare current performance against the previous year using dynamic KPI indicators with trend arrows and year-over-year percentage changes.
ZoomCharts visuals used
4U Report Challenges
Participate in data challenges, build and submit reports to get free template downloads.
Join CommunityMobile view allows you to interact with the report. To Download the template please switch to desktop view.
Was this helpful? Thank you for your feedback!
Sorry about that.
How can we improve it?