350
Procurement Savings Dashboard
Procurement Savings Dashboard
More Report pages
Report Author: Vincensius Prase
350
Share template with others
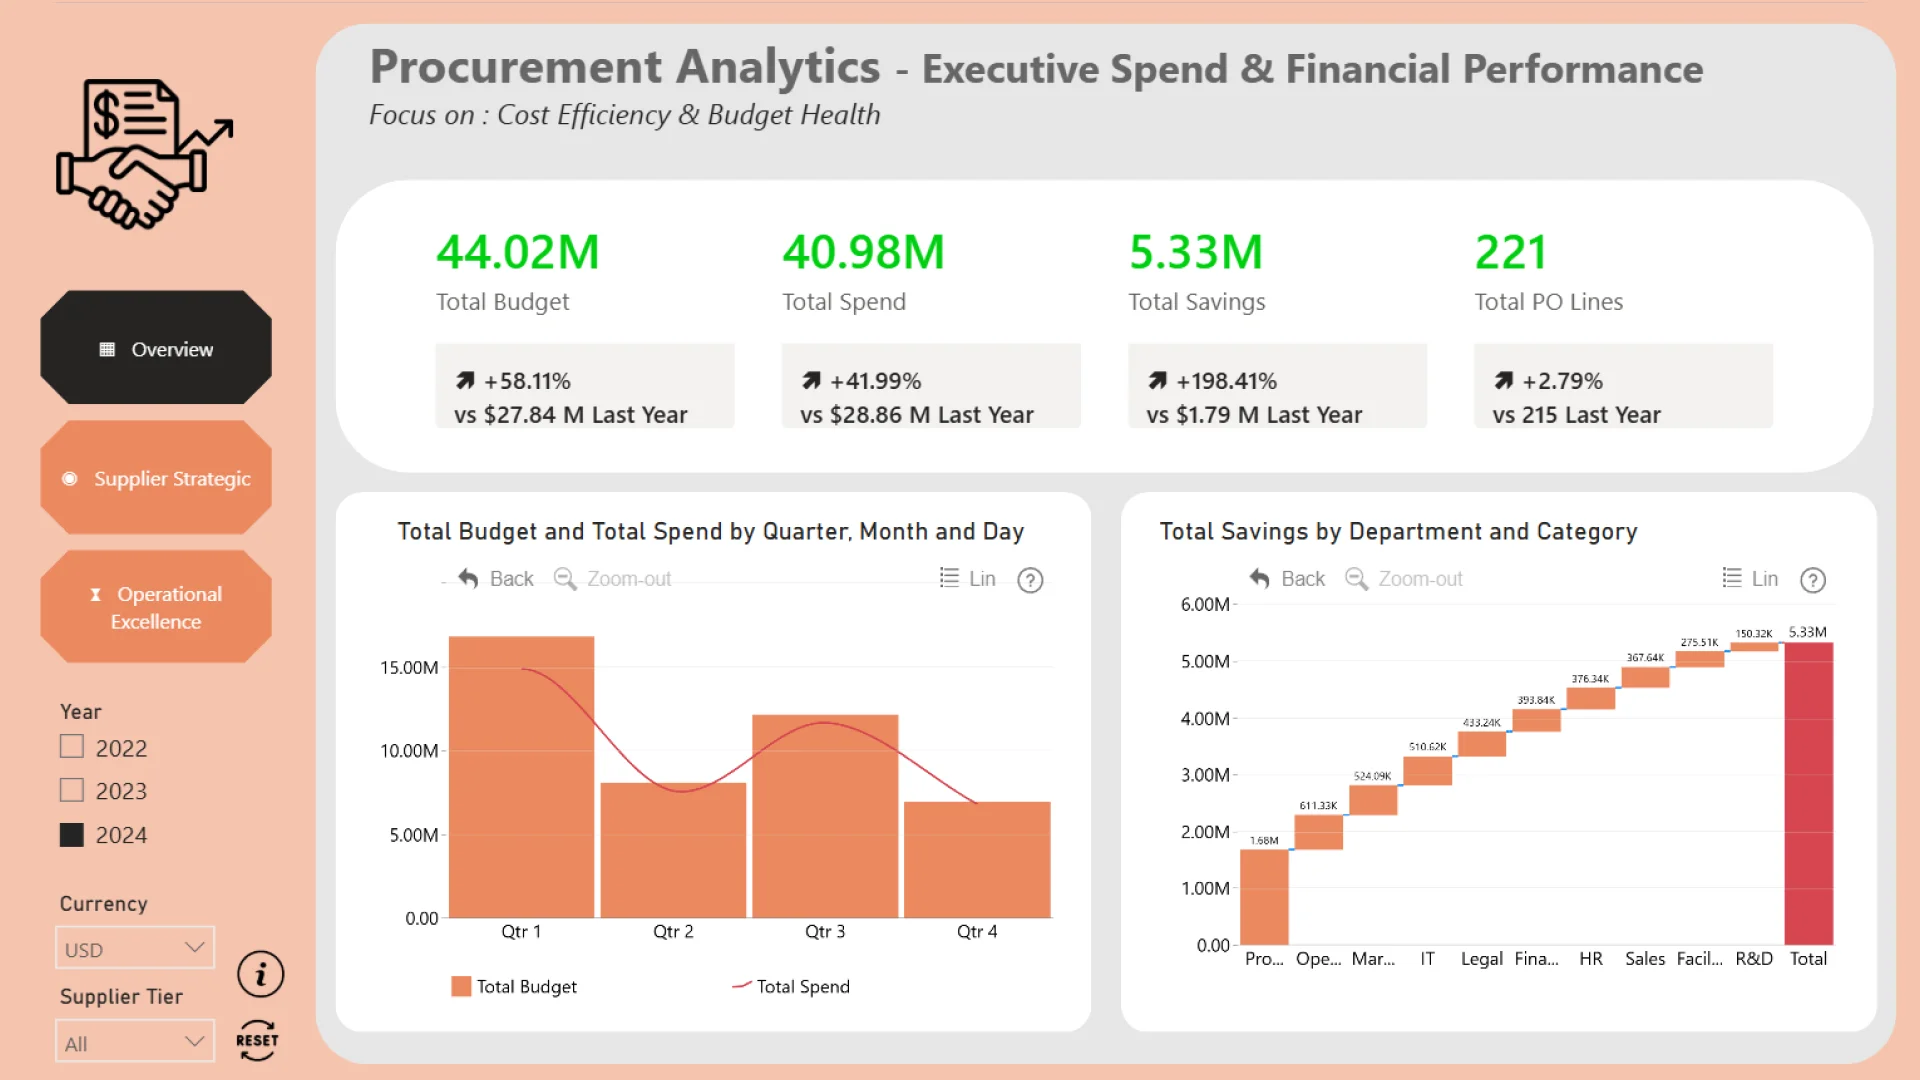
This interactive Power BI report explores the Procurement dataset using ZoomCharts Drill Down custom visuals and native Power BI visuals. It analyzes purchase order activity from 2022 to 2024, highlighting procurement spend, supplier performance, budget versus actuals, savings, delivery timelines, supplier risk, and maverick spend across categories, departments, regions, and suppliers.
The report helps users identify spending trends, compare supplier performance, monitor compliance, evaluate budget pressure, and uncover opportunities to improve procurement efficiency, reduce risk, and support better purchasing decisions.
The report was submitted to the FP20 Analytics ZoomCharts Data Challenge 37 (April-May 2026).
Author’s Description:
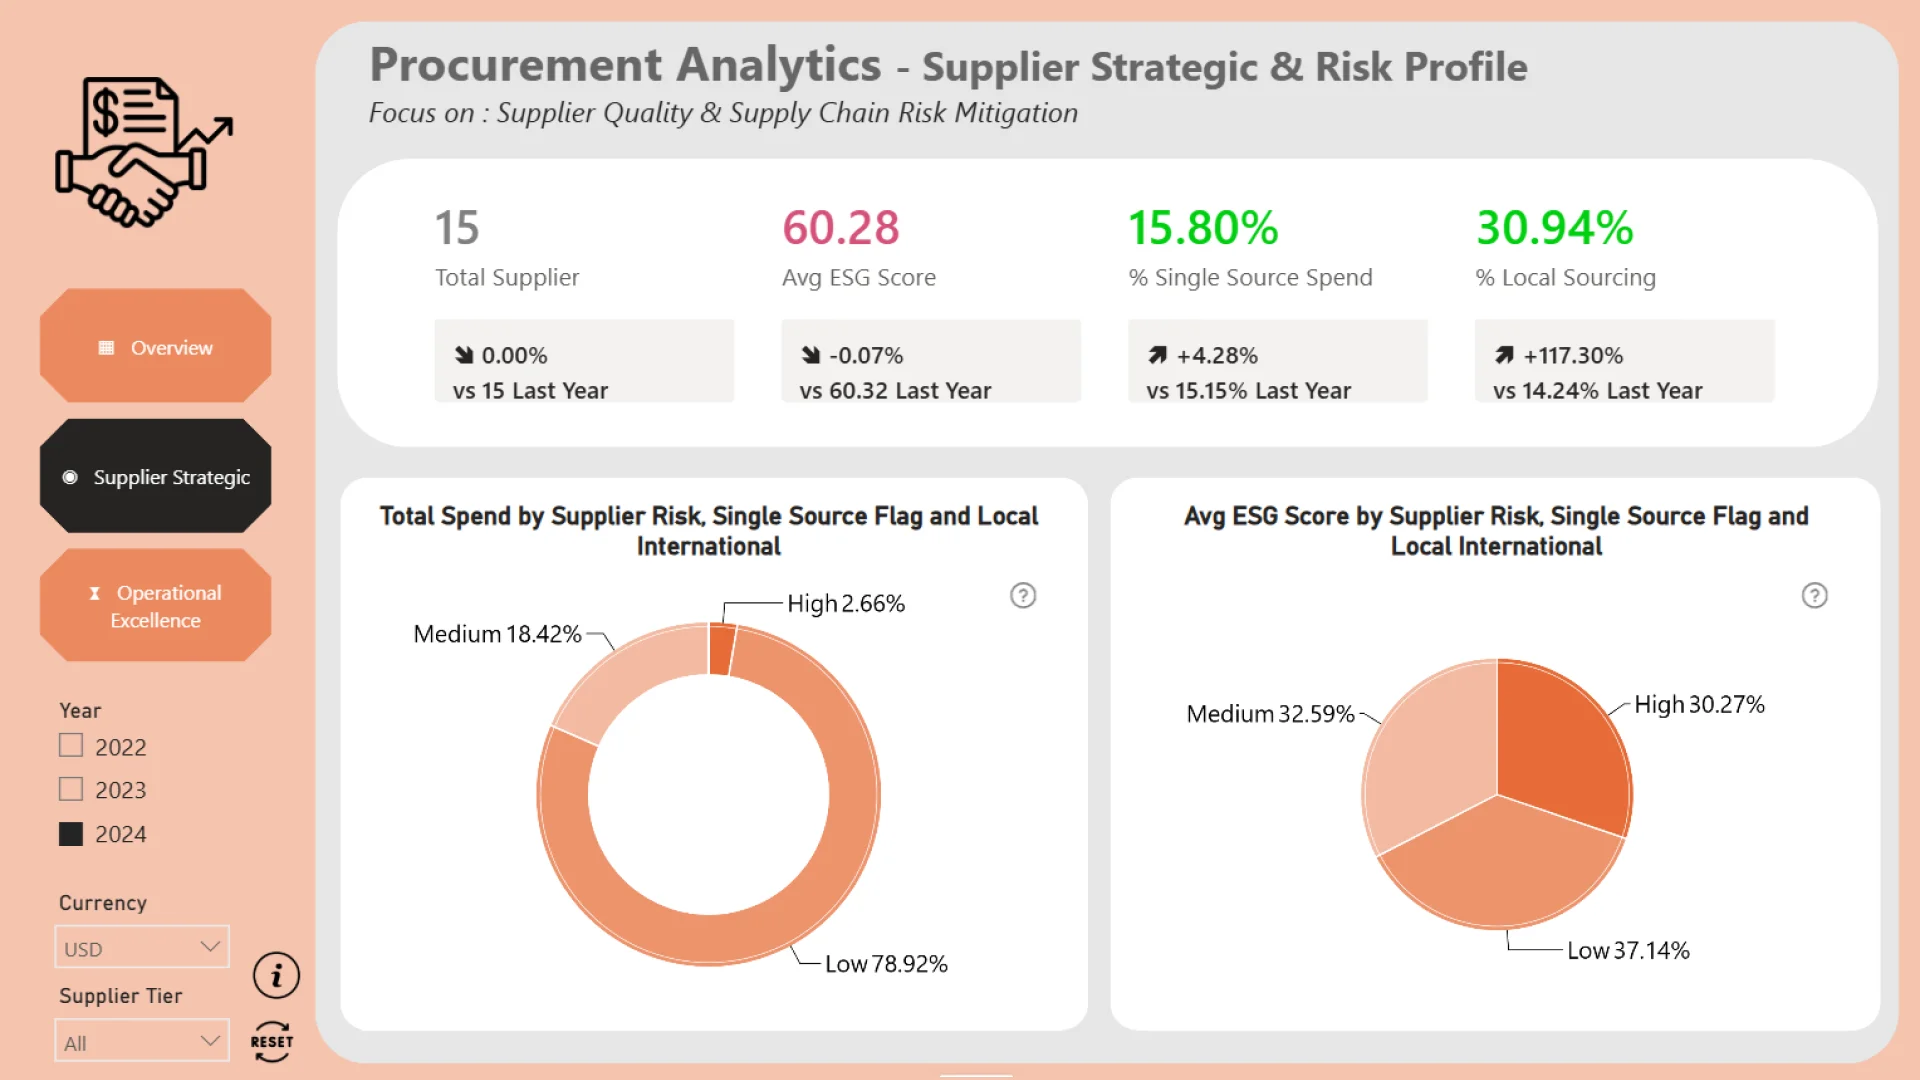
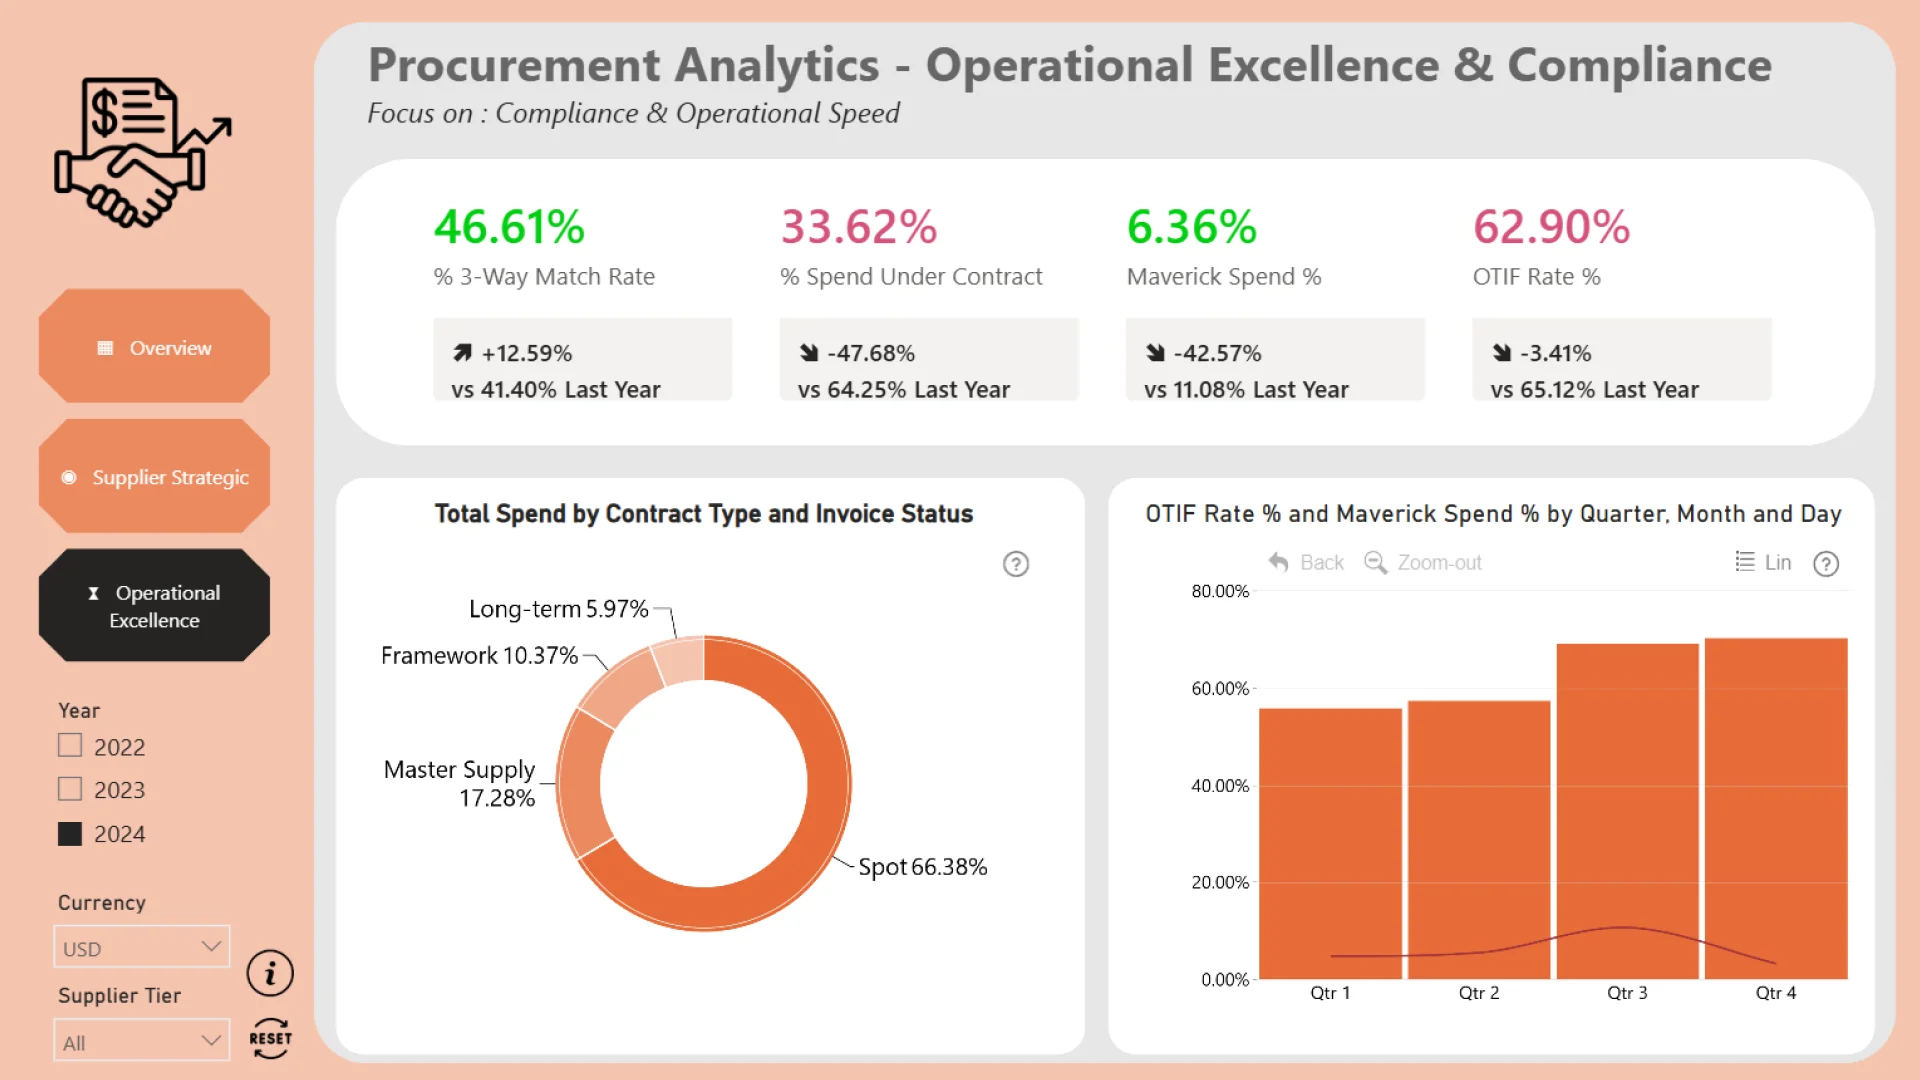
This Power BI report provides a comprehensive analysis of procurement performance, focusing on cost efficiency, supplier risk management, and operational compliance. Designed with a strong emphasis on UX/UI, the dashboard features intuitive cross-chart filtering, dynamic currency selection, and multi-layer drill-down capabilities. By tracking critical supply chain metrics such as Maverick Spend, OTIF, 3-Way Match Rates, and Supplier ESG Scores, this report transforms raw procurement data into actionable strategic insights.
ZoomCharts visuals used
4U Report Challenges
Participate in data challenges, build and submit reports to get free template downloads.
Join CommunityMobile view allows you to interact with the report. To Download the template please switch to desktop view.


Was this helpful? Thank you for your feedback!
Sorry about that.
How can we improve it?