2923
Power BI Operational KPI Dashboard
Power BI Operational KPI Dashboard
More Report pages
Report Author: Agbata Dickson Ukolojo
2923
Share template with others
Power BI Operational KPI Dashboard
A Power BI executive dashboard example for monitoring financial, customer, workforce, and operational performance in one interactive report.
This dashboard designed for executive reporting and performance monitoring, it helps users quickly assess business health, identify trends, and track progress against strategic targets.
The dashboard combines high-level KPI monitoring with detailed performance analysis, making it easy to move from executive summaries to actionable insights.
Key Insights of This Power BI Operational KPI Dashboard
Executive KPI Overview
Compare actual performance against budget, plan, and forecast targets.
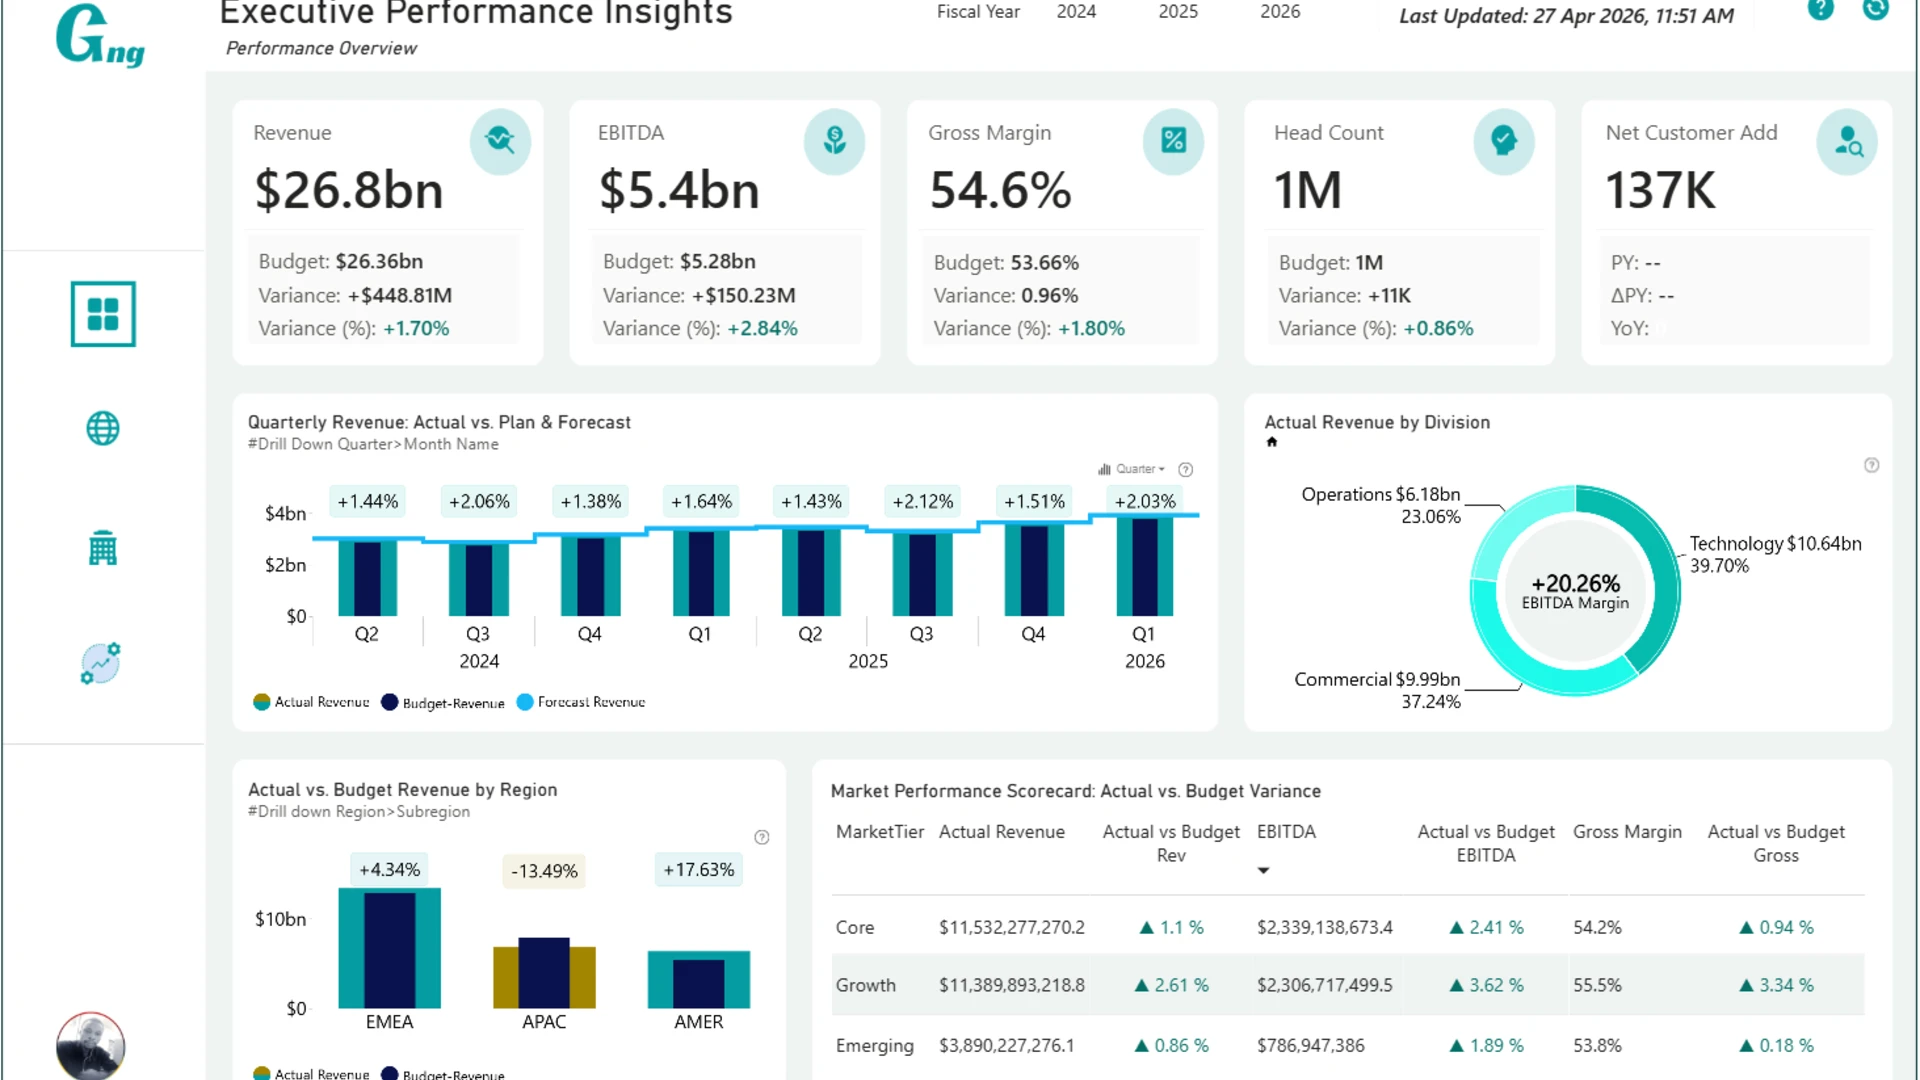
Financial Performance
Track revenue, EBITDA, gross margin, and other core financial metrics.
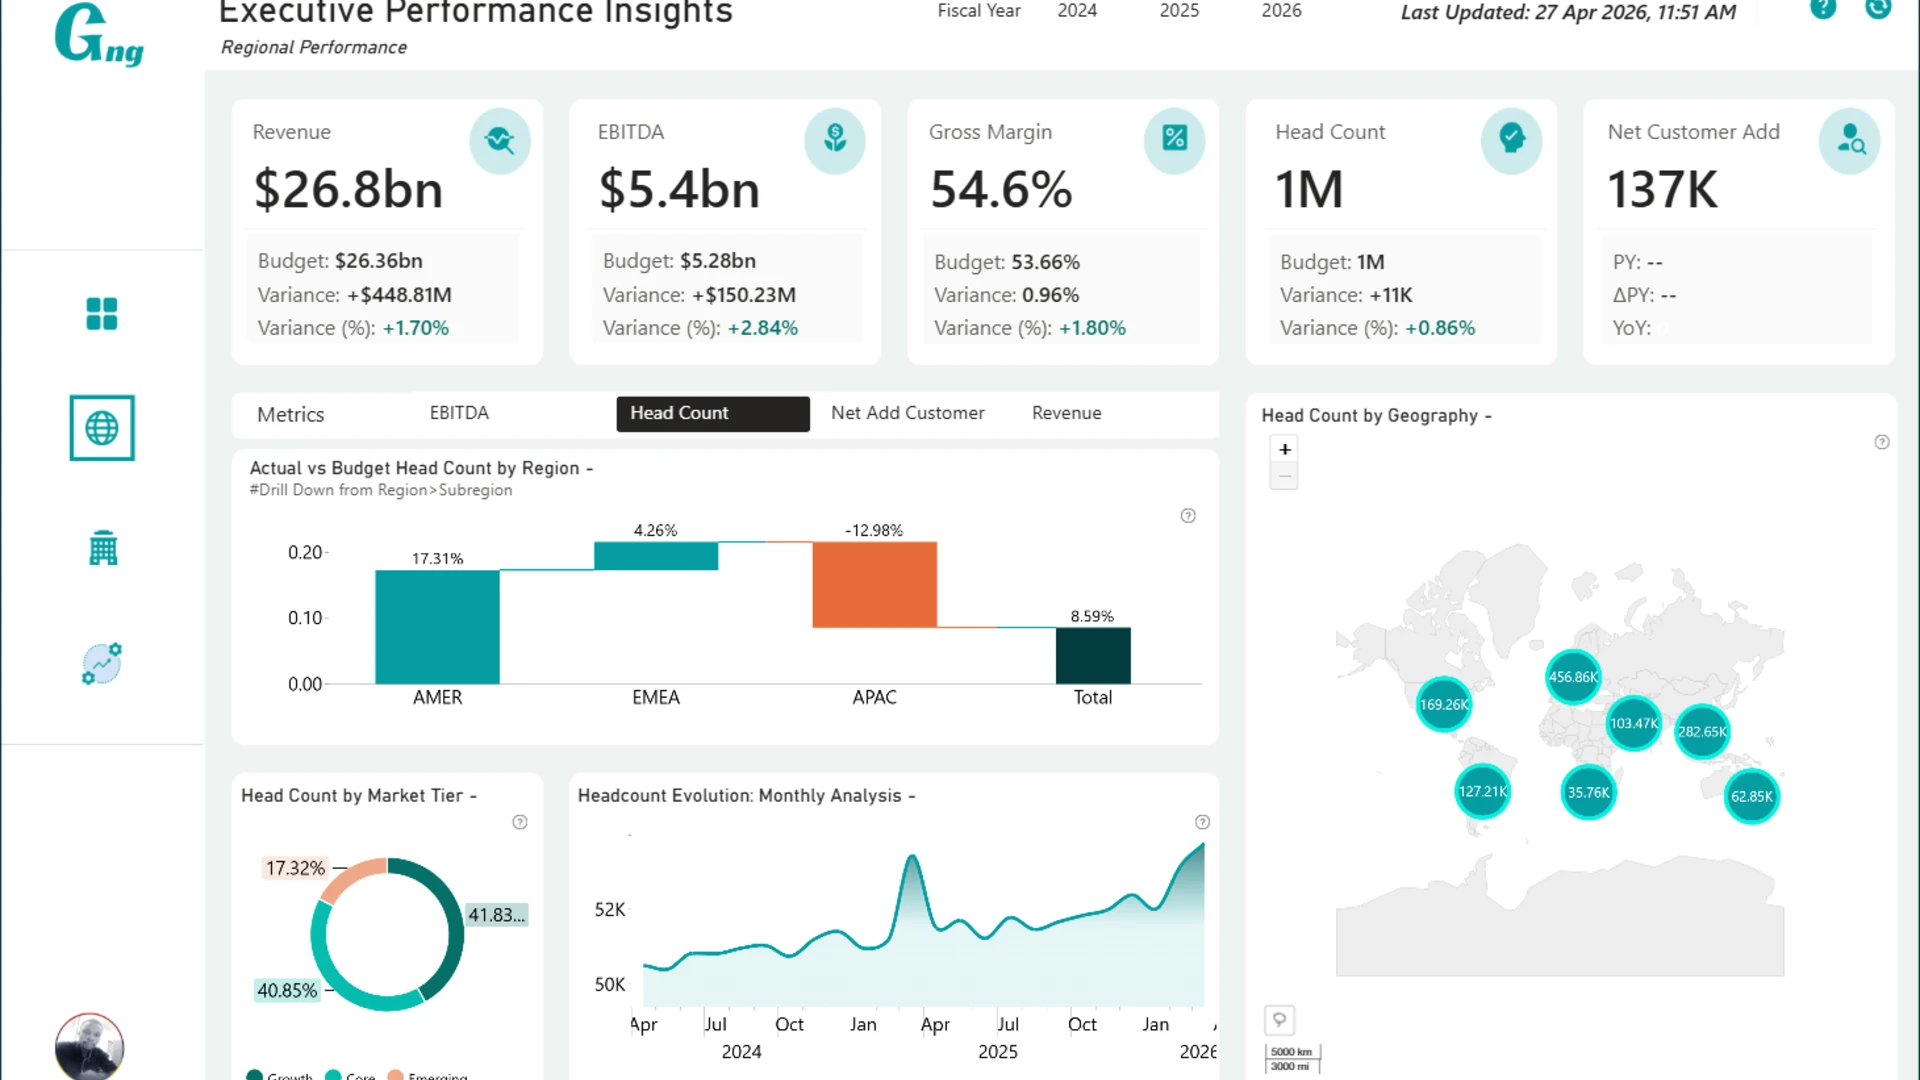
Customer & Workforce Trends
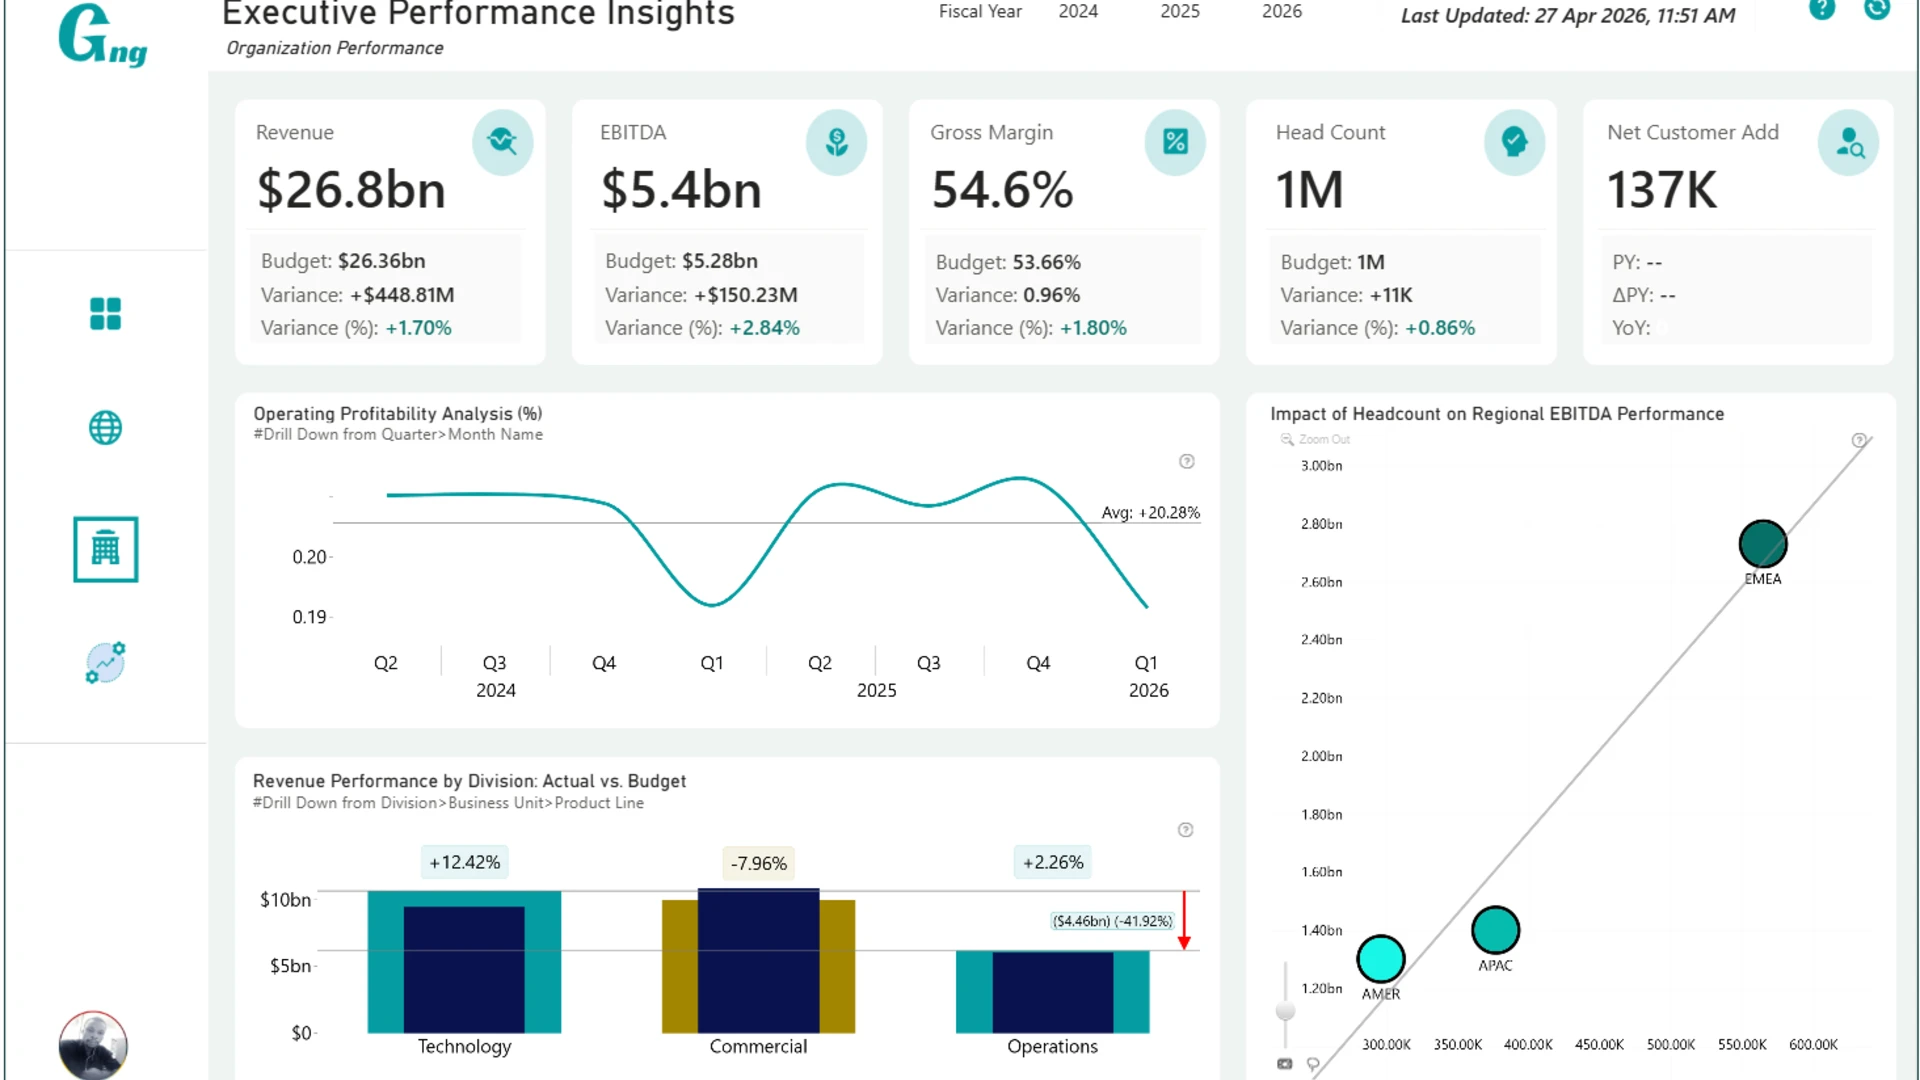
Analyze customer growth, retention, headcount, and organizational performance.
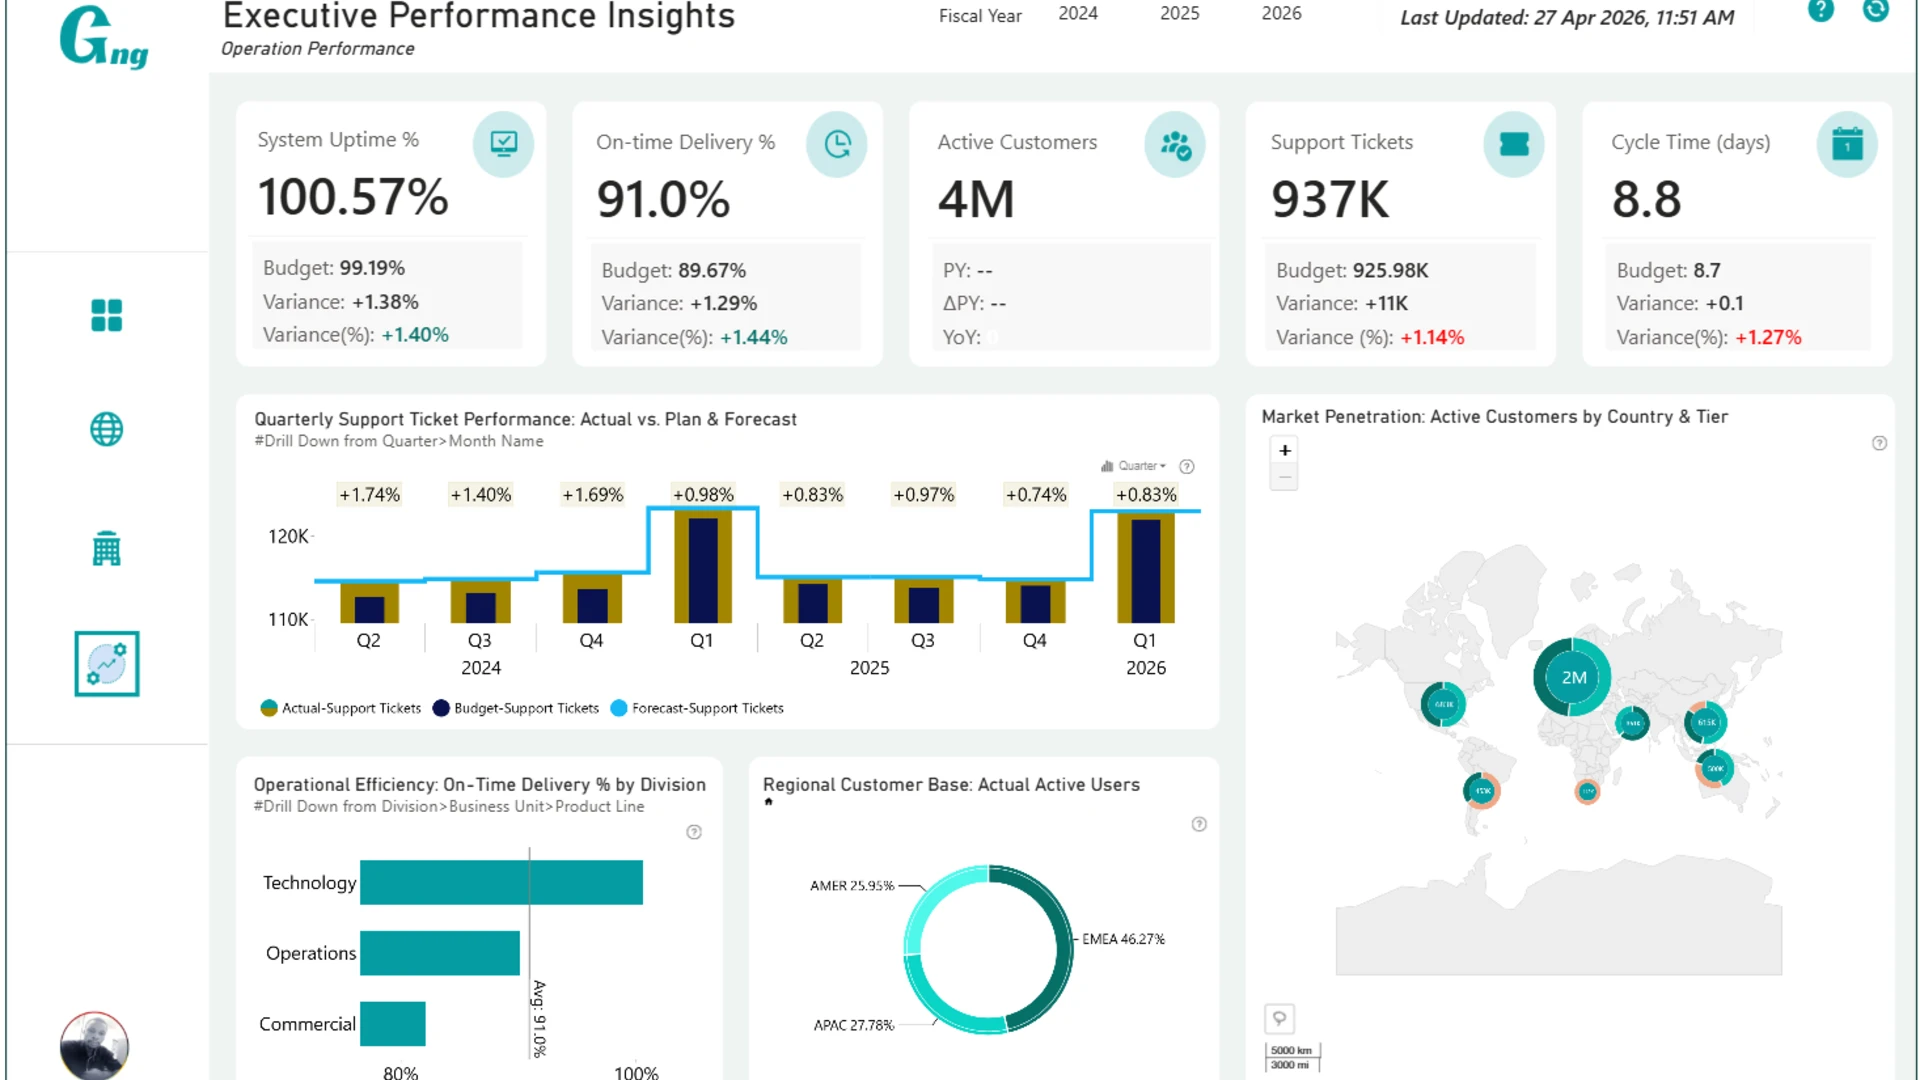
Operational Performance
Monitor system uptime, on-time delivery, support tickets, and cycle time.
Regional & Business Unit Analysis
Compare performance across regions, divisions, business units, and customer segments.
Historical Trend Analysis
Review performance changes over time and identify areas requiring attention.
Why This Report Is Useful
With a clean layout and intuitive navigation, this Power BI operational KPI dashboard helps users quickly identify performance drivers and areas requiring attention. Interactive filtering and cross-analysis capabilities make it easy to explore data from multiple business perspectives.
How to Use This Power BI Operational KPI Dashboard
Interact with visuals
Click any active element in the report to filter and explore related data.
Compare targets
Compare actuals against budget, plan, and forecast to evaluate performance.
Drill into details
Explore regional, organizational, divisional, and customer-performance details.
Download and Customize
Download the .pbix file to review the report structure, calculations, and KPI logic. You can customize the dashboard with your own data to create an operational performance monitoring solution tailored to your organization.
Submitted for the ZoomCharts 4U Reports Challenge, April 2026, this Power BI report example shows how interactive visuals can support faster executive performance review and operational decision-making.
ZoomCharts visuals used
4U Report Challenges
Participate in data challenges, build and submit reports to get free template downloads.
Join CommunityMobile view allows you to interact with the report. To Download the template please switch to desktop view.


Was this helpful? Thank you for your feedback!
Sorry about that.
How can we improve it?