logo
For Power BI
  • Products
    • Custom Visuals for Power BI
    • Report Templates
  • Resources

      Resources

    • Documentation
    • Report Examples
    • Blog
    • Webinars
    • Video Tutorials
    • Visuals Gallery

    Support

    • ZoomCharts Assistance
    • Contact Sales
    • Contact Support
    • FAQ

    Challenges

    Challenges

    Improve your report creation skills by participating in free challenges for report creators.

    Learn more
    Get Developer License
  • Services
    • Power BI Report Development
    • Custom Visual Development
  • Challenges
  • Pricing
Get started
Get started
Get it now
Go back

Contents

Dashboard and report examples Power BI KPI Budget Dashboard
Go back

110

Power BI KPI Budget Dashboard

Power BI KPI Budget Dashboard

Report
Report
Report
Report

More Report pages

Report
Report
Report
Report
Report Interact

Report Author: Anuoluwapo Odunayo Aliu

110

Line Combo Timeline KPI

Share template with others

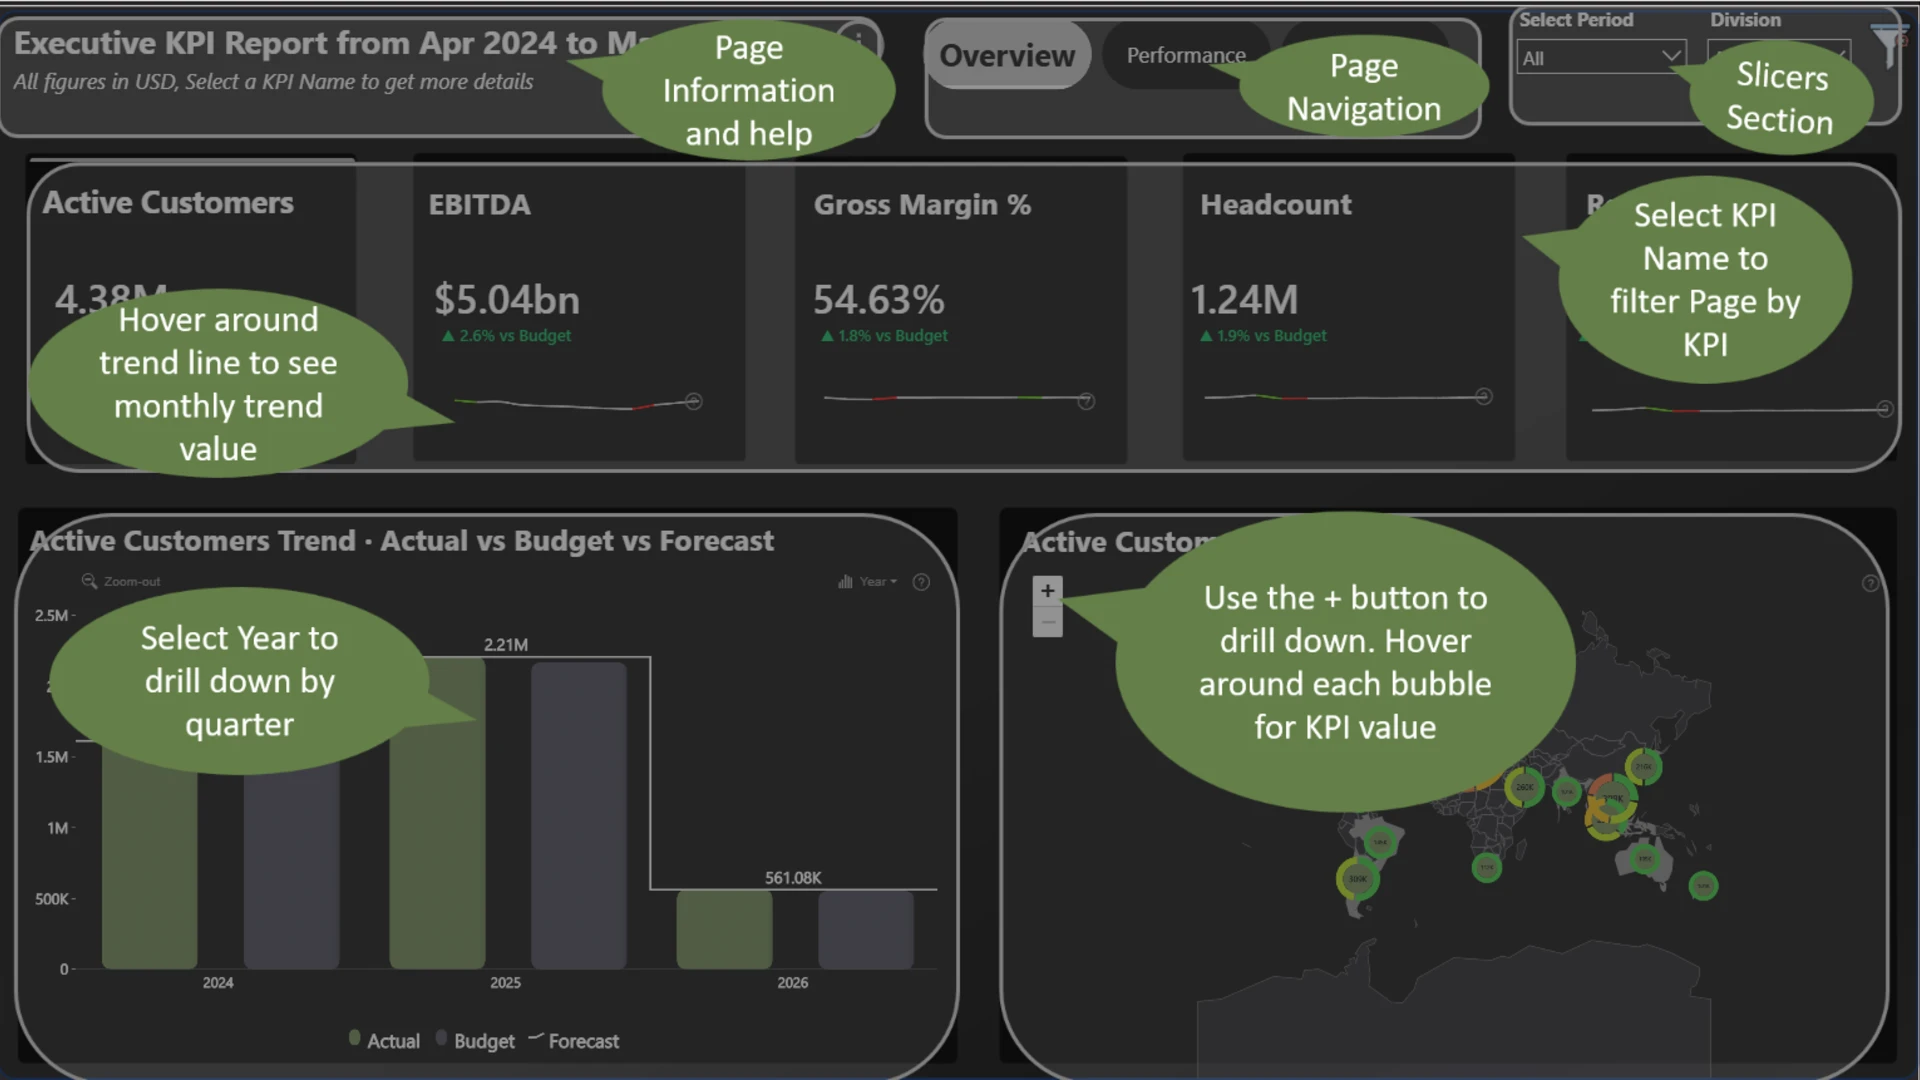
This interactive Power BI report presents an executive KPI dashboard built with ZoomCharts Drill Down custom visuals for Power BI. It highlights key metrics such as Revenue, EBITDA, Margin, Headcount, and Customer Growth, with Actual vs Budget vs Forecast comparisons, organizational drill-down, and regional performance analysis to support strategic decision-making.

The report was submitted to the ZoomCharts “4U Reports Challenge” (April 2026), using ZoomCharts Drill Down custom visuals for Power BI.


Author's Description:

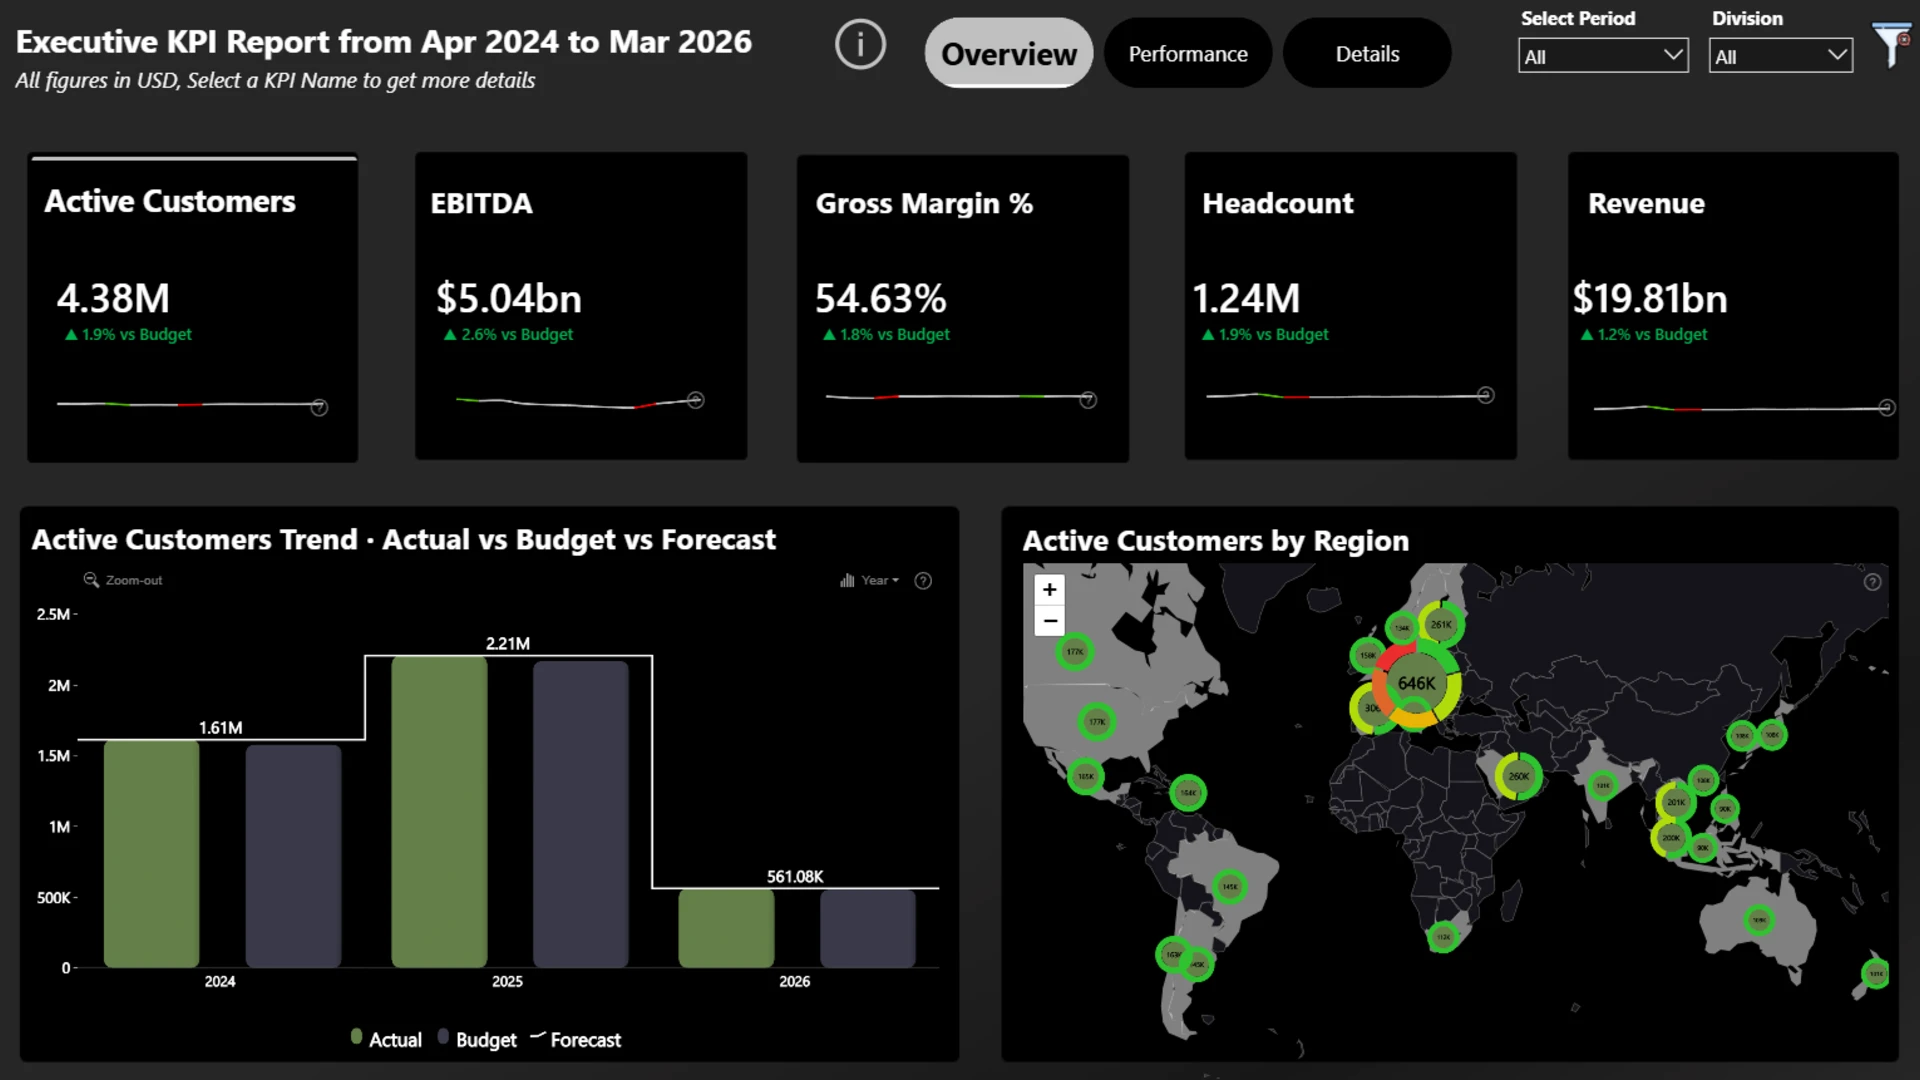
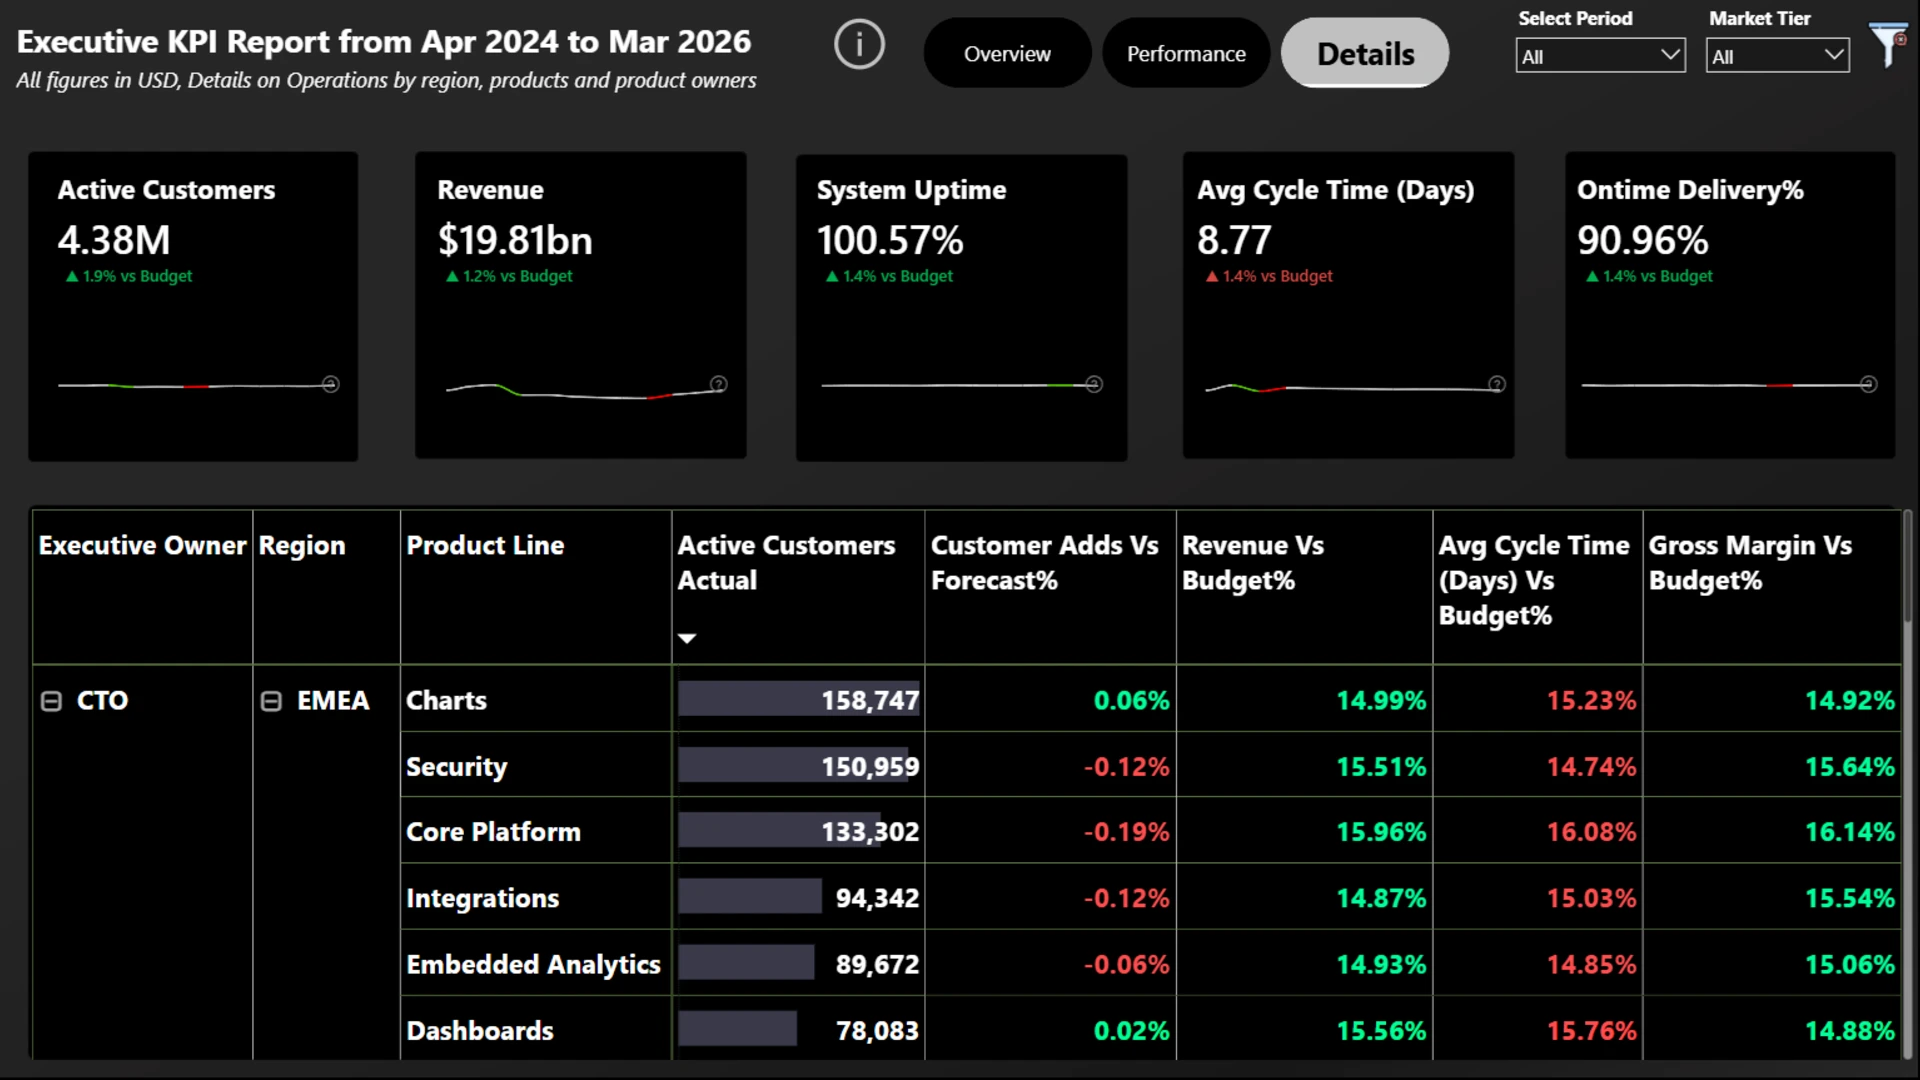
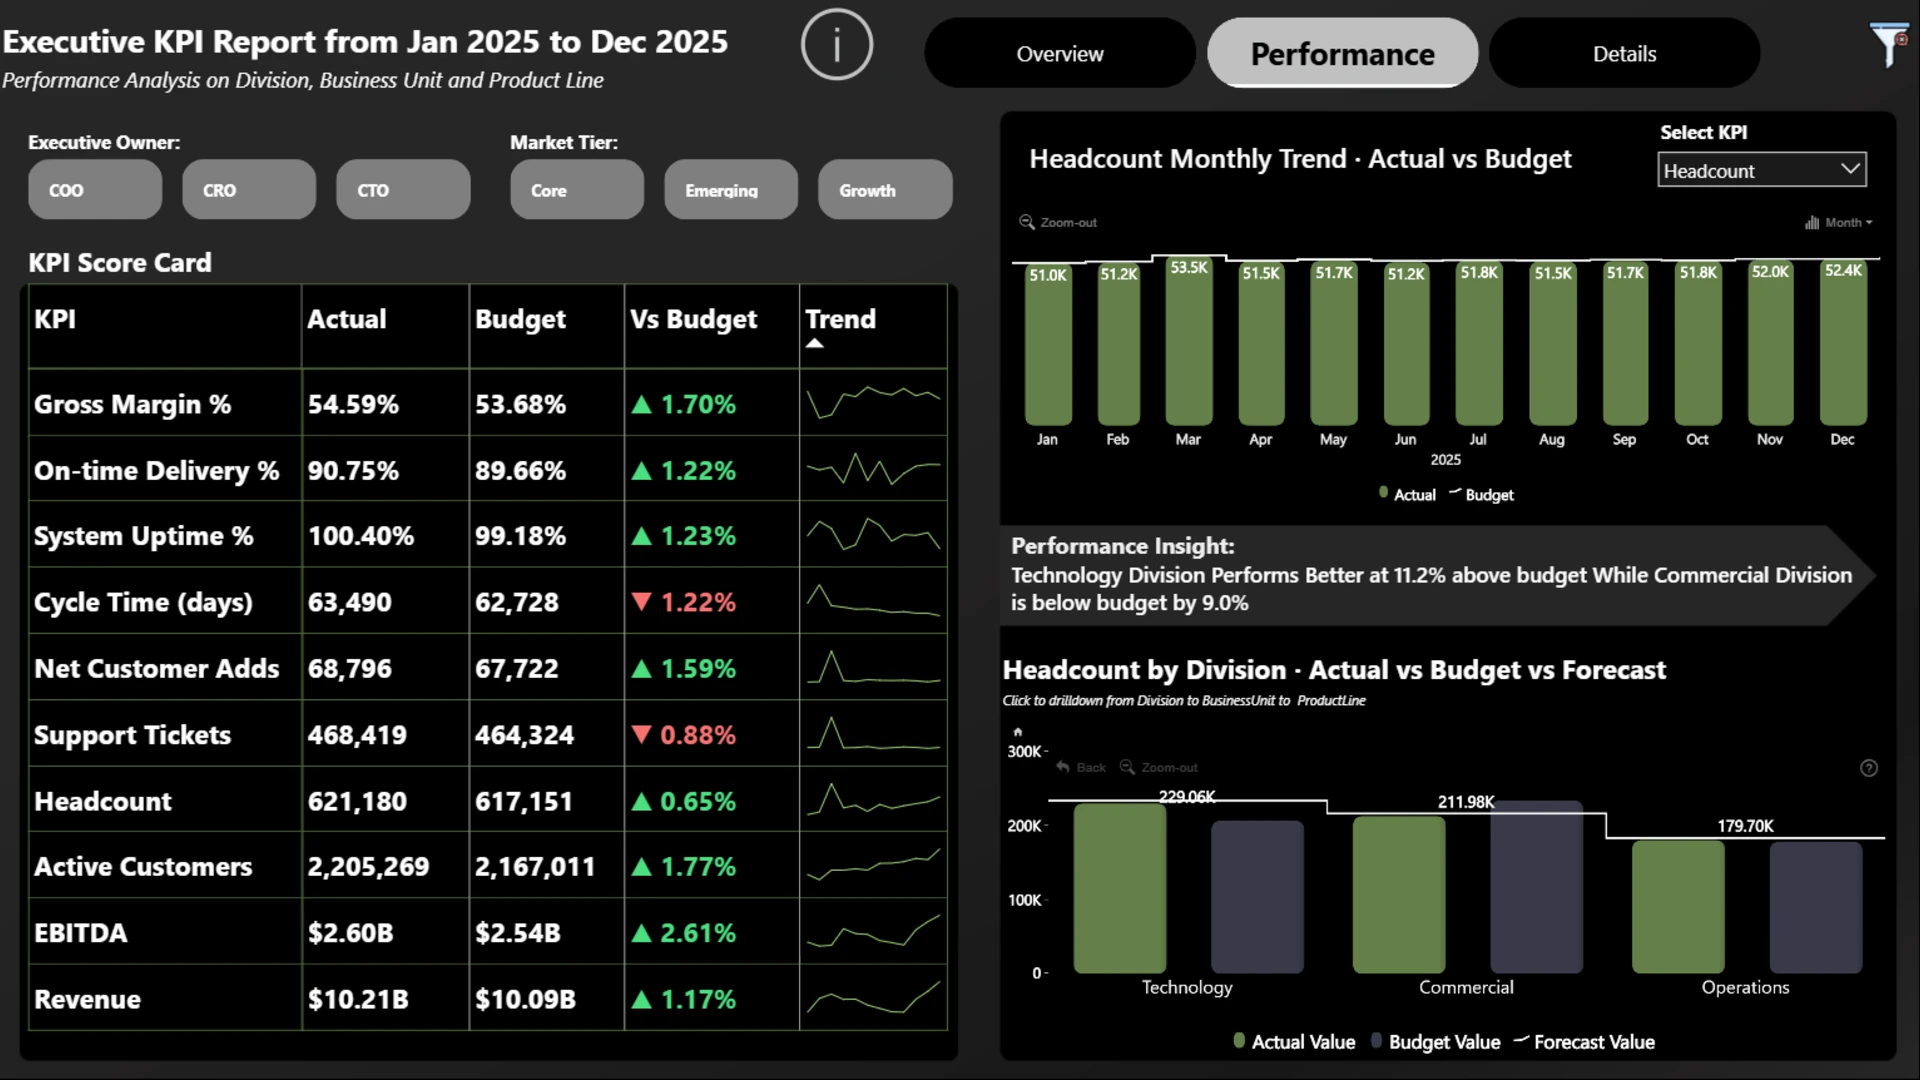
Executive KPI Report (Apr 2024-Mar 2026) provides a three-page dashboard tracking performance across customers, revenue, profitability, operations, and workforce. Page 1 delivers a high-level snapshot of five key KPIs - Active Customers (4.38M), Revenue ($19.81bn), EBITDA ($5.04bn), Gross Margin (54.63%), and Headcount (1.24M) - all performing above budget, supported by regional and trend visuals. Page 2 presents a detailed scorecard of ten KPIs for Jan-Dec 2025, where Revenue, EBITDA, and Gross Margin exceed targets, while Cycle Time and Support Tickets highlight areas for improvement, alongside division-level headcount variance. Page 3 enables drill-down by Executive Owner, Region, and Product Line, with conditional formatting to quickly identify over- and underperforming segments.

ZoomCharts visuals used

Drill Down Line PRO Drill Down Line PRO
Drill Down Shape Map PRO Drill Down Shape Map PRO
Drill Down Combo PRO Drill Down Combo PRO
Drill Down Timeline PRO Drill Down Timeline PRO

4U Report Challenges

Participate in data challenges, build and submit reports to get free template downloads.

Join Community

Mobile view allows you to interact with the report. To Download the template please switch to desktop view.

Similar reports

All Reports 2690 results
New
Report Card

Power BI Banking Dashboard by Okeh Dono Efasa

62871

New
Report Card

Power BI Financial Analysis Dashboard by Iris Mejuto Crego

138360

New
Report Card

Power BI Service Desk Dashboard by Iris Mejuto Crego

172600

Explore all reports

Was this helpful? Thank you for your feedback!

Sorry about that.

How can we improve it?

Power BI KPI Budget Dashboard

Report Author: Anuoluwapo Odunayo Aliu

110

ZoomCharts

Welcome to ZoomCharts

You’re almost there! Create an account to download reports.

or
Sign up with Microsoft

Verify your email address

We have sent a code to your email address. Please input the code below.

Didn't receive code? Request again (after 30 seconds)

Already have an account? Log in

ZoomCharts

Log in to your ZoomCharts account

Log in with Microsoft
or
Forgot password?

Reset your password

We'll email you instructions on how to reset your password

Don't have an account? Sign up

Please add credits

You have 0 available downloads.
Get more credits or upgrade your plan to continue.

View pricing
logo
[email protected]
+44 204 577 3993
logo

Products

Drill Down Bubble PRO Drill Down Line PRO Drill Down Network PRO Drill Down Waterfall PRO Drill Down Graph PRO Drill Down Combo PRO Drill Down Combo Bar PRO Drill Down Donut PRO Drill Down Pie PRO Drill Down TimeSeries PRO Drill Down Timeline PRO Drill Down Map PRO Drill Down Scatter PRO All Visuals

Resources

Report Examples Webinars Blog ZoomCharts Academy Visuals Gallery Documentation Custom Visual Development Subscribe to News

Solutions

Custom Visual Development

Company

Pricing About Us Partners Leave feedback Join PowerGroup EU Funding

Help

ZoomCharts Assistance Contact Sales Contact Support FAQ AI Information

Drill Down Line PRO Drill Down Bubble PRO Drill Down Network PRO Drill Down Waterfall PRO Drill Down Graph PRO Drill Down Combo PRO Drill Down Combo Bar PRO Drill Down Donut PRO Drill Down Pie PRO Drill Down TimeSeries PRO Drill Down Timeline PRO Drill Down Map PRO Drill Down Scatter PRO All Visuals

Report Examples Webinars Blog ZoomCharts Academy Visuals Gallery Documentation Custom Visual Development Subscribe to News

Custom Visual Development

Pricing About Us Partners Leave feedback Join PowerGroup EU Funding

ZoomCharts Assistance Contact Sales Contact Support FAQ AI Information
+44 204 577 3993
[email protected]

Ready to get in touch?

Contact our experts with any question about Power BI and ZoomCharts for Free!

Contact us

© 2026, Data Visualization Software Lab

U.S. Patents No. 11,645,343; 11,921,804; 12,346,389

Cookies
Privacy Policy
Global
Legal
Patent
warning

Error message

success

Success info: Done!

ZoomCharts AI Assistant

We noticed you're using an old OS version.

For the best experience, we recommend upgrading to ensure that all website features display correctly.

Cookie settings

We use necessary cookies for site functionality, as well as statistic, marketing, and preference cookies to enhance your experience. For more information and to manage your preferences, please visit our Cookie policy