16772
Power BI Financial Performance Report for SaaS
Power BI Financial Performance Report for SaaS
More Report pages
Report Author: Agbata Dickson Ukolojo
16772
Share template with others
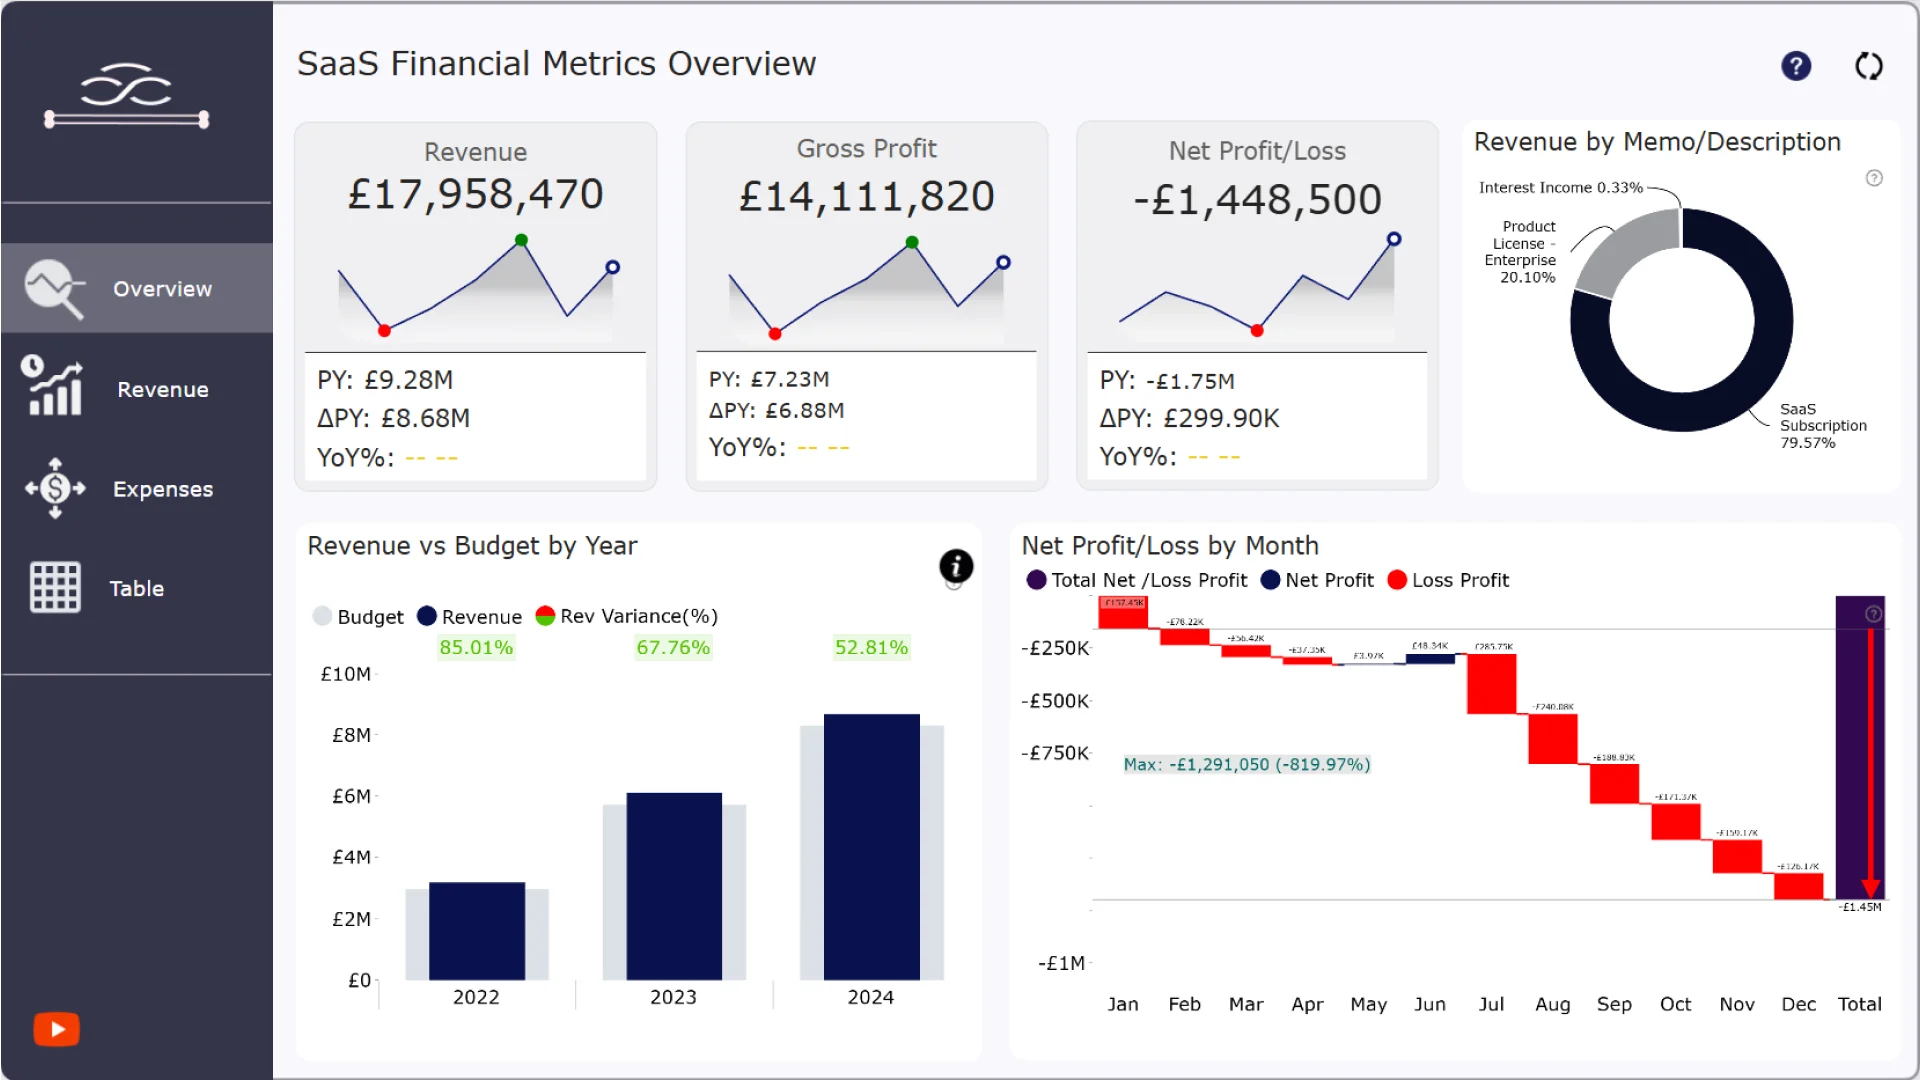
This Power BI SaaS financial performance report template is designed to help finance teams, founders, and analysts track revenue, expenses, profitability, and financial KPIs in a single interactive dashboard.
Built specifically for SaaS financial analysis, the report provides a clear overview of revenue growth, gross profit, operating expenses (OPEX), COGS, EBIT, and net profit/loss, with drill-down capabilities across years, quarters, and months.
Use this Power BI financial dashboard to:
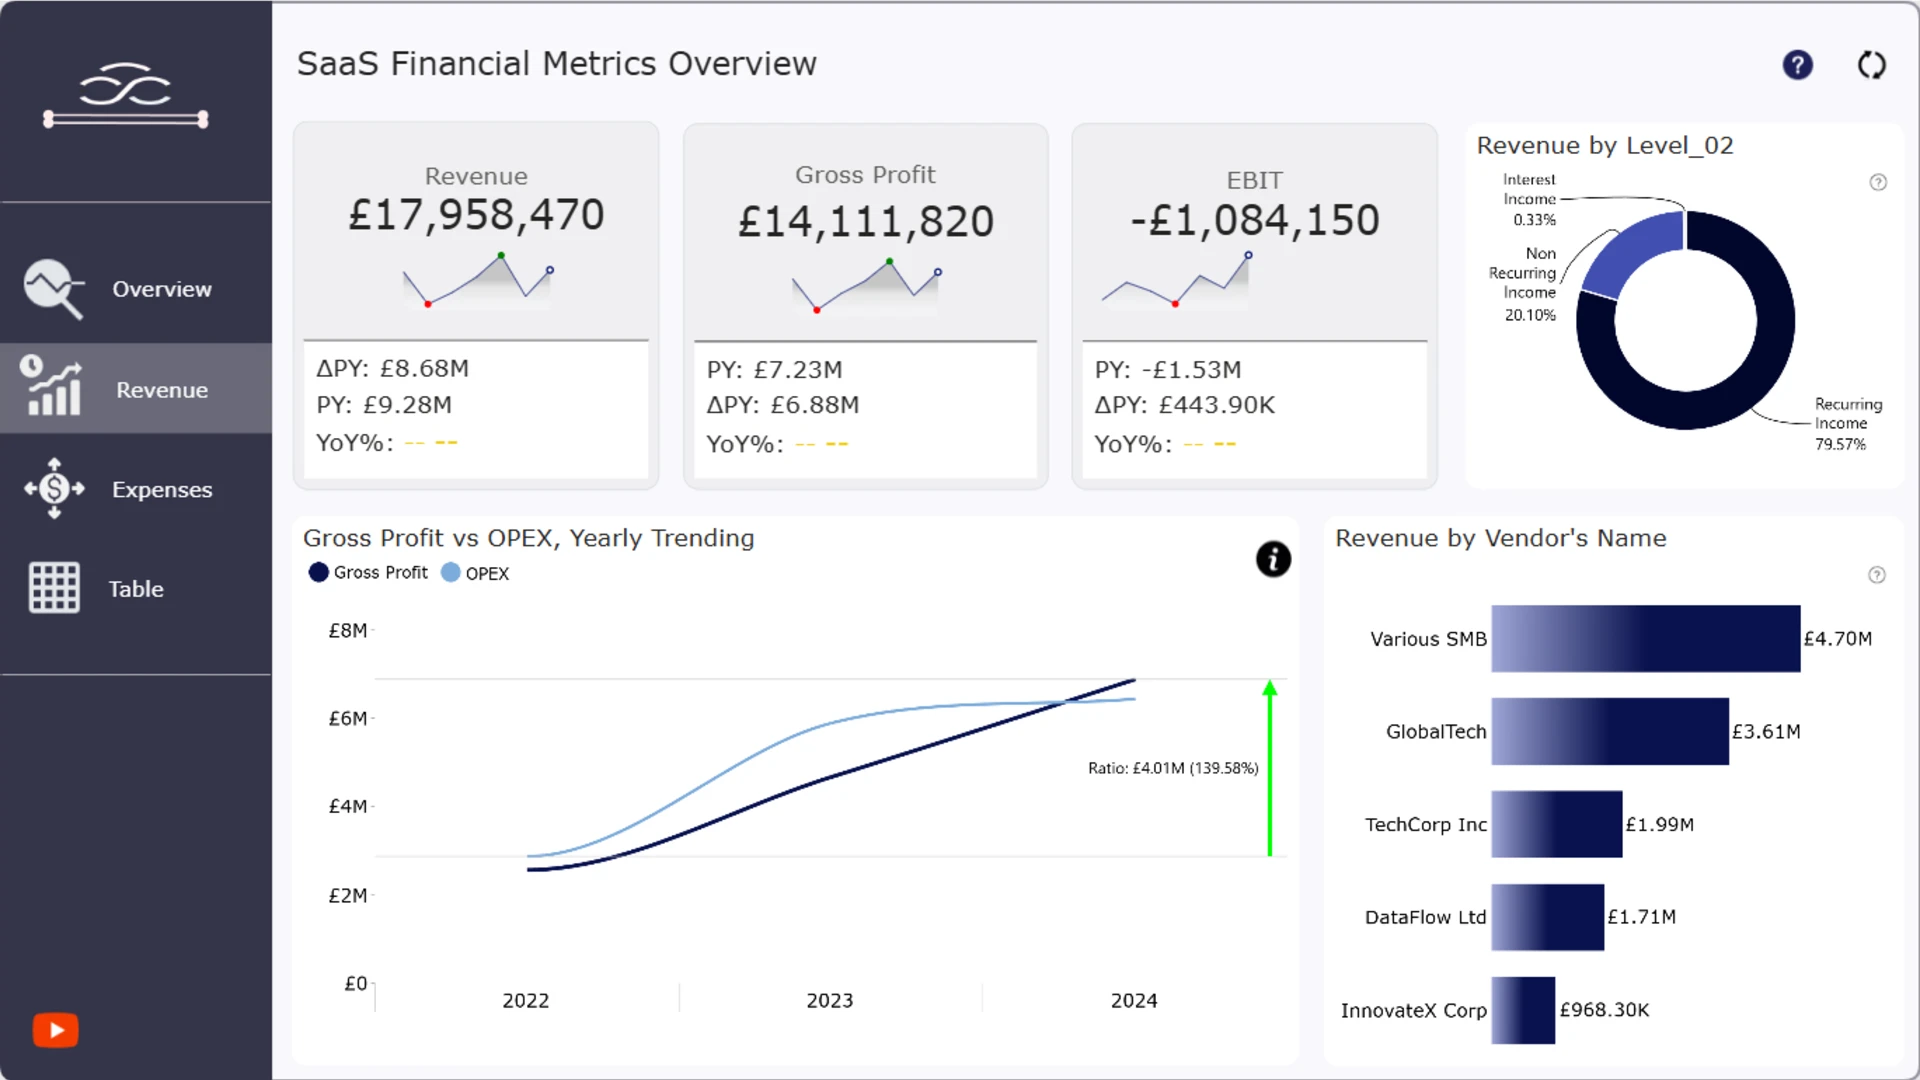
- Monitor SaaS revenue and recurring income
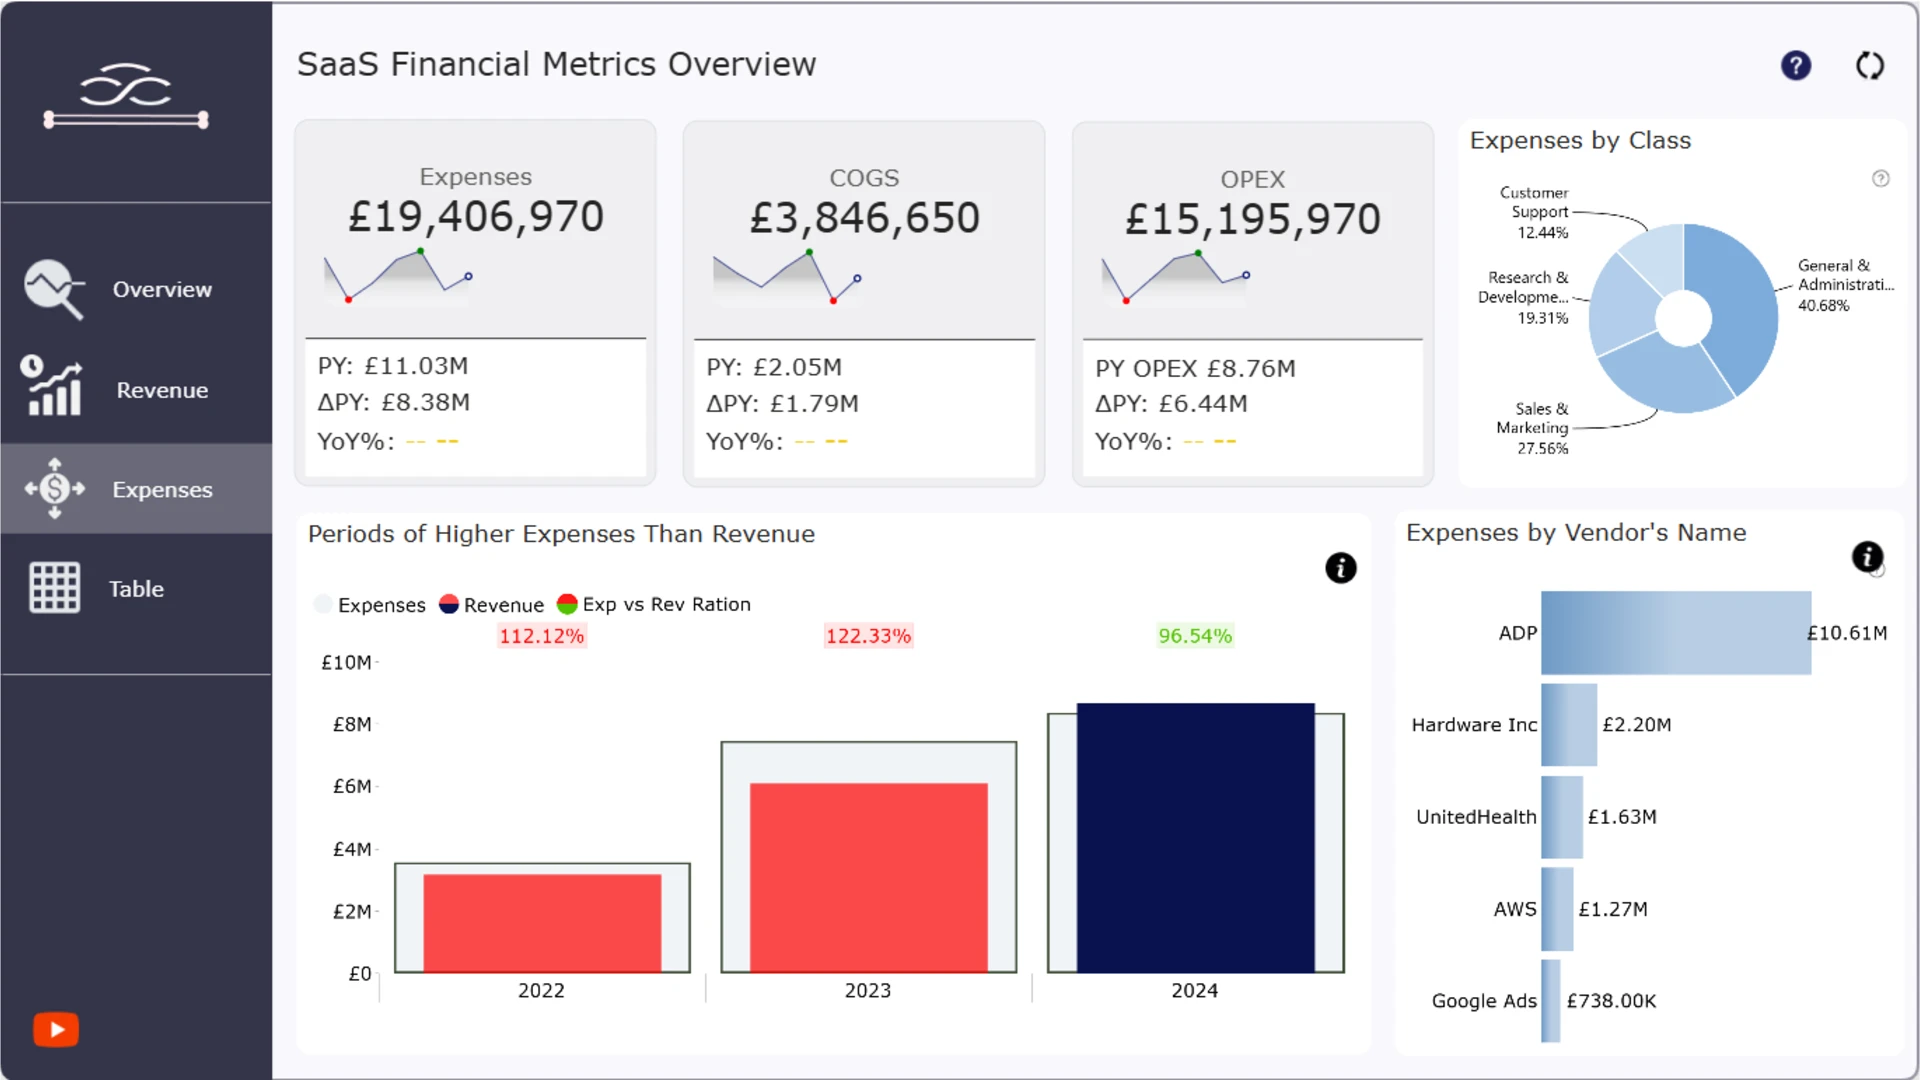
- Analyze expenses vs revenue and identify loss periods
- Track gross profit, net profit, and EBIT trends
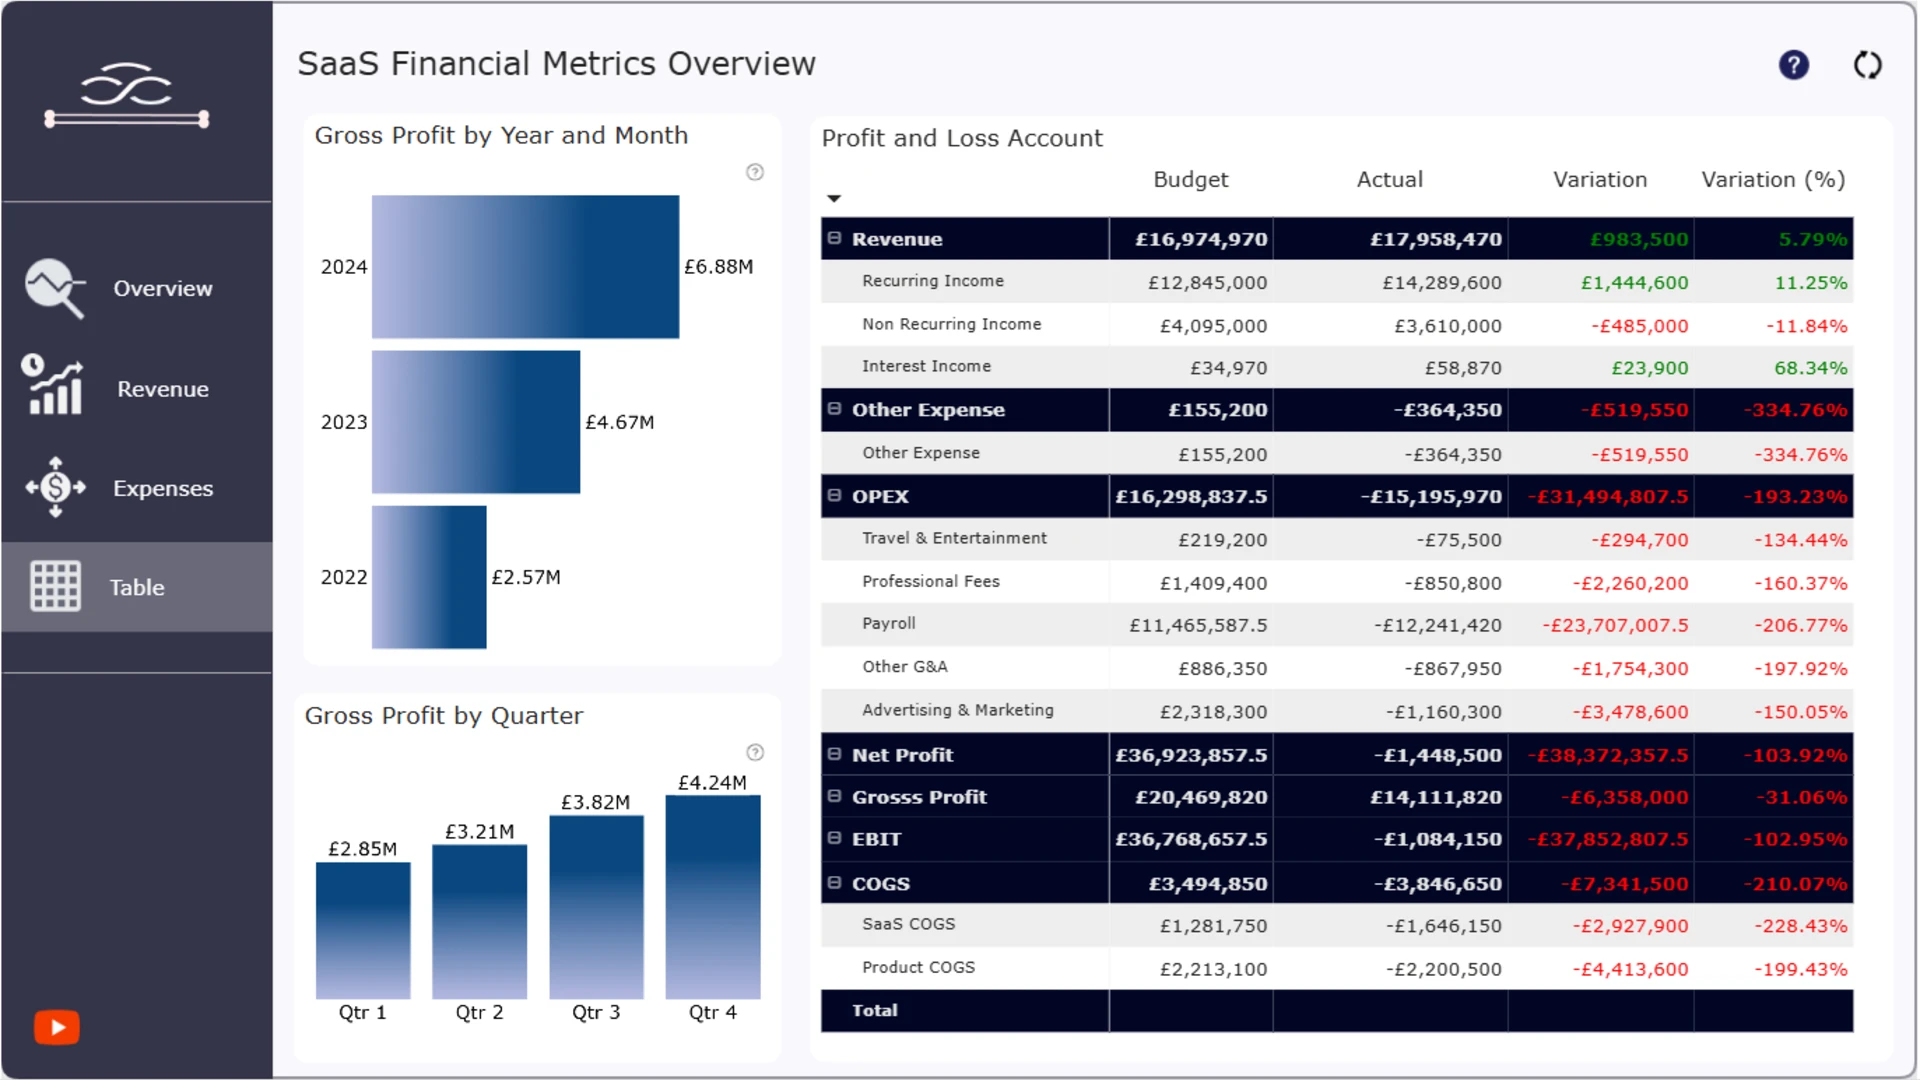
- Compare actuals vs budget with variance analysis
- Understand expense breakdown by category and vendor
- Review profit and loss (P&L) statements interactively
Key pages and metrics included:
- Financial overview dashboard with KPI cards
- Revenue analysis by year, category, and source
- Expense analysis including OPEX and COGS
- Revenue vs expenses comparison over time
- Profit and loss statement (P&L) with budget vs actual
- Gross profit and net profit trends by month and quarter
Interactive Power BI features:
- Drill-down from yearly to monthly financial data
- Cross-filtering across revenue, expenses, and profit visuals
- Zoomable charts for detailed financial trend analysis
- Multi-page navigation for focused financial insights
Who this report is for:
- SaaS founders and CFOs
- Finance and FP&A teams
- Business and financial analysts
- Power BI developers building financial dashboards
This Power BI financial report template is fully customizable in Power BI Desktop and can be adapted to your own SaaS financial data model, chart of accounts, and KPIs.
Report submitted for the FP20 Analytics ZoomCharts Challenge, May 2025. The report was built using the Financial Statements dataset Analysis Dataset and includes ZoomCharts custom Drill Down PRO visuals for Power BI.
ZoomCharts visuals used
4U Report Challenges
Participate in data challenges, build and submit reports to get free template downloads.
Join CommunityMobile view allows you to interact with the report. To Download the template please switch to desktop view.


Was this helpful? Thank you for your feedback!
Sorry about that.
How can we improve it?