43453
Power BI Banking Transactions Report
Power BI Banking Transactions Report
More Report pages
Report Author: Kaung Set
43453
Share template with others
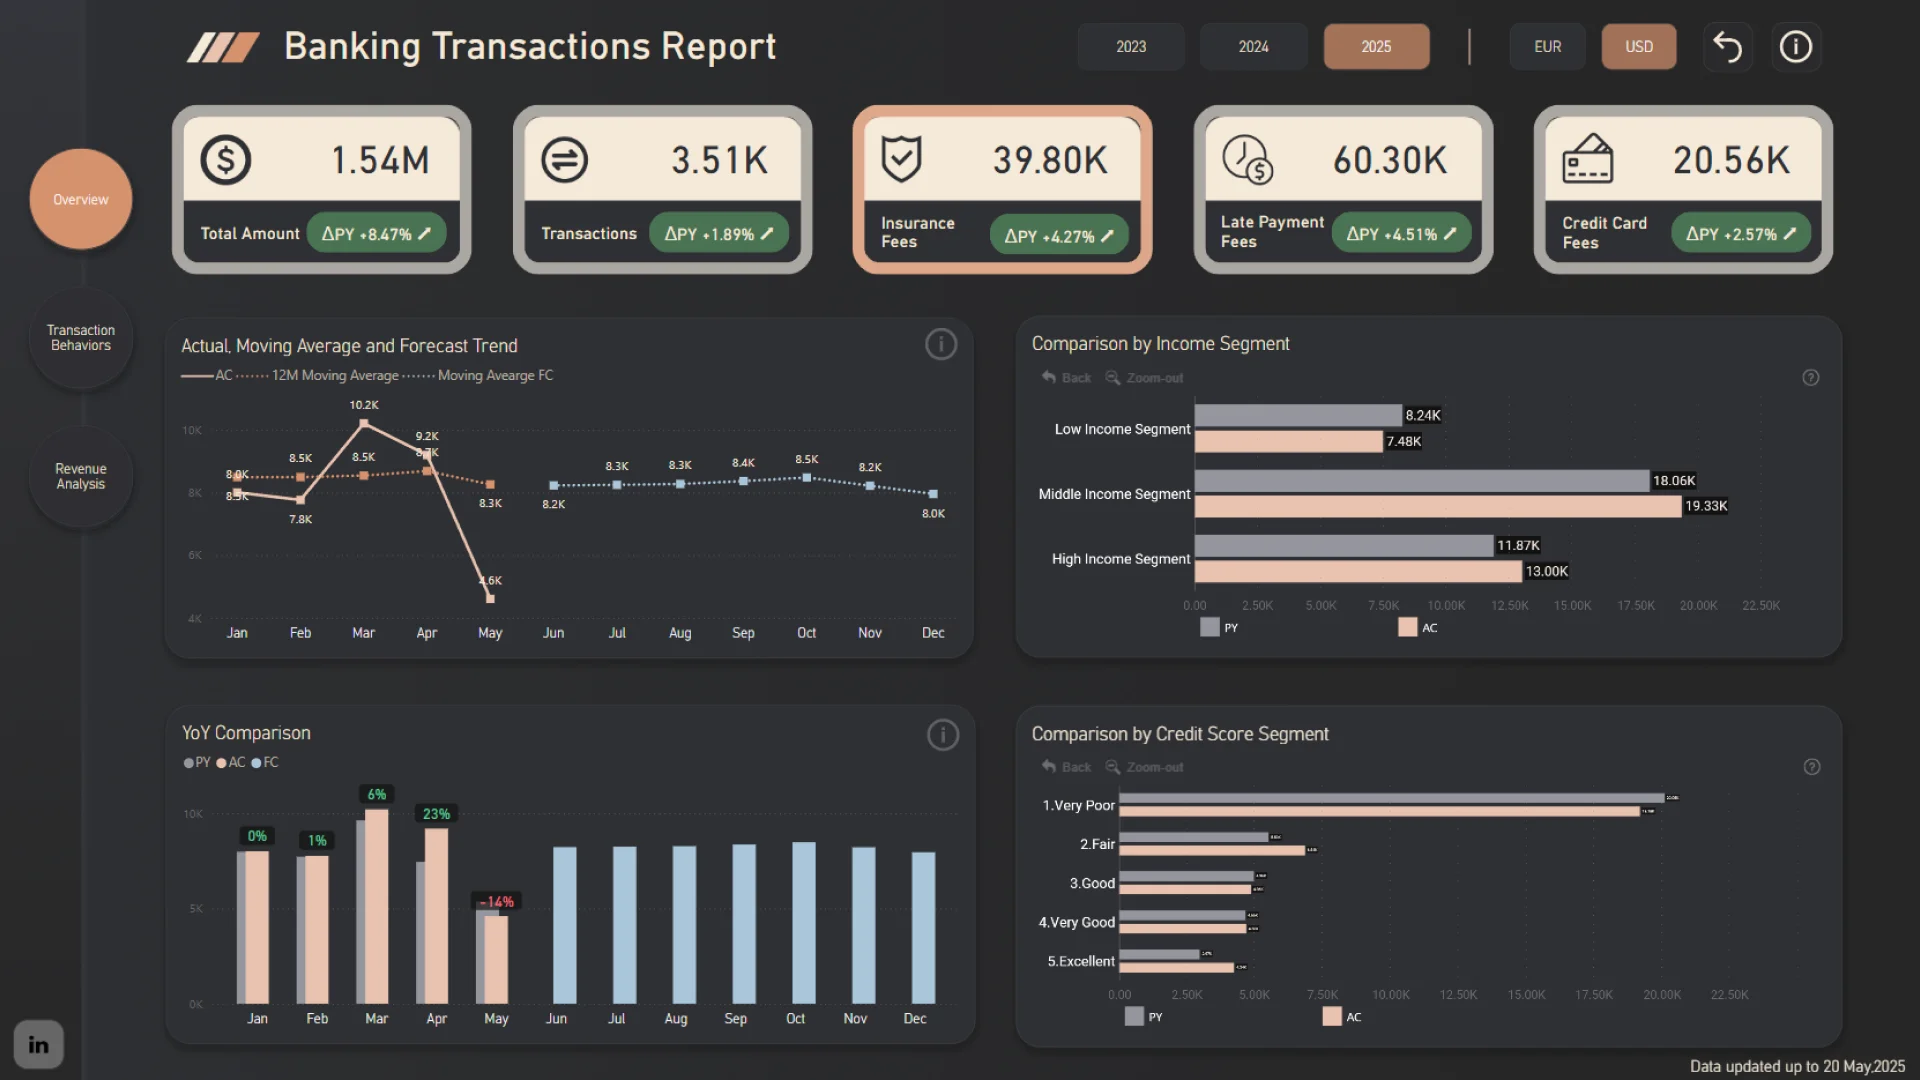
This Power BI banking transactions report template helps banks, financial analysts, and operations teams analyze transaction volumes, customer behavior, fees, and revenue performance in a single interactive dashboard.
Designed for banking analytics and financial reporting, the report provides clear visibility into total transaction amounts, number of transactions, customer growth, insurance fees, late payment fees, and credit card fees, with year-over-year comparisons and trend analysis.
Use this Power BI banking dashboard to:
- Monitor banking transaction volumes and values
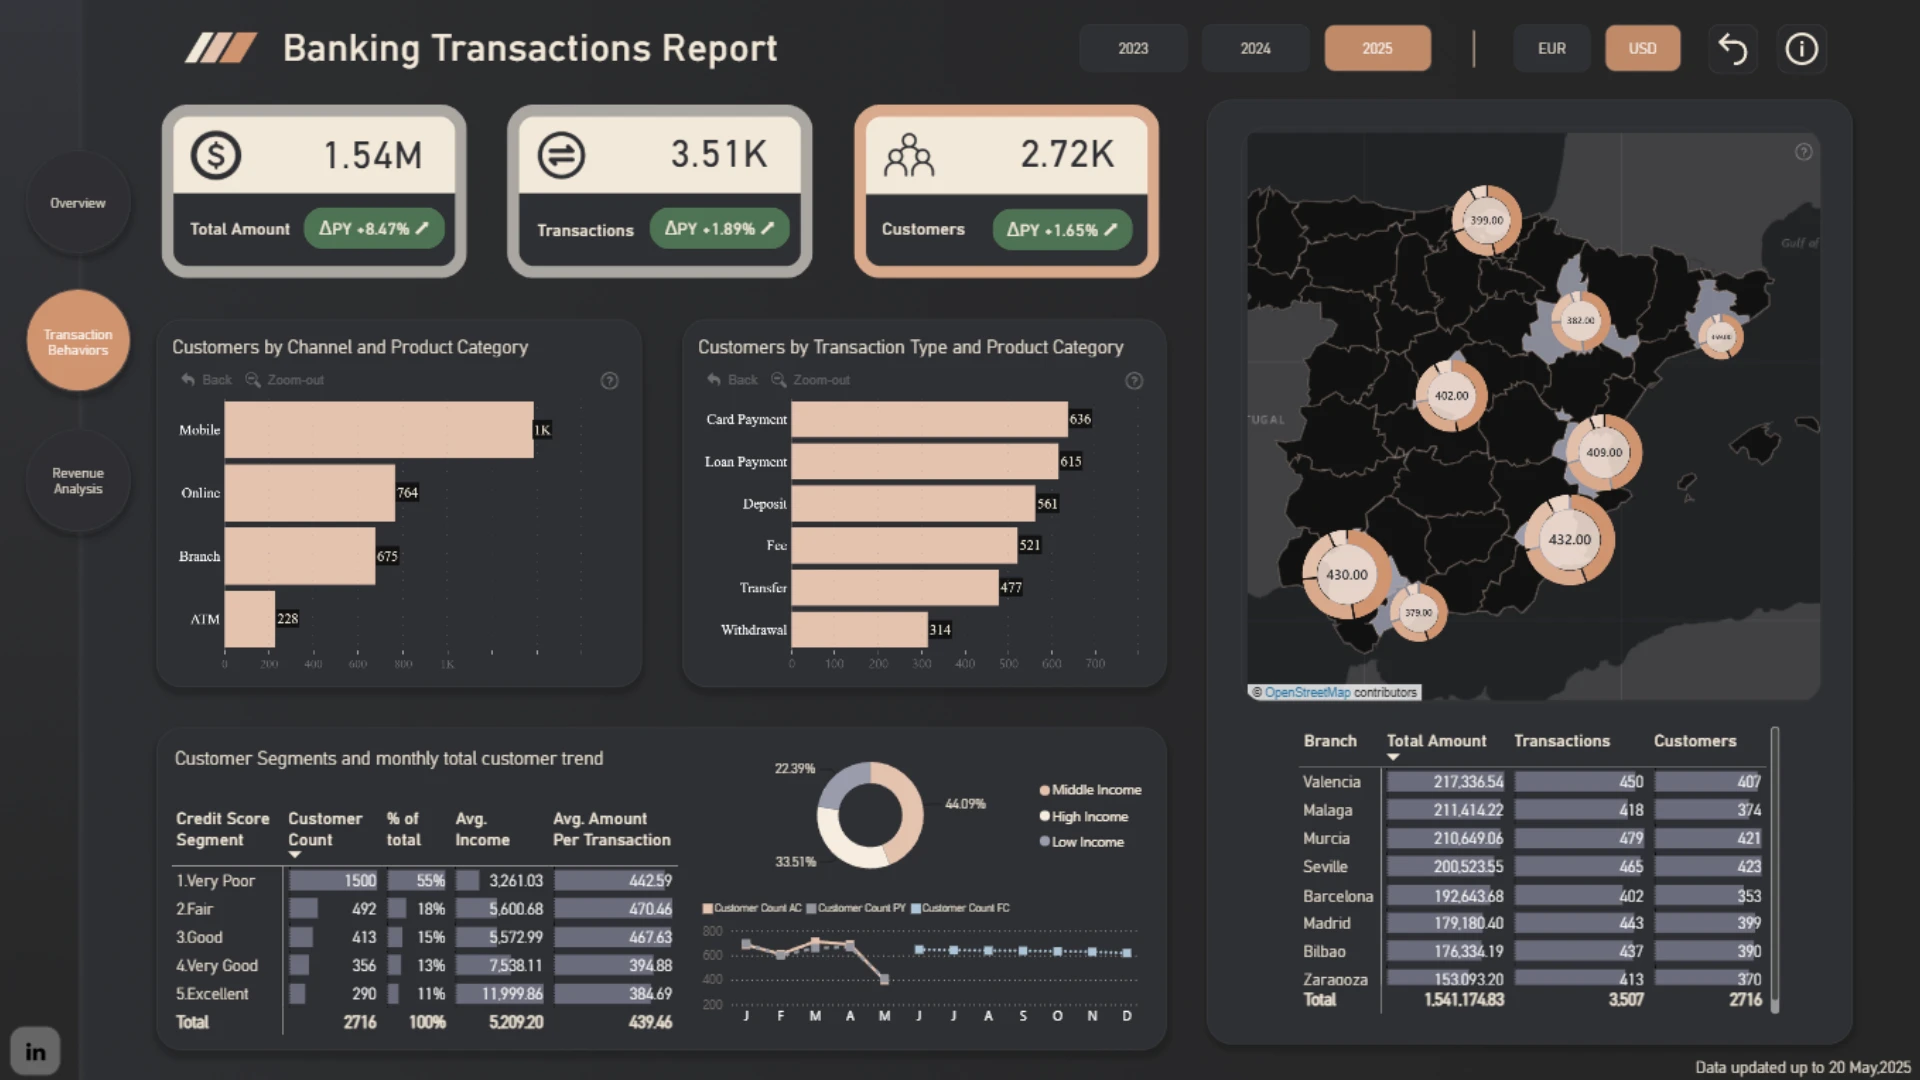
- Analyze customer behavior by channel and product
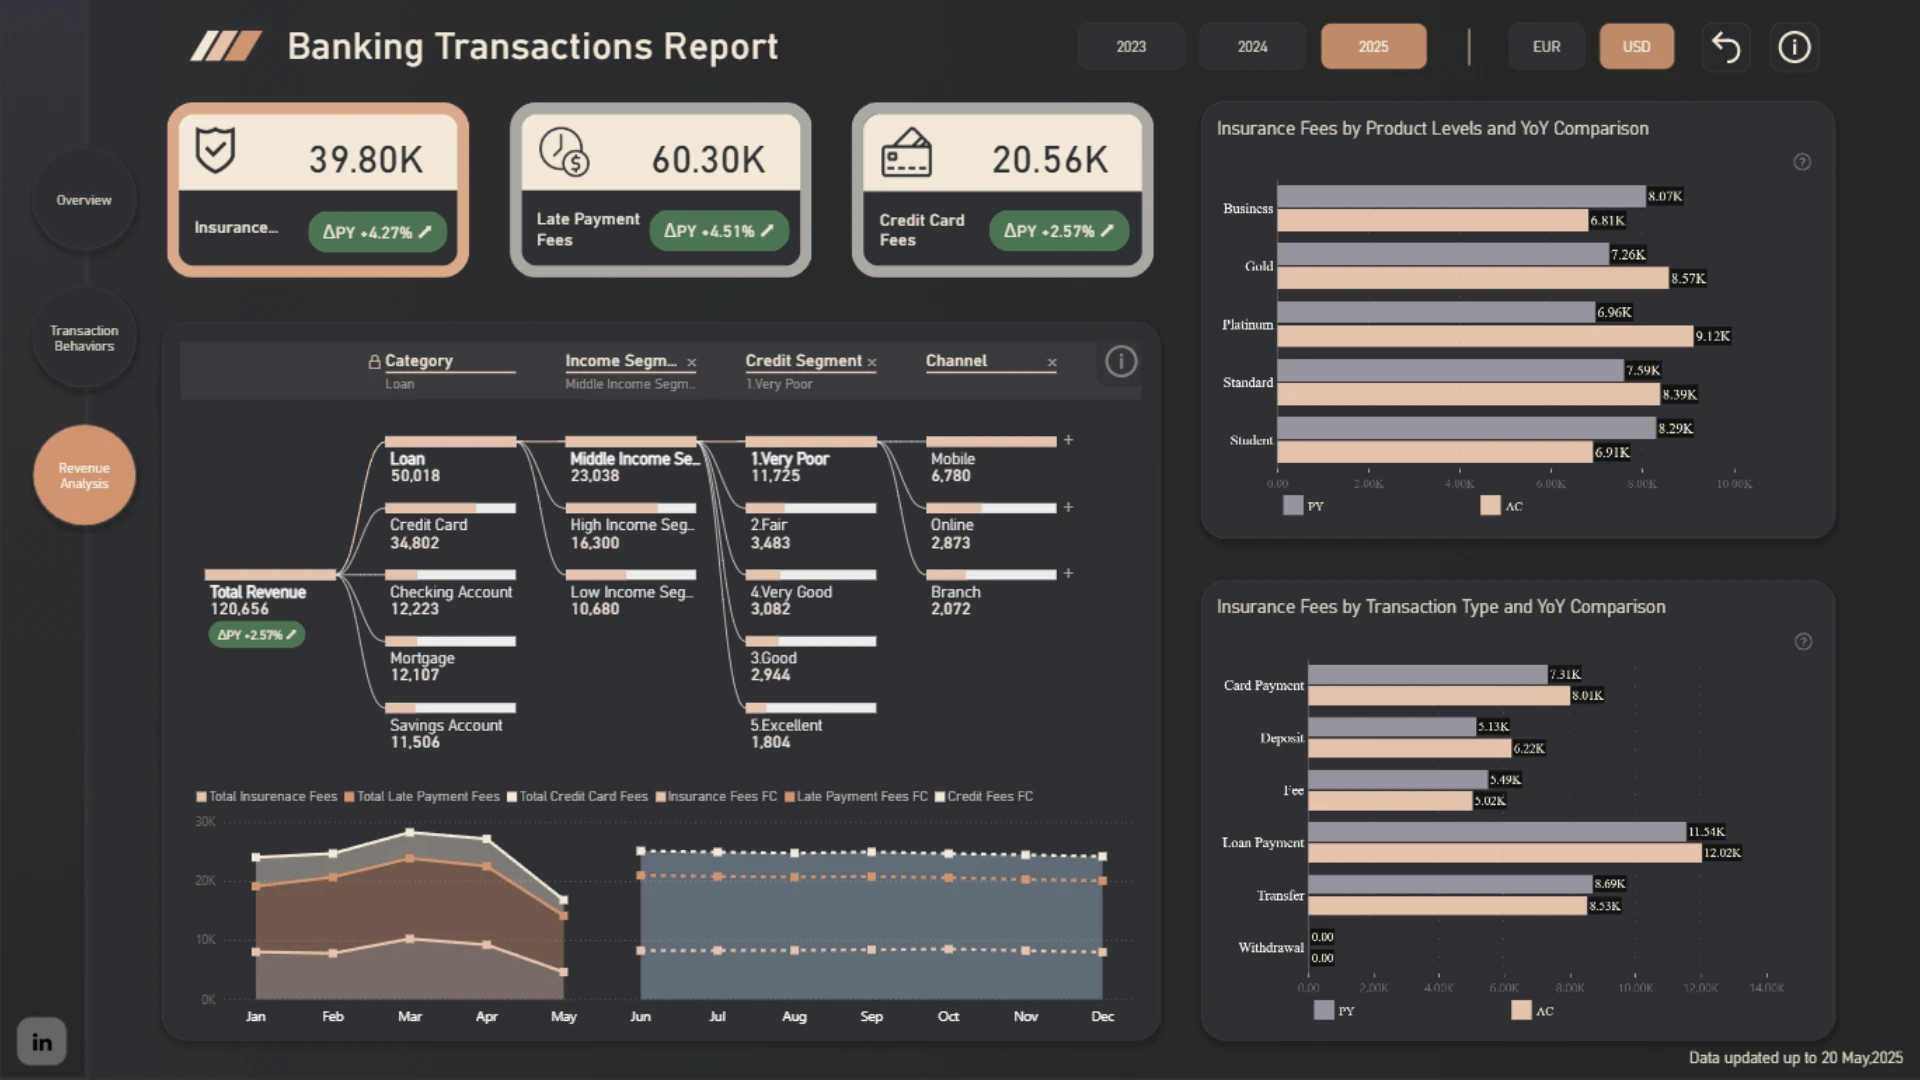
- Track fees, revenue streams, and growth trends
- Compare actual vs previous year performance
- Segment customers by income level and credit score
- Identify high-performing branches and regions
Key pages and insights included:
- Banking transactions overview with KPI cards
- Transaction behavior analysis by channel and product
- Customer segmentation by income and credit score
- Revenue and fee analysis with YoY comparison
- Branch-level performance with geographic distribution
- Monthly trends and forecasts for transactions and revenue
Core banking KPIs:
- Total transaction amount
- Number of transactions and customers
- Insurance, credit card, and late payment fees
- Average transaction value
- Customer growth and segment distribution
- Revenue trends and YoY variance
Interactive Power BI features:
- Drill-down across transaction types and customer segments
- Cross-filtering between KPIs, charts, and maps
- Time-based filtering by year and currency
- Zoomable visuals for detailed financial analysis
Who this report is for:
- Banks and financial institutions
- Retail and commercial banking teams
- Financial and business analysts
- Operations and revenue managers
- Power BI developers building banking dashboards
This Power BI banking transactions dashboard template is fully customizable in Power BI Desktop and can be adapted to your core banking data model, transaction systems, and reporting KPIs.
Report submitted for the FP20 Analytics ZoomCharts Challenge, June 2025. The report was built using the Banking Customers & Transactions Dataset and includes ZoomCharts custom Drill Down PRO visuals for Power BI.
4U Report Challenges
Participate in data challenges, build and submit reports to get free template downloads.
Join CommunityMobile view allows you to interact with the report. To Download the template please switch to desktop view.


Was this helpful? Thank you for your feedback!
Sorry about that.
How can we improve it?