1023
Mobile Game Analysis 7
Mobile Game Analysis 7
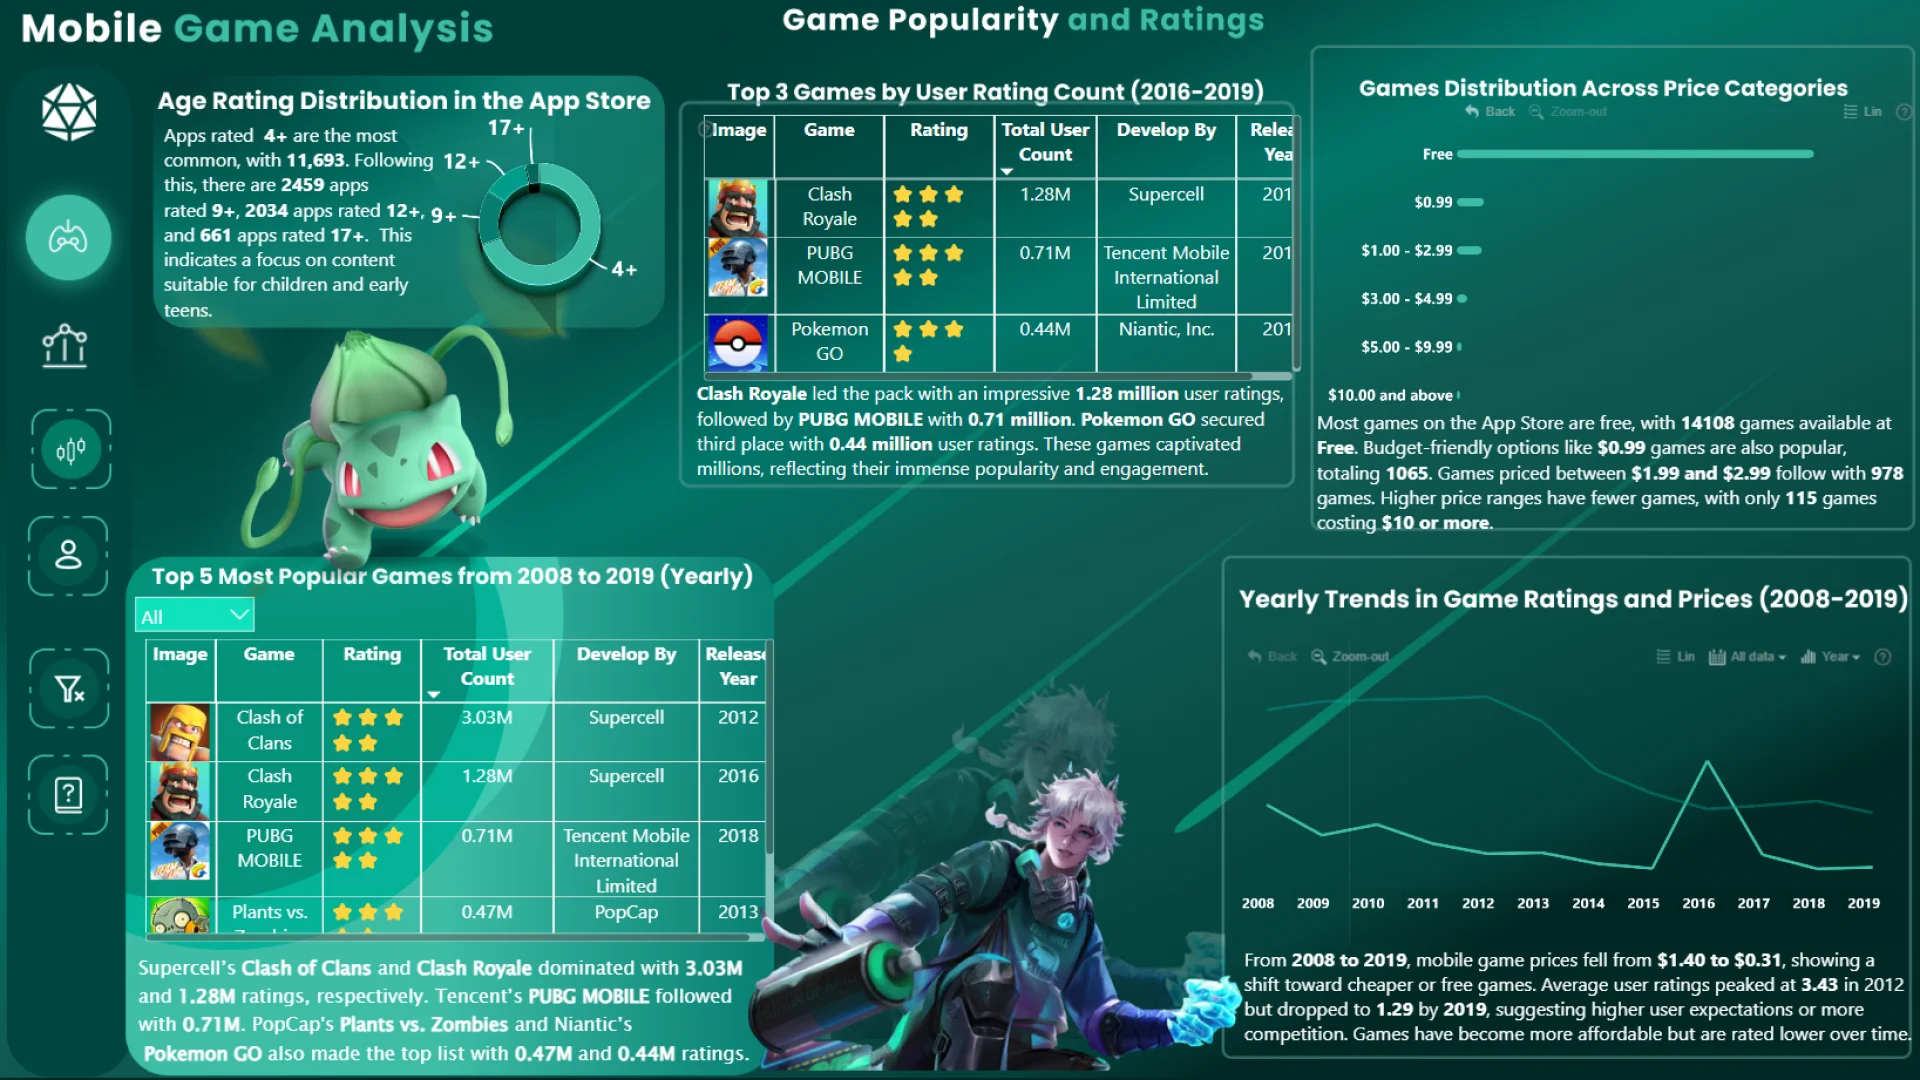
Report Author: Rakshit Bhadoria
1023
Share template with others
Report submitted for FP20 Analytics ZoomCharts Challenge 18 (August 2024). The report was built with the Mobile Game Analysis dataset and includes ZoomCharts custom Drill Down PRO visuals for Power BI.
Author's description:
I've just completed an in-depth analysis of mobile games from the Apple App Store, spanning the years 2008 to 2019.
📊 Key Insights from My Dashboard:
🔥 Top Games Revealed: Discover which games topped the charts each year and what made them so popular!
🎯 Developer Success: Find out which developers consistently delivered high-quality games with stellar ratings.
💡 Price vs. Size: Uncover intriguing patterns between game size and pricing across various genres.
🌍 Global Reach: Learn which languages dominated the mobile gaming scene and how genre trends evolved every three years.
💰 Monetization Strategies: Get insights into the most successful pricing strategies and genres for new developers entering the market.



4U Report Challenges
Participate in data challenges, build and submit reports to get free template downloads.
Join CommunityMobile view allows you to interact with the report. To Download the template please switch to desktop view.
How to use a PBIX template
Preview the interactive report, download the PBIX file, open it in Power BI Desktop, and replace the same data connection with your own dataset.
Preview and download
Explore the report online and download the PBIX template file.
Open in Power BI Desktop
Open the downloaded PBIX file in Power BI Desktop.
Connect your data
Replace the sample data source with your own dataset.
Refresh and adjust
Refresh the model and update fields or visual were needed.
Save and share
Save your report and publish it for your audience.


