909
Holiday Campaign Performance – Power BI 5
Holiday Campaign Performance – Power BI 5
Report Author: Karolina Grzybek
909
Share template with others
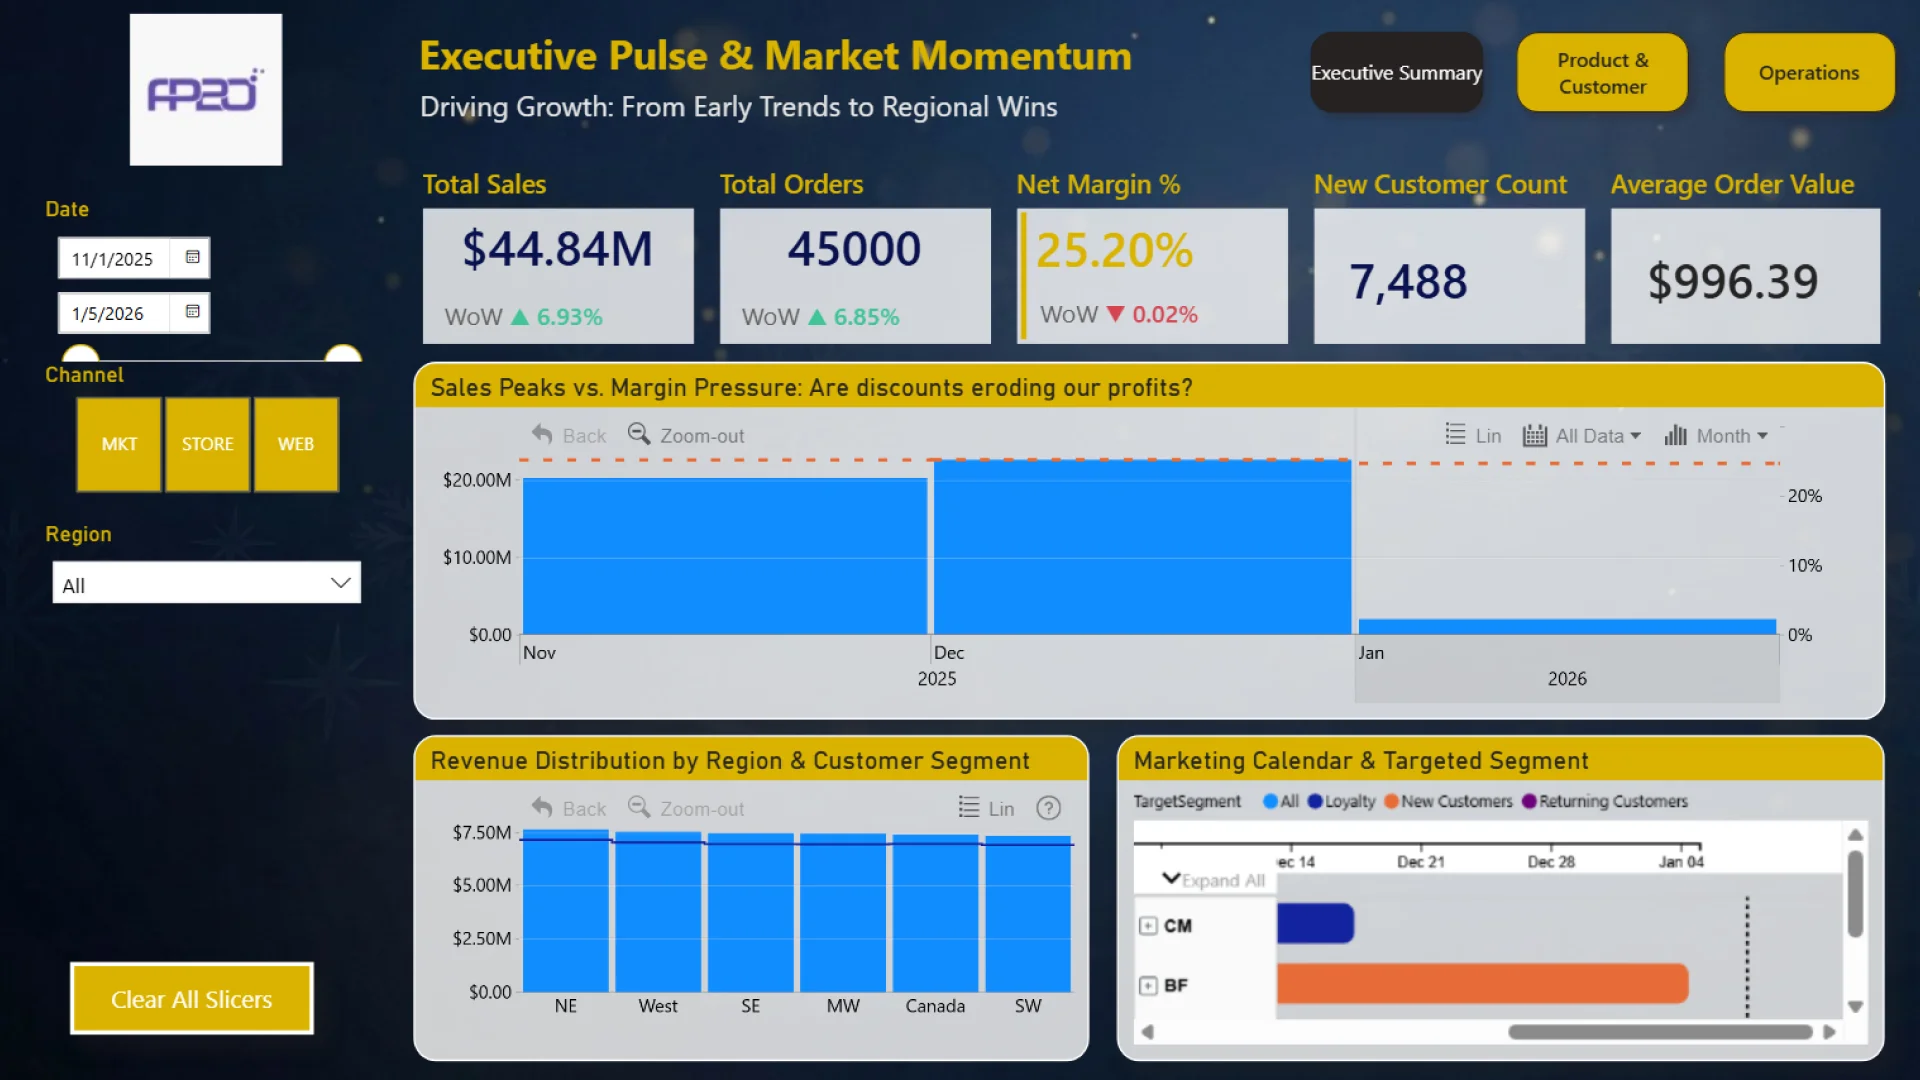
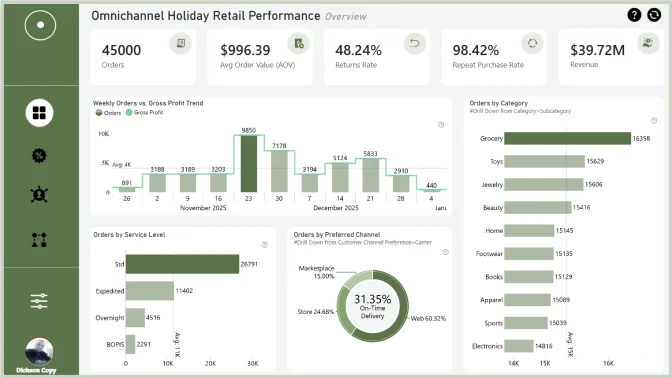
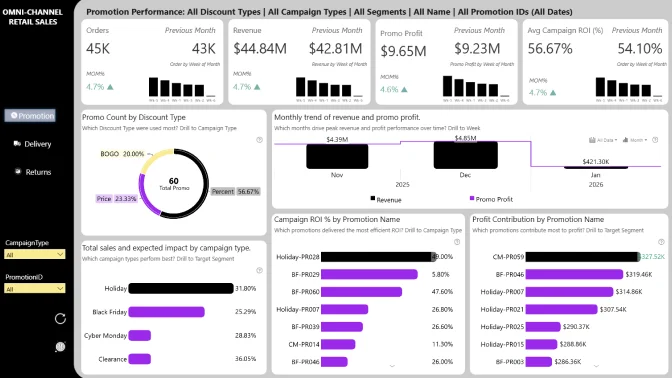
This Power BI report is built using the Omnichannel Holiday Retail Sales dataset and features ZoomCharts Drill Down PRO custom visuals for Power BI. It was submitted to the FP20 Analytics ZoomCharts Data Challenge #33 (December 2025 – January 2026).
Author's Description:
This report is designed to monitor the health of the Holiday Sales Season across three critical pillars: Revenue Growth, Profitability, and Operational Efficiency. It enables stakeholders to: 1. Monitor Momentum: Instantly assess weekly performance trends and marketing campaign efficiency across Online and Store channels. 2. Protect Margins: Identify campaign with high level of discounts and low margins to adjust promotional strategies in real time. 3. Fix bottlenecks: Pinpoint specific warehouse and carriers causing delivery delays to improve customers experience and BOPIS reliability.
ZoomCharts visuals used
4U Report Challenges
Participate in data challenges, build and submit reports to get free template downloads.
Join CommunityMobile view allows you to interact with the report. To Download the template please switch to desktop view.

Was this helpful? Thank you for your feedback!
Sorry about that.
How can we improve it?