831
Marketing Dashboard Power BI Example for Email Campaigns
Marketing Dashboard Power BI Example for Email Campaigns
More Report pages
Report Author: Venugopal Varma Balraju
831
Share template with others
Summary
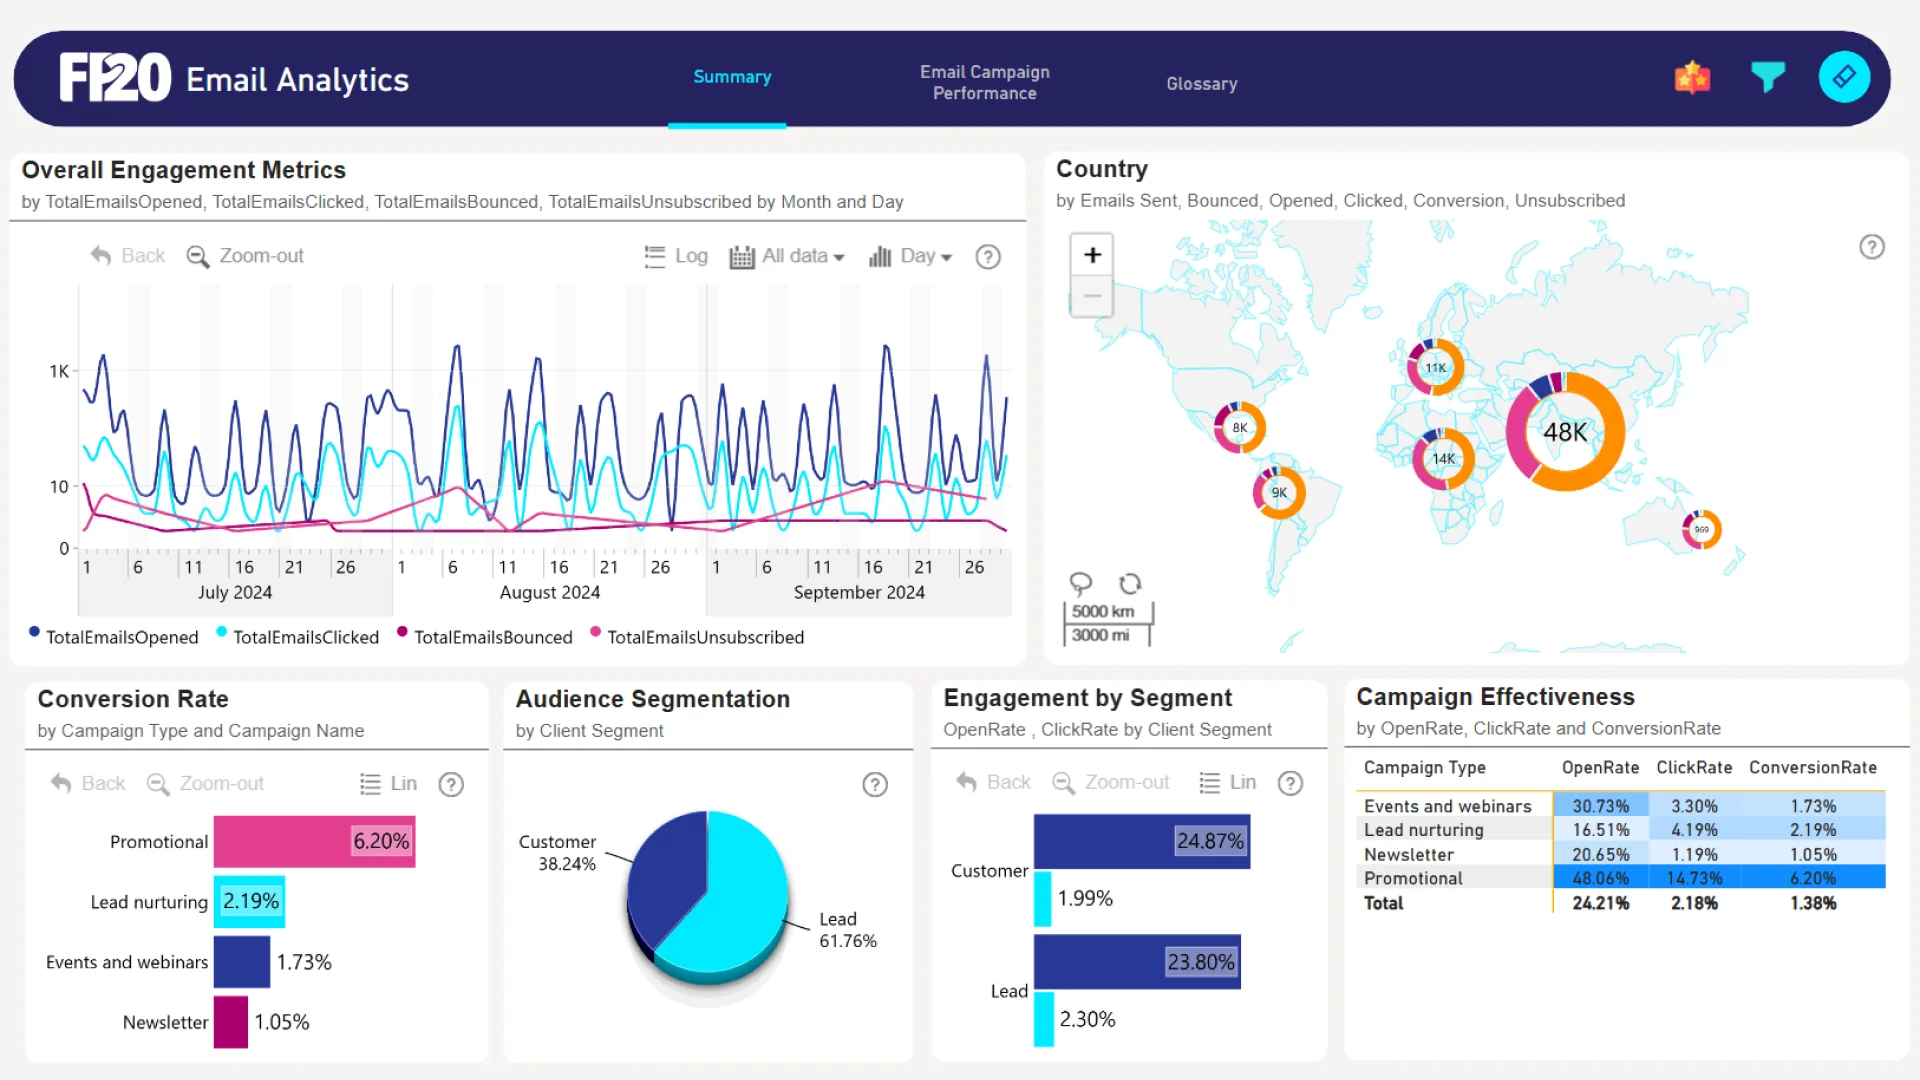
This marketing dashboard Power BI example was submitted for the FP20 Analytics ZoomCharts Challenge in October 2024. The report was built using the Marketing Email Campaign Performance dataset and includes ZoomCharts custom Drill Down PRO visuals for Power BI.
The dashboard analyzes email campaign performance for a niche content platform serving DIY creators and readers worldwide. It covers the past three months of campaign activity, helping users monitor engagement metrics, conversion rates, and audience segmentation in one interactive Power BI marketing dashboard.
Key Insights of Power BI Marketing Dashboard
Email Campaign Engagement Metrics
The report tracks key email marketing metrics including open rate, click rate, bounce rate, unsubscribe rate, and conversion rate. These metrics help users understand how recipients interact with campaigns, where engagement is strongest, and where campaign performance may need improvement.
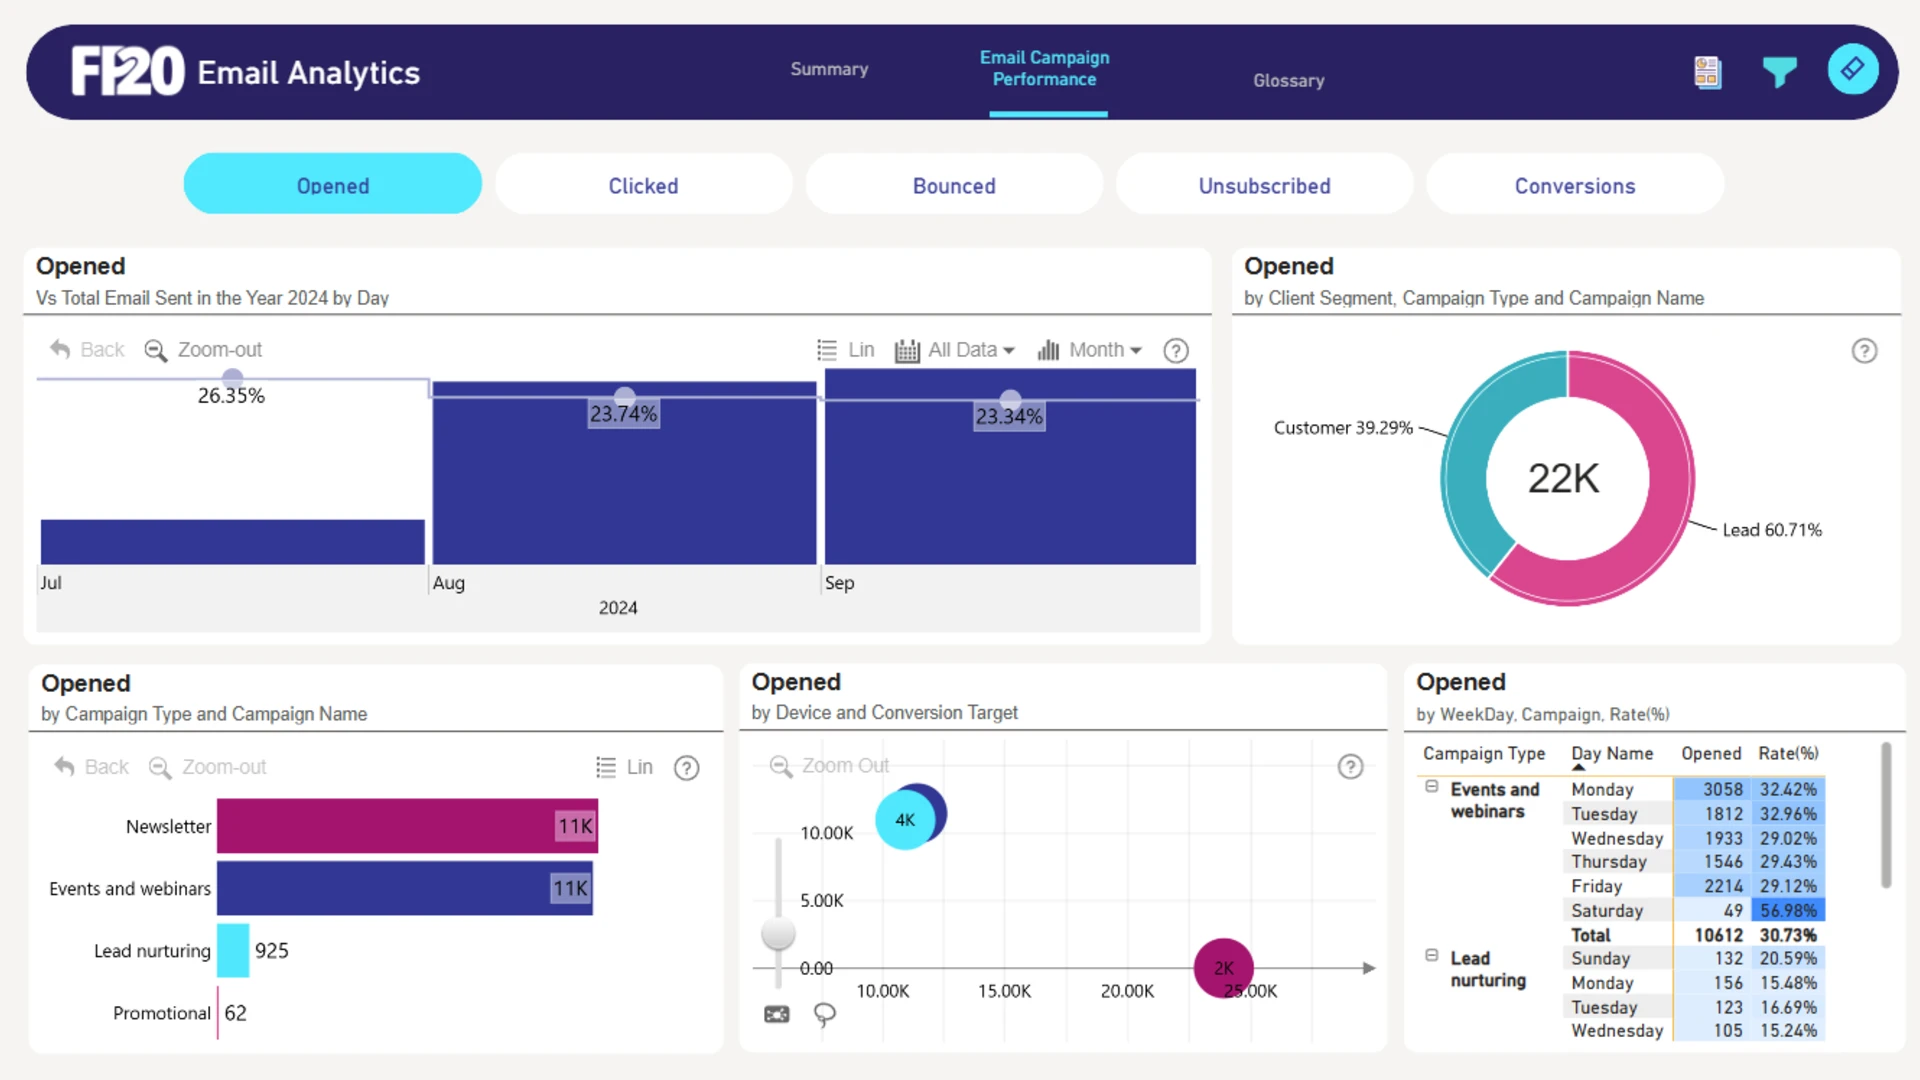
Campaign Performance and Conversion Analysis
The dashboard compares campaign effectiveness across campaign types and campaign names, showing how well emails drive desired actions such as purchases, sign-ups, and downloads. Scorecards provide a quick overview of performance, while detailed tables allow users to review each campaign more closely.
Audience Segmentation and Visual Filtering
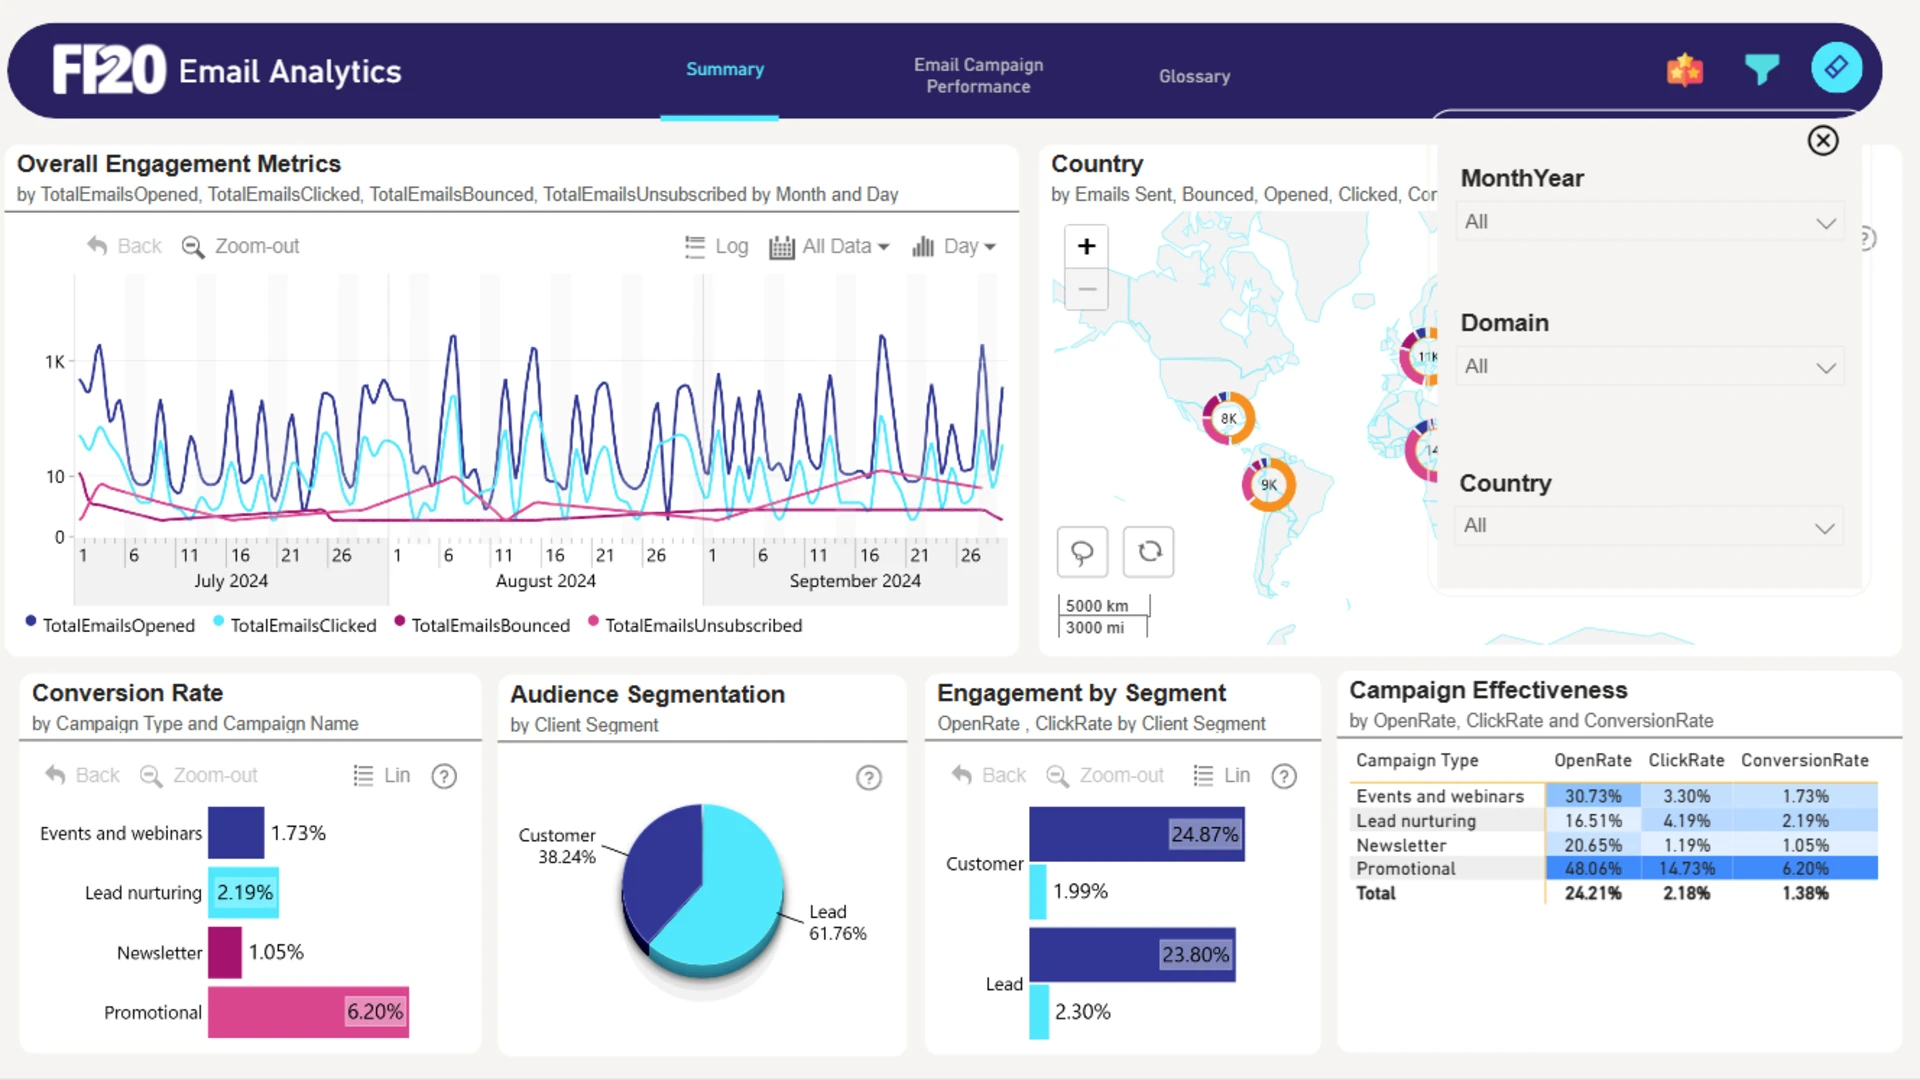
The report separates leads from existing customers, making it easier to compare engagement and conversion behavior across audience groups. Interactive slicers allow users to filter the dashboard by month, domain, and country for deeper analysis of specific campaign segments.
Strategic Marketing Optimization Insights
The dashboard can be used to identify opportunities to improve open and click rates, reduce bounce and unsubscribe rates, increase conversion rates, and enhance audience segmentation. These insights support more targeted campaigns, better send-time decisions, cleaner email lists, and more effective A/B testing.
How to Use This Power BI Marketing Dashboard
To interact with the dashboard, click directly on active chart elements or use the available slicers to filter the report by month, domain, and country. Download the .pbix file to explore the dashboard settings, visuals, formulas, and calculations, or adapt the structure for your own email marketing data.
ZoomCharts visuals used
4U Report Challenges
Participate in data challenges, build and submit reports to get free template downloads.
Join CommunityMobile view allows you to interact with the report. To Download the template please switch to desktop view.


Was this helpful? Thank you for your feedback!
Sorry about that.
How can we improve it?