187
Hospital Patient Flow KPI Dashboard
Hospital Patient Flow KPI Dashboard
More Report pages
Report Author: Jeseena K
187
Share template with others
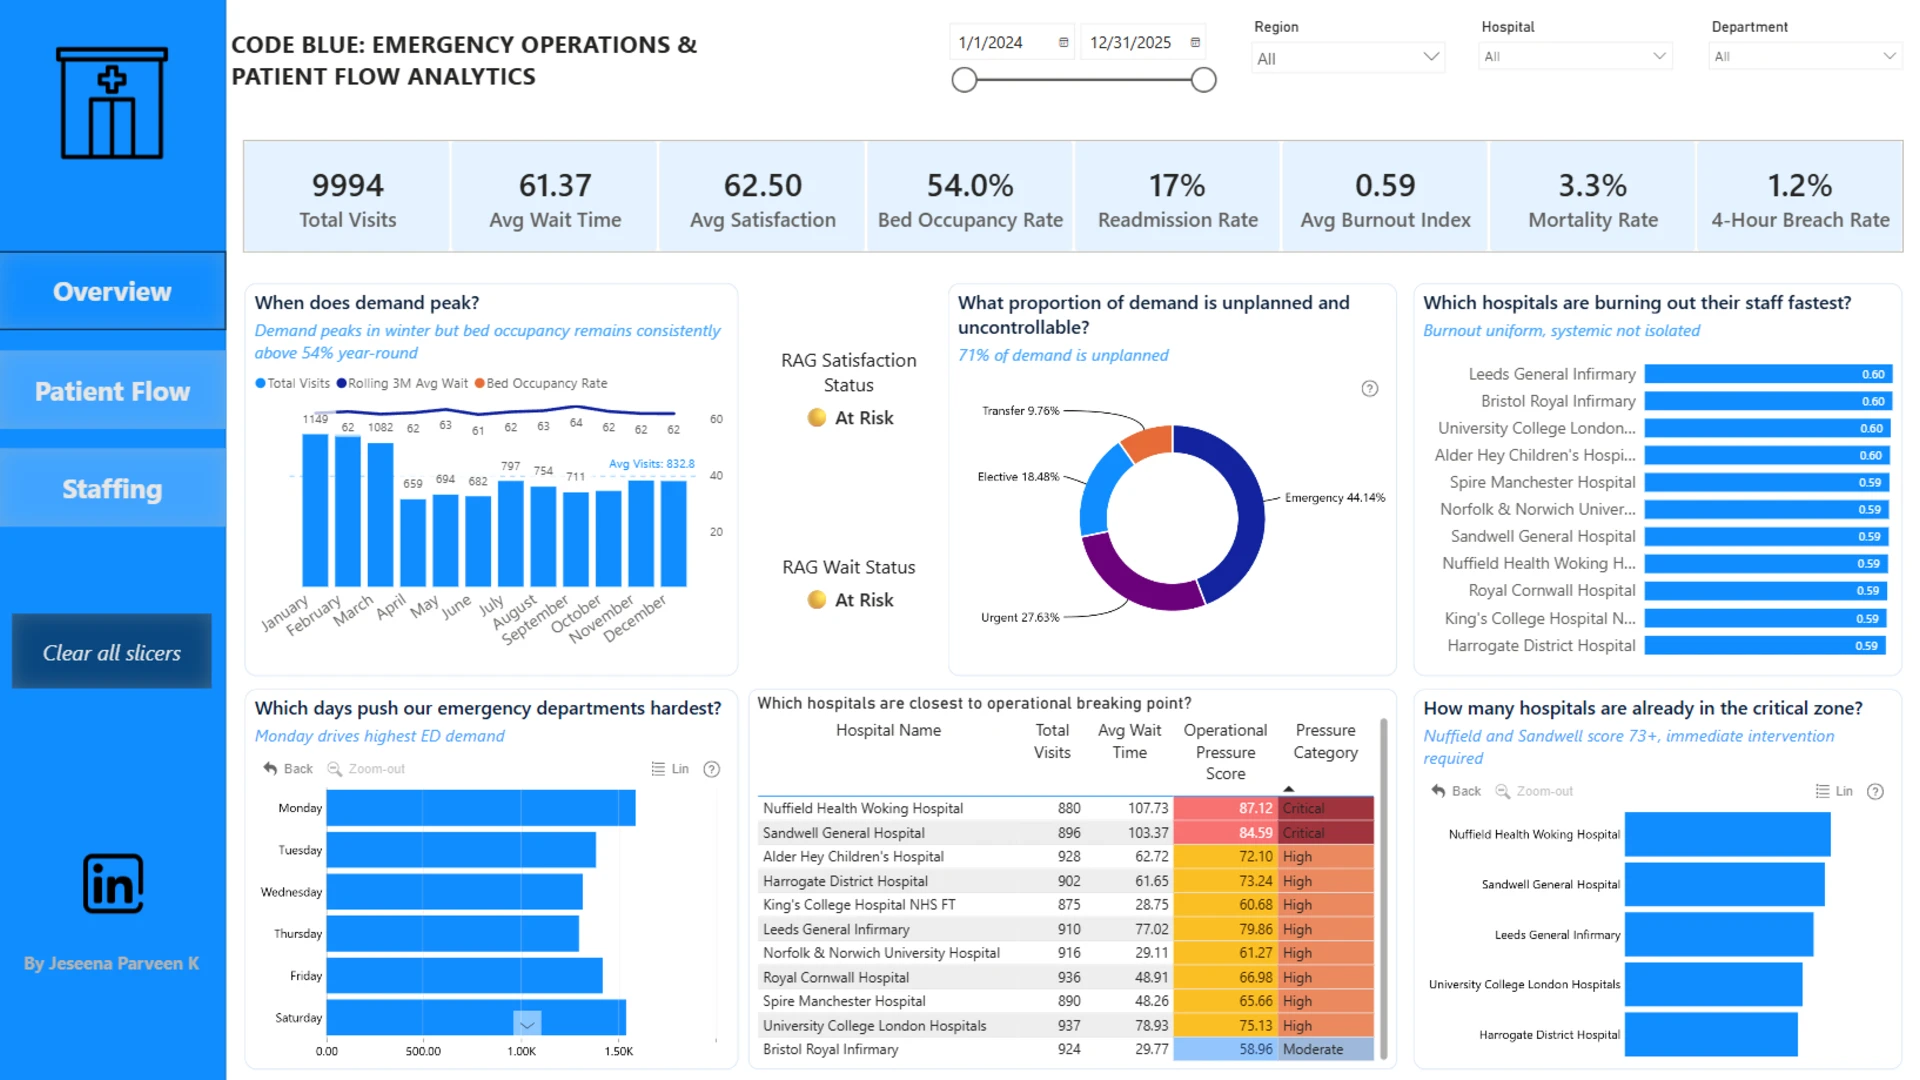
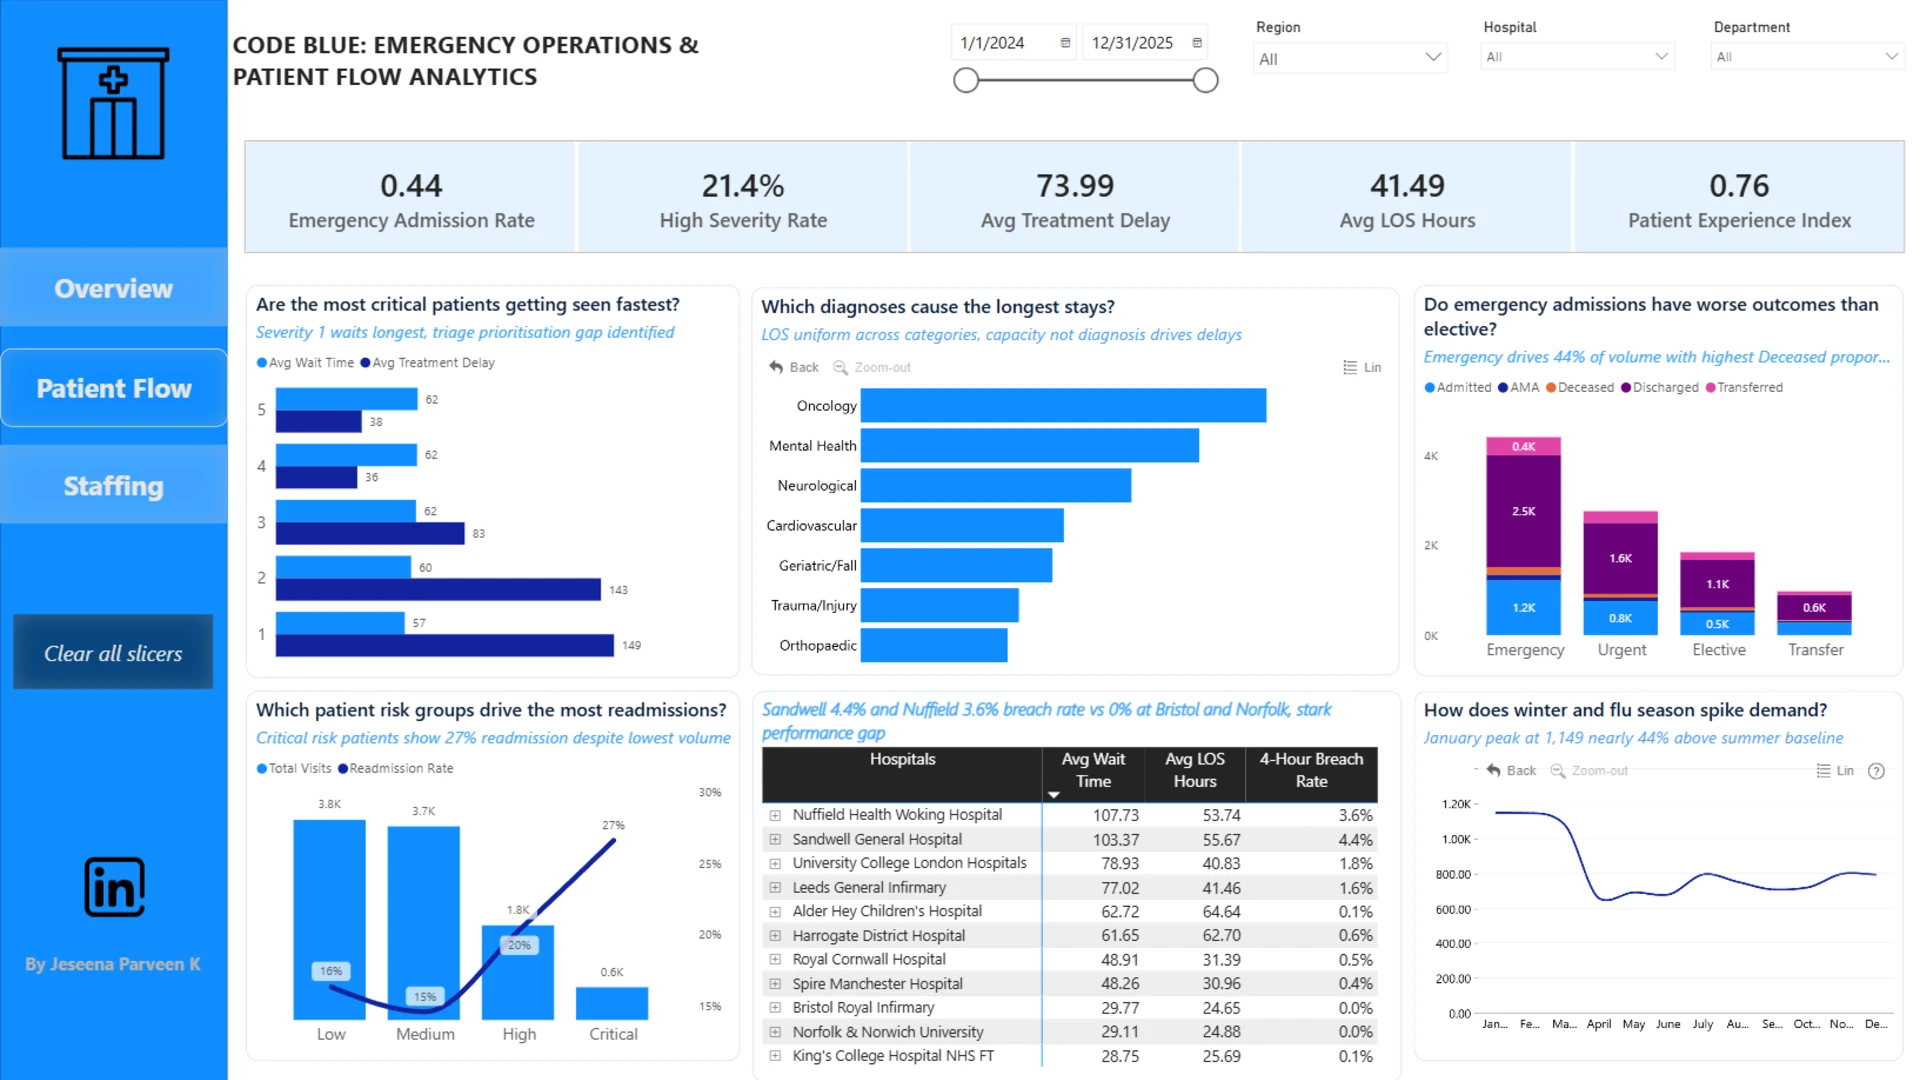
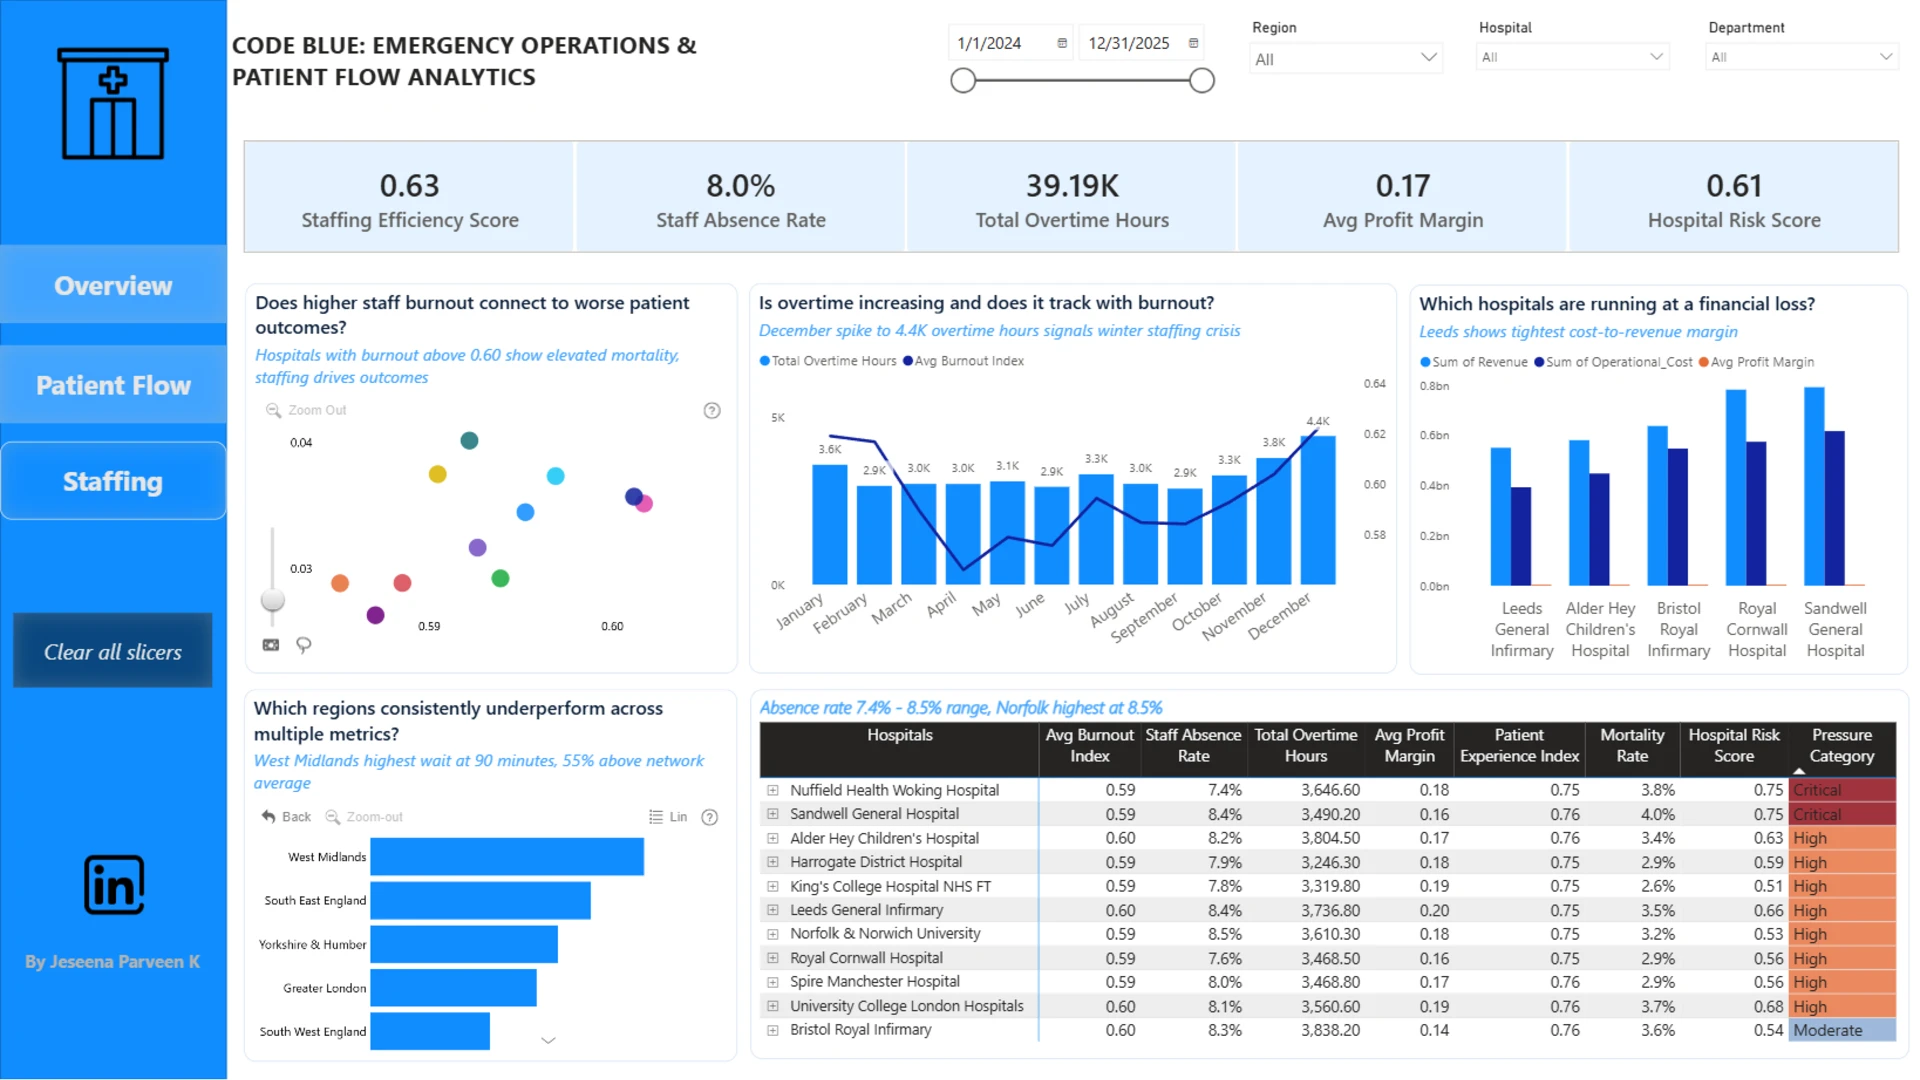
This interactive Power BI report explores the Code Blue Emergency Operations & Patient Flow dataset. It analyzes hospital performance, patient flow, bed capacity, emergency operations, pressure points, risks, inefficiencies, and outcome factors across hospitals and key healthcare segments.
Submitted to the FP20 Analytics ZoomCharts Data Challenge 38: Emergency Operations & Patient Flow Analytics, using native Power BI visuals and ZoomCharts Drill Down PRO custom visuals.
Author’s Description:
This dataset captures emergency operations and patient flow across 11 UK hospitals over 2024–2025, covering 9,994 patient visits across clinical, operational, staffing, and financial dimensions. It enables analysis of how demand patterns, triage efficiency, staff pressure, and patient characteristics drive outcomes across a multi-site healthcare network.
4U Report Challenges
Participate in data challenges, build and submit reports to get free template downloads.
Join CommunityMobile view allows you to interact with the report. To Download the template please switch to desktop view.


Was this helpful? Thank you for your feedback!
Sorry about that.
How can we improve it?