262
Healthcare Emergency Operations Dashboard
Healthcare Emergency Operations Dashboard
More Report pages
Report Author: Pooja Nair
262
Share template with others
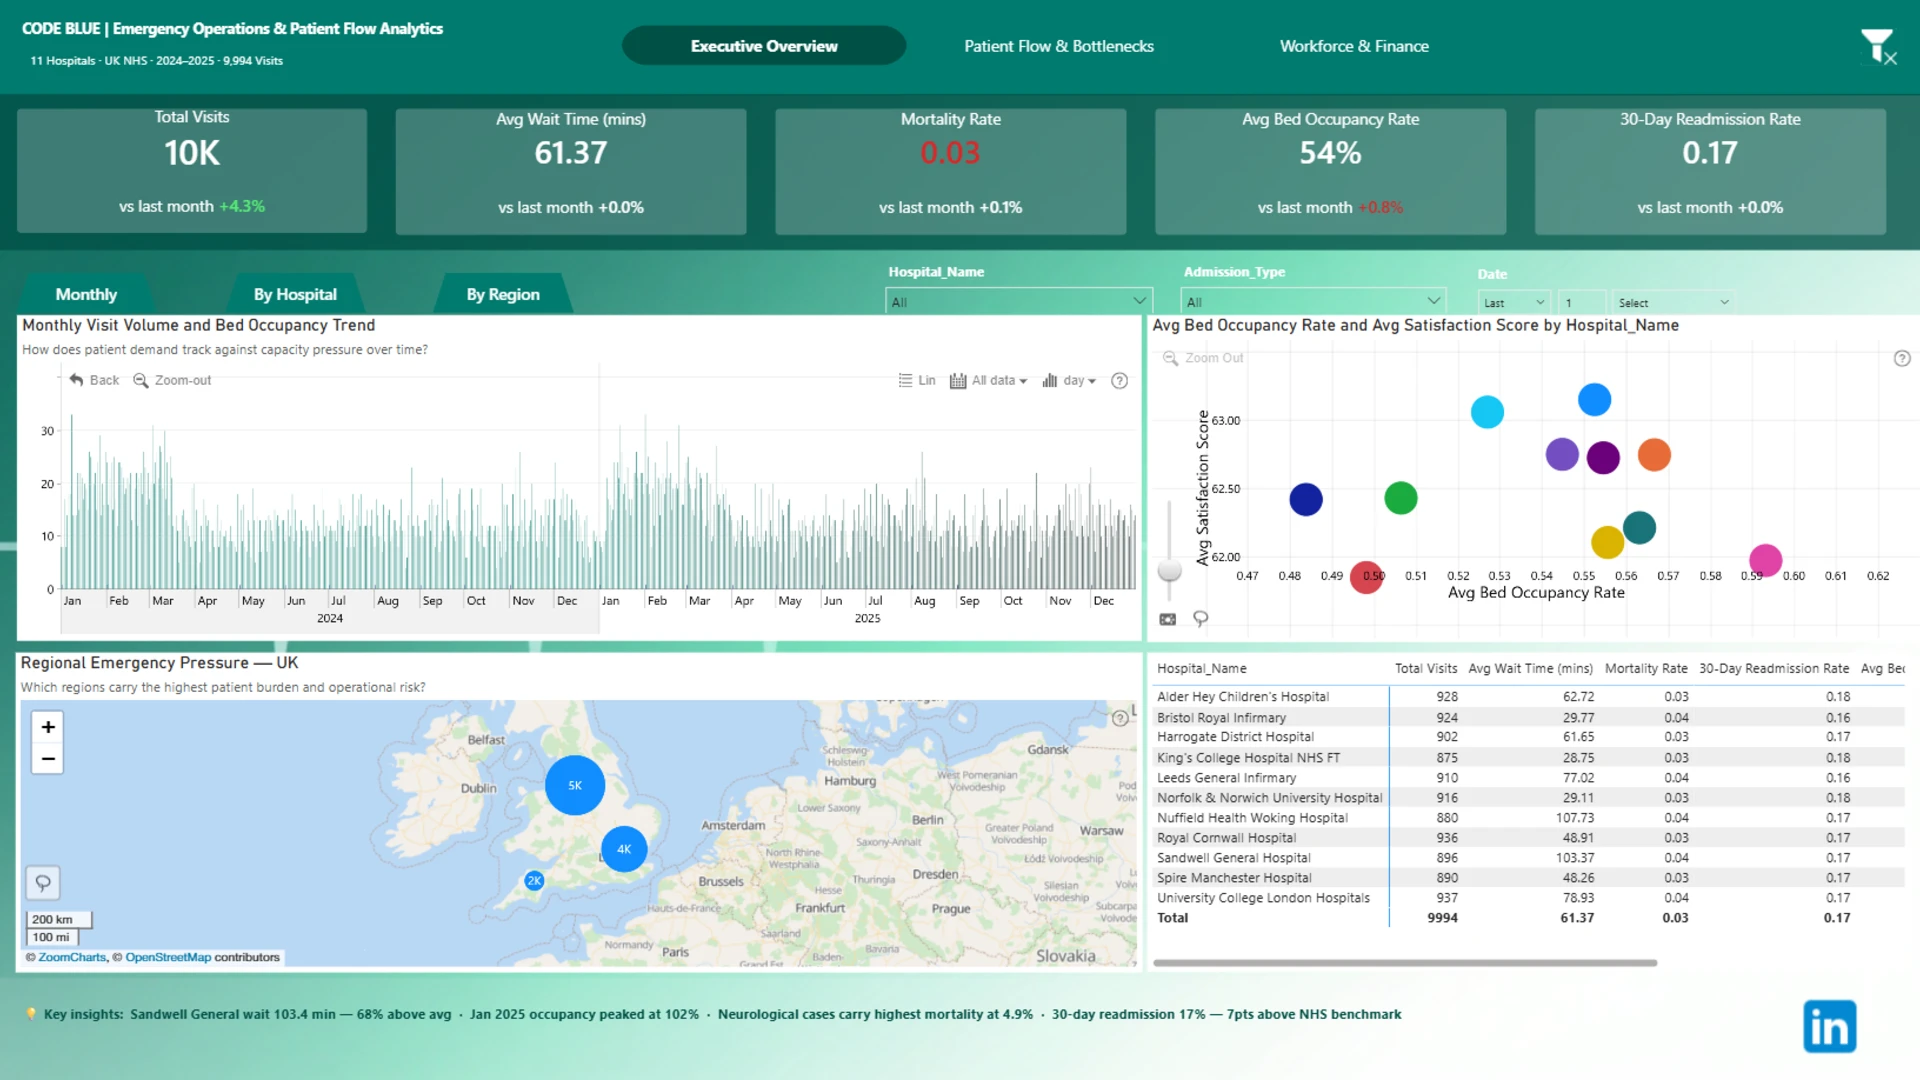
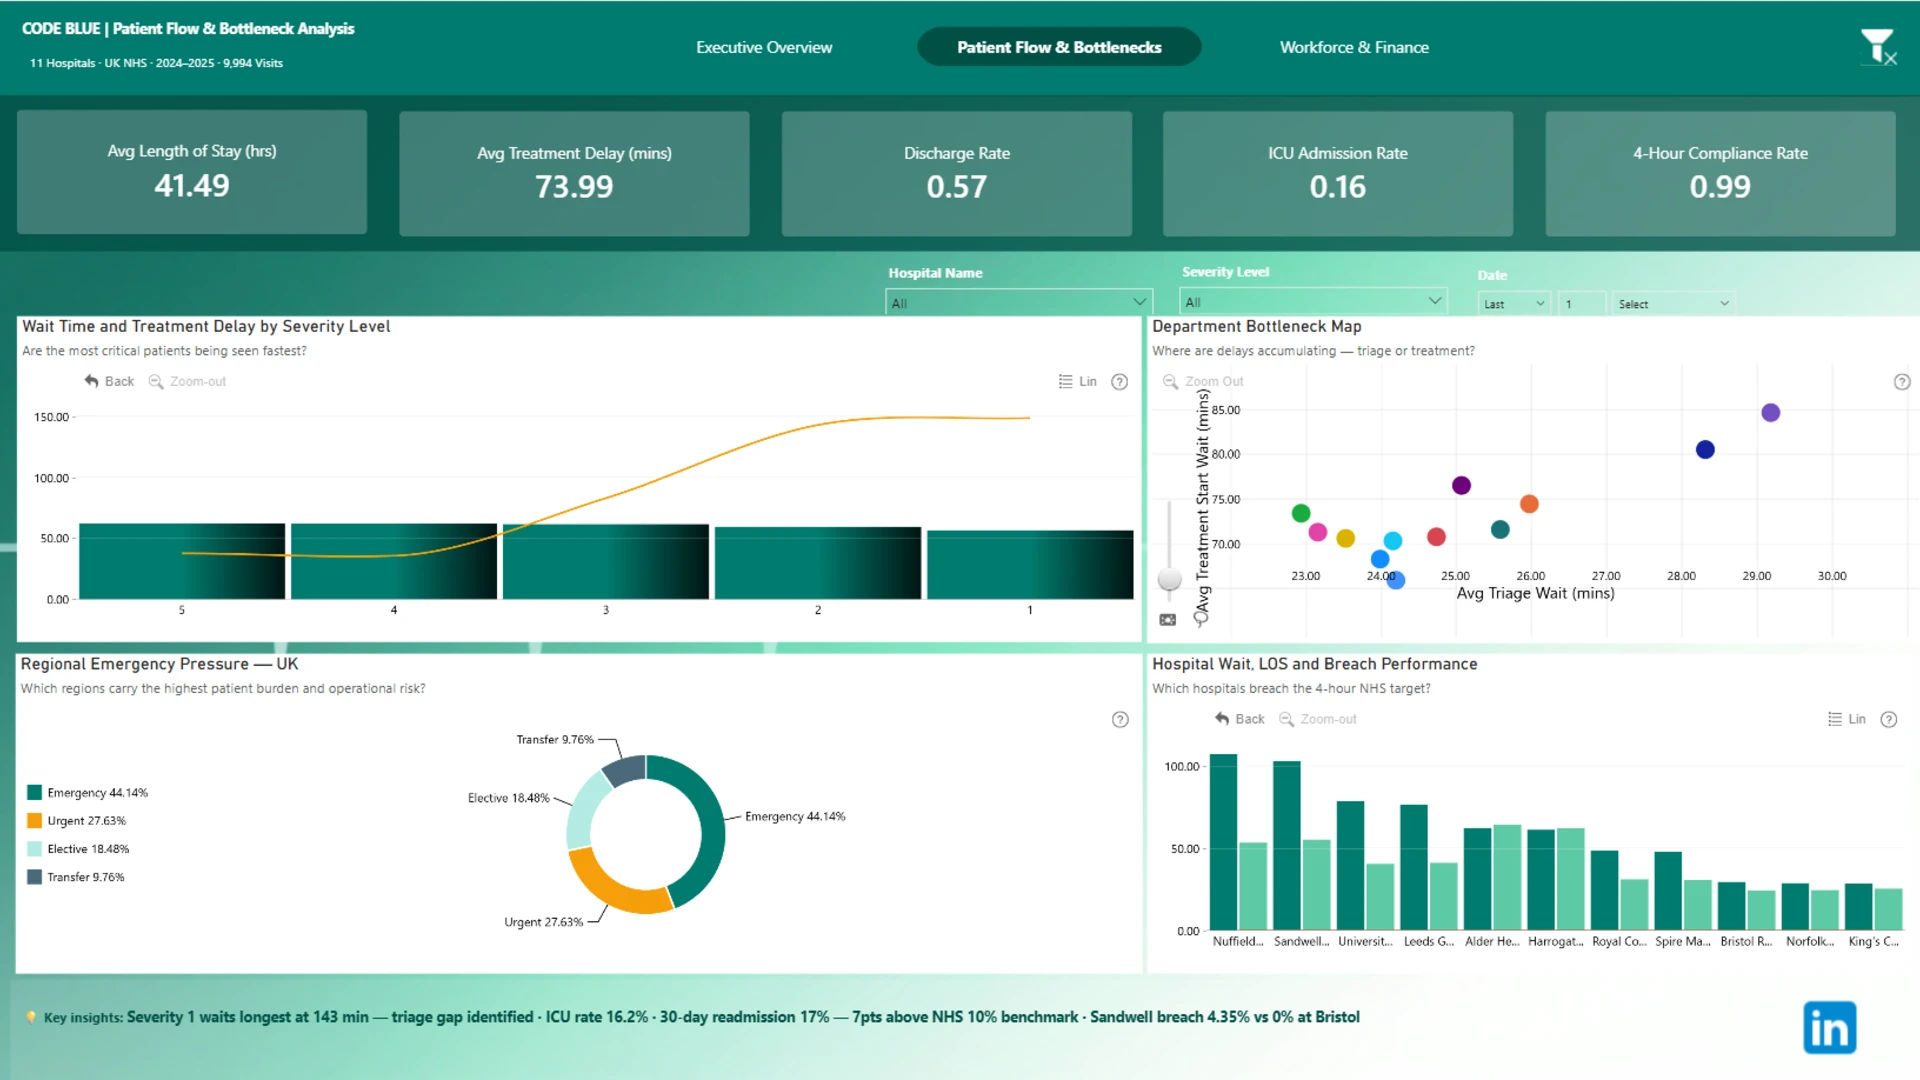
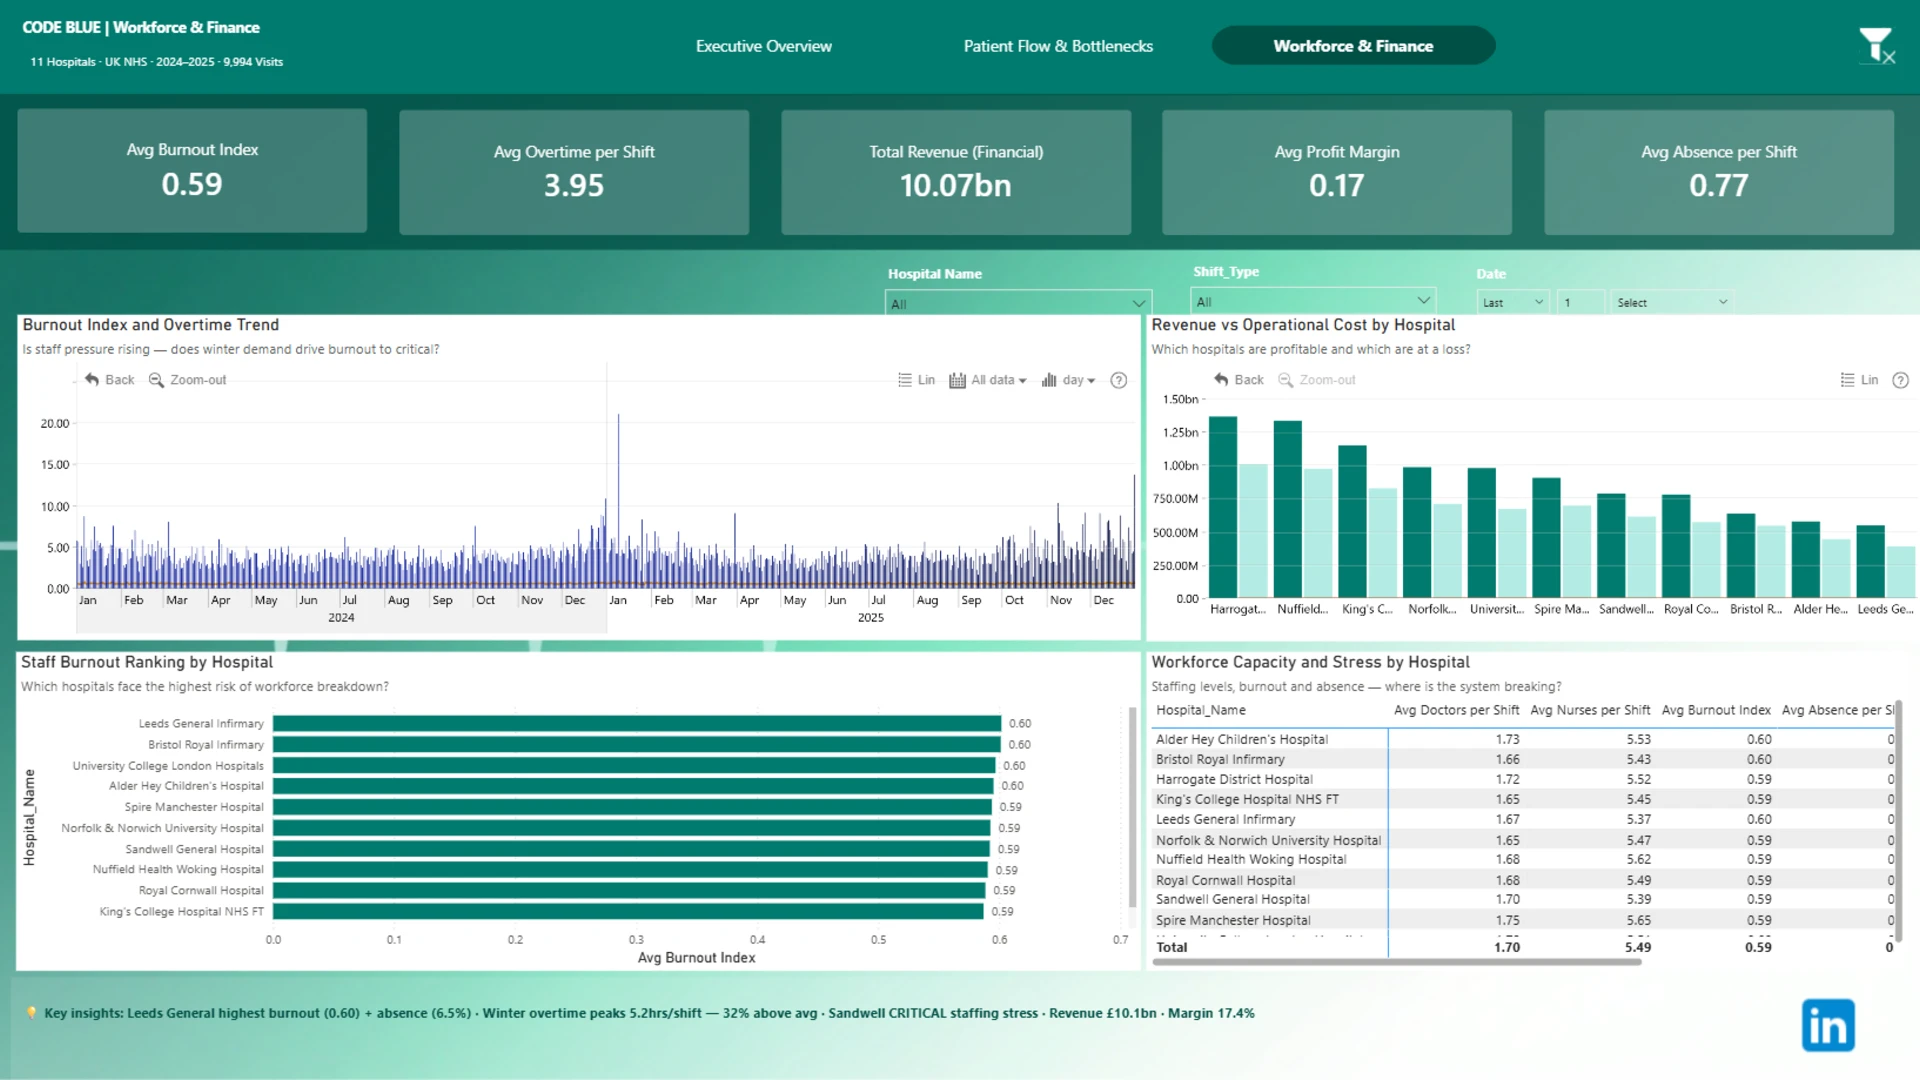
This interactive Power BI report explores the Code Blue Emergency Operations & Patient Flow dataset. It analyzes hospital performance, patient flow, bed capacity, emergency operations, pressure points, risks, inefficiencies, and outcome factors across hospitals and key healthcare segments.
Submitted to the FP20 Analytics ZoomCharts Data Challenge 38: Emergency Operations & Patient Flow Analytics, using native Power BI visuals and ZoomCharts Drill Down PRO custom visuals.
Author’s Description:
A system-wide performance analysis of 11 UK NHS and private hospitals covering January 2024 to December 2025. This report connects emergency arrival patterns, triage demand, waiting times, treatment flow, bed capacity, staff workload and financial performance to identify bottlenecks, surface operational risks and support data-driven decisions for better emergency care outcomes. Built with ZoomCharts Drill Down Visuals for interactive drill-through and cross-filtering across 9,994 patient visits, 9,919 staffing shifts and 264 monthly financial records.
ZoomCharts visuals used
4U Report Challenges
Participate in data challenges, build and submit reports to get free template downloads.
Join CommunityMobile view allows you to interact with the report. To Download the template please switch to desktop view.


Was this helpful? Thank you for your feedback!
Sorry about that.
How can we improve it?