266
Emergency Department Performance Dashboard
Emergency Department Performance Dashboard
More Report pages
Report Author: Mohamed Elbushra
266
Share template with others
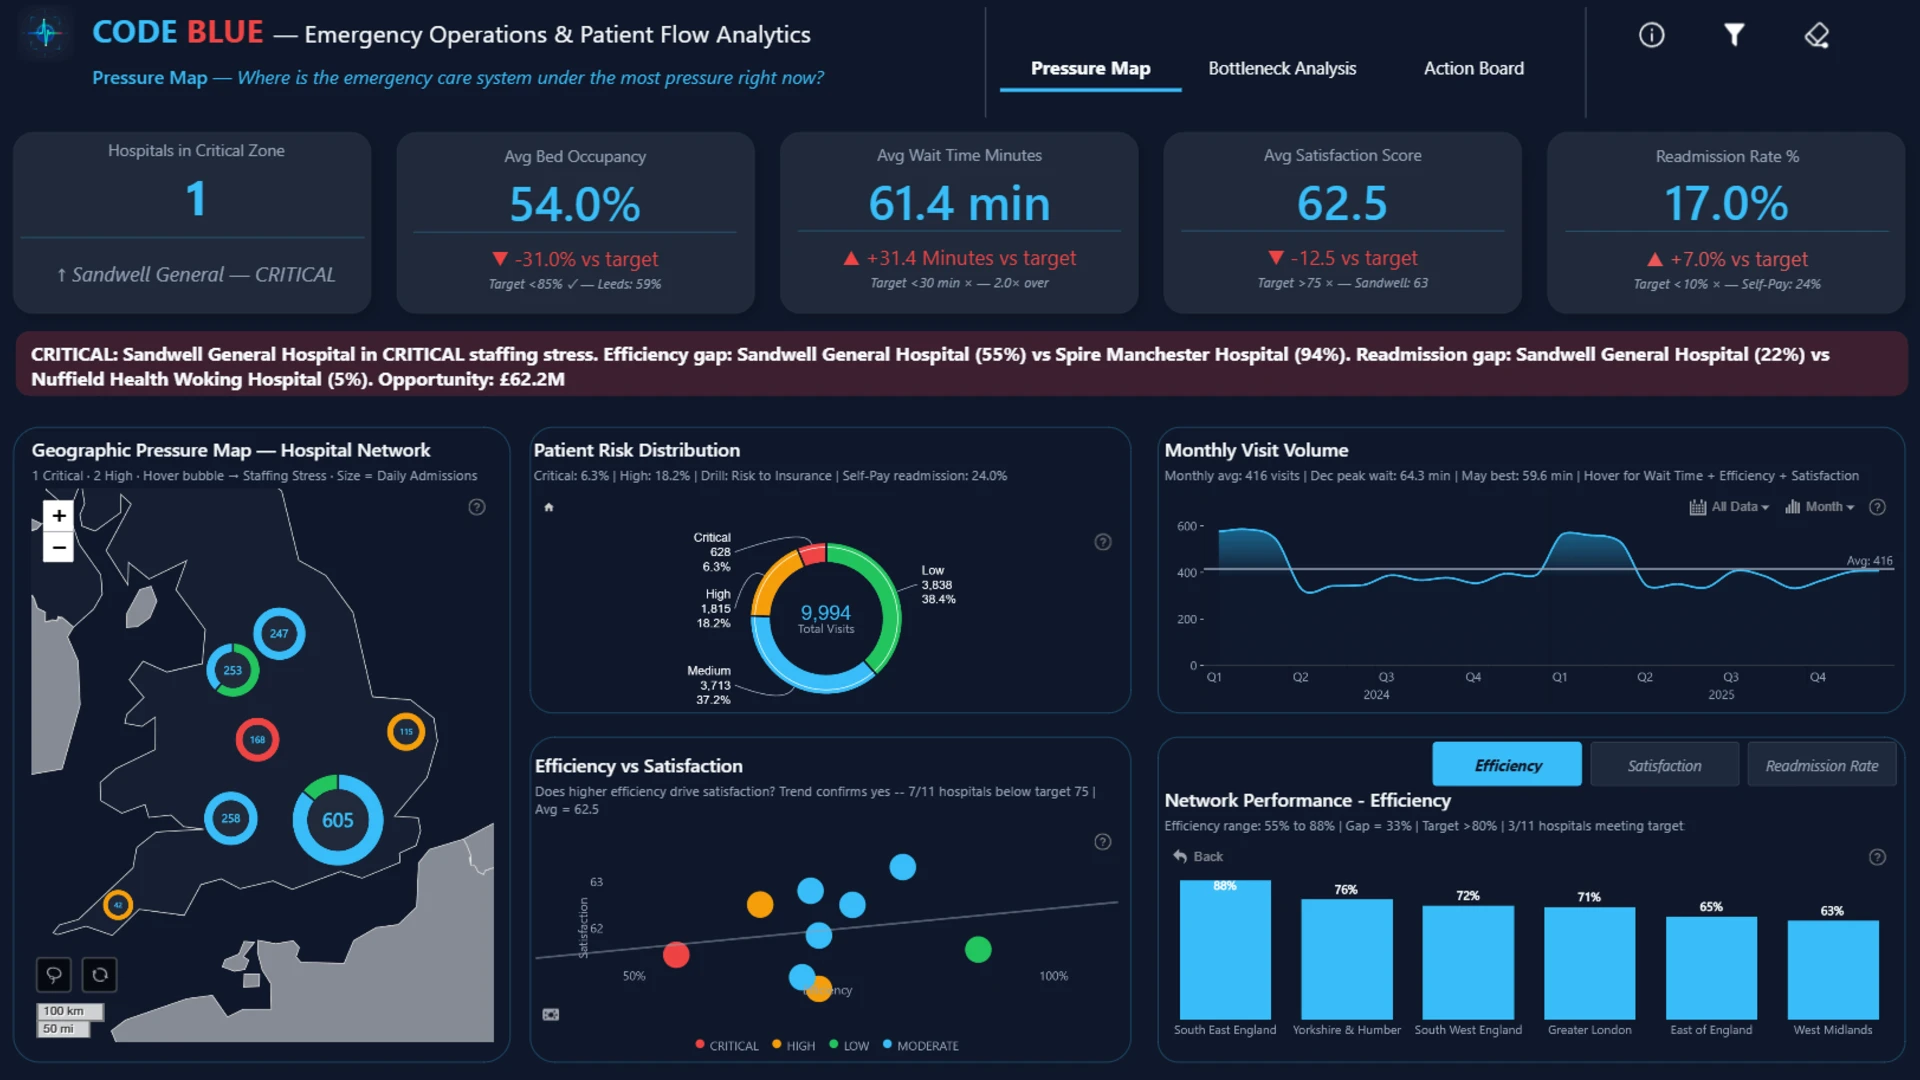
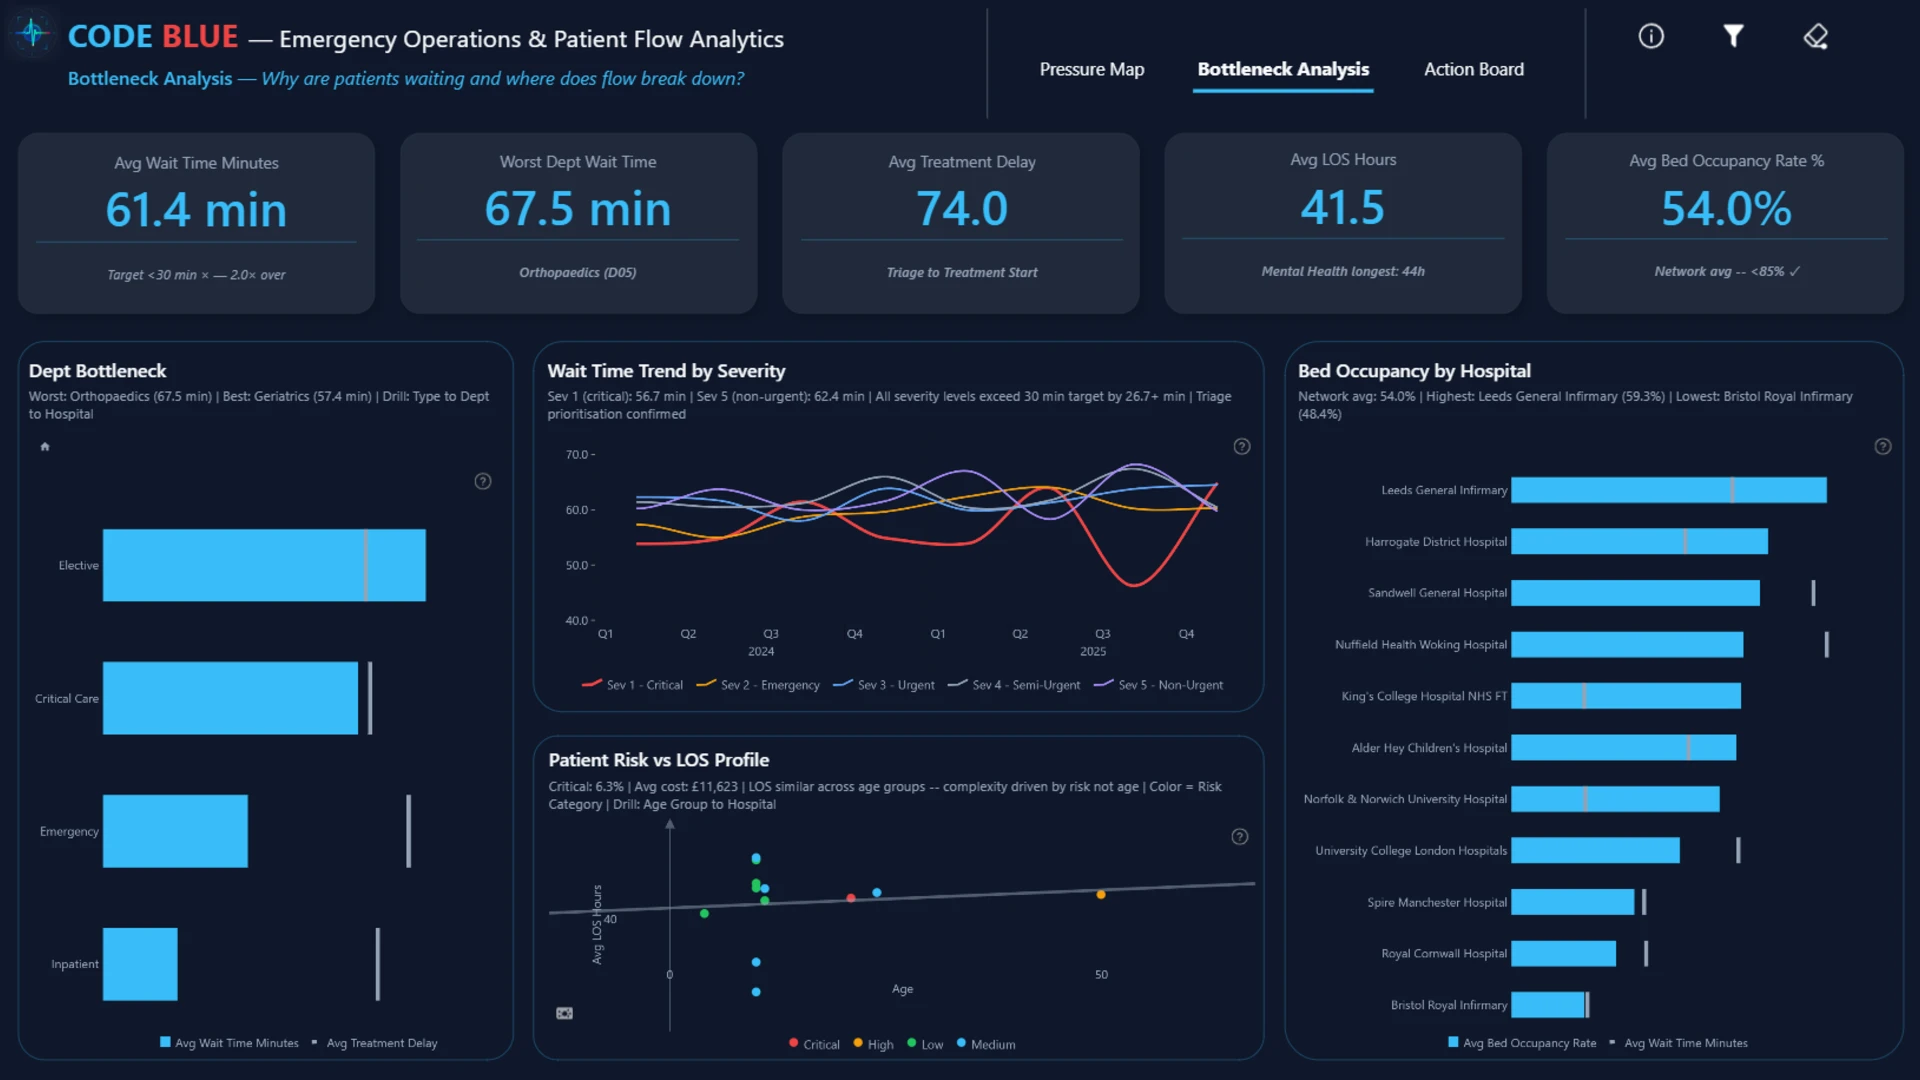
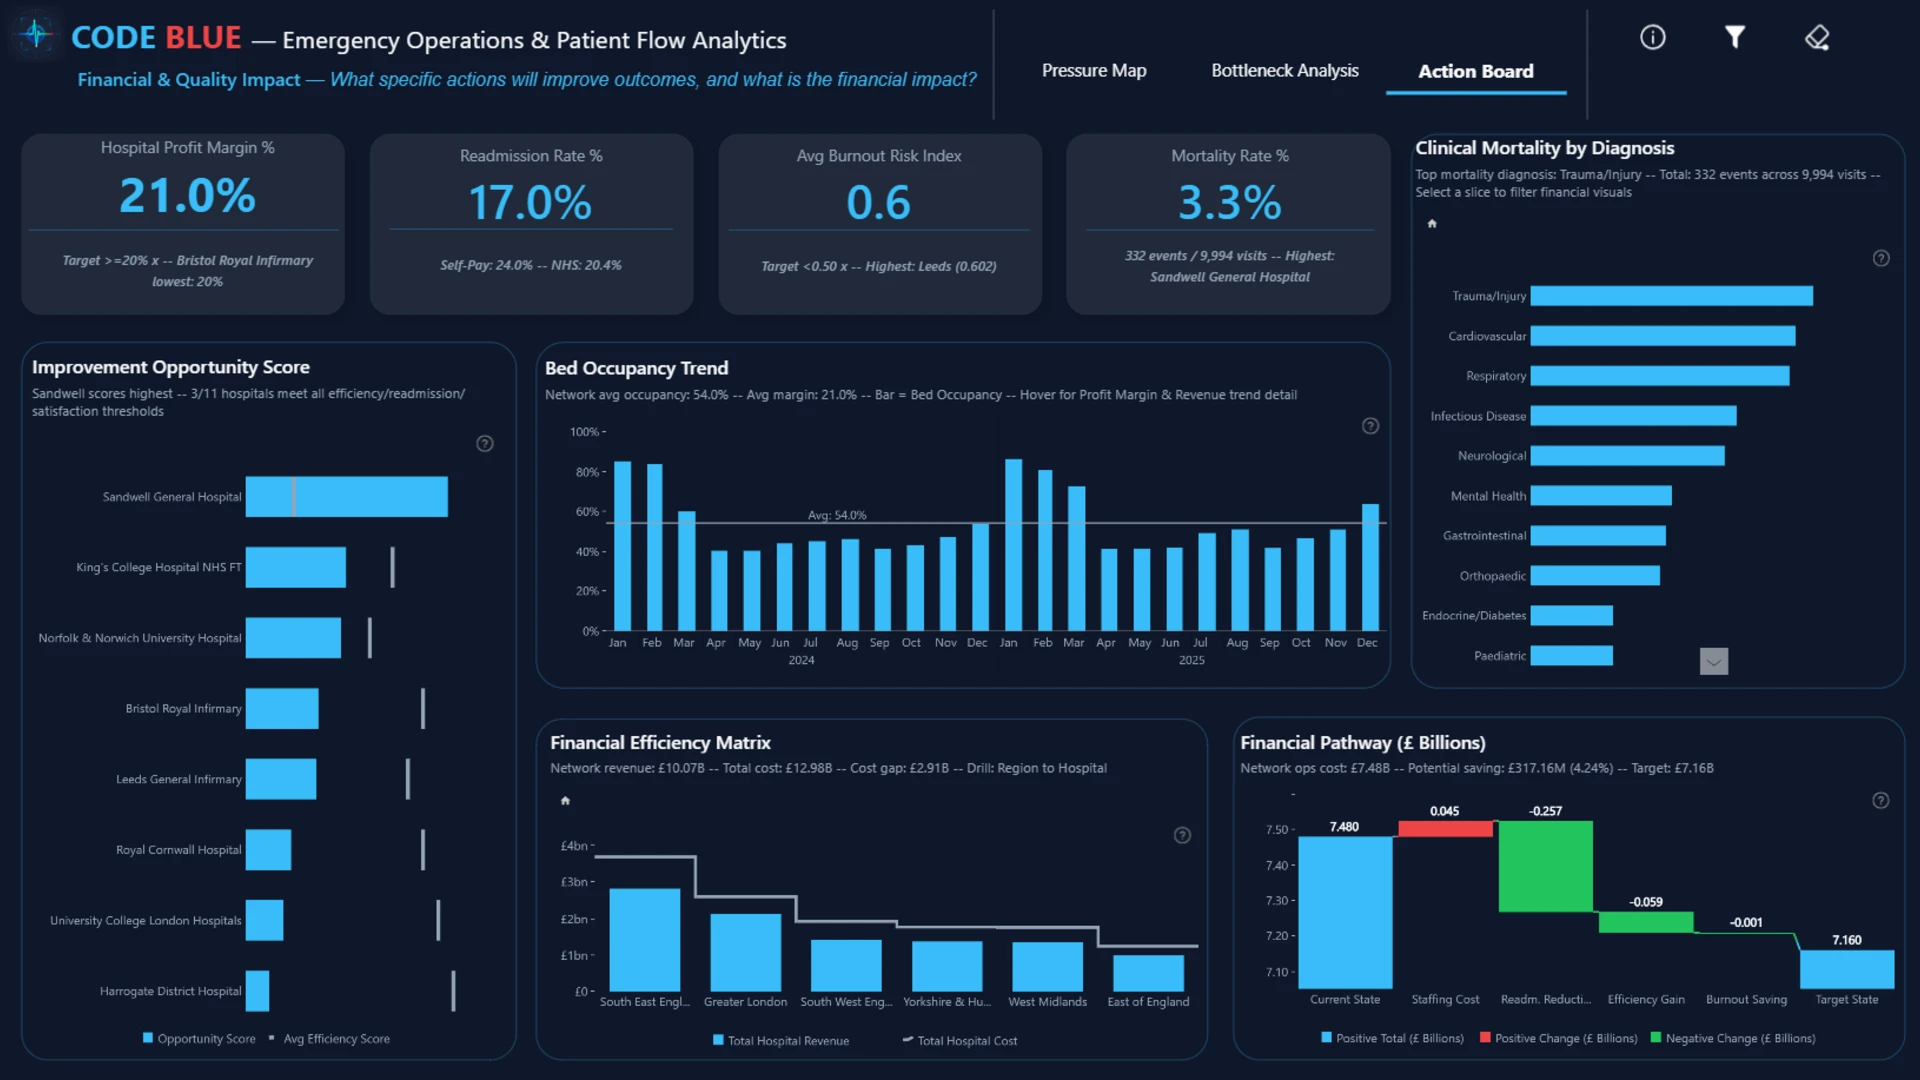
This interactive Power BI report explores the Code Blue Emergency Operations & Patient Flow dataset. It analyzes hospital performance, patient flow, bed capacity, emergency operations, pressure points, risks, inefficiencies, and outcome factors across hospitals and key healthcare segments.
Submitted to the FP20 Analytics ZoomCharts Data Challenge 38: Emergency Operations & Patient Flow Analytics, using native Power BI visuals and ZoomCharts Drill Down PRO custom visuals.
Author’s Description:
The CODE BLUE dashboard is a high-impact, multi-layered healthcare operations platform built to answer critical operational questions across an integrated hospital network. It translates complex clinical flow, patient risk metrics, and financial outcomes into digestible, actionable views. By framing operations through three distinct analytical lenses—Pressure, Bottlenecks, and Action/Impact—this dashboard bridges the gap between front-line hospital management and executive-level financial oversight. The dashboard is structured into a logical, three-tab workflow designed to guide a user from immediate situational awareness to root-cause analysis, and ultimately to financial and quality justifications for change.
ZoomCharts visuals used
4U Report Challenges
Participate in data challenges, build and submit reports to get free template downloads.
Join CommunityMobile view allows you to interact with the report. To Download the template please switch to desktop view.


Was this helpful? Thank you for your feedback!
Sorry about that.
How can we improve it?