238
Emergency Department Patient Flow Report
Emergency Department Patient Flow Report
More Report pages
Report Author: Akindele Omolayo
238
Share template with others
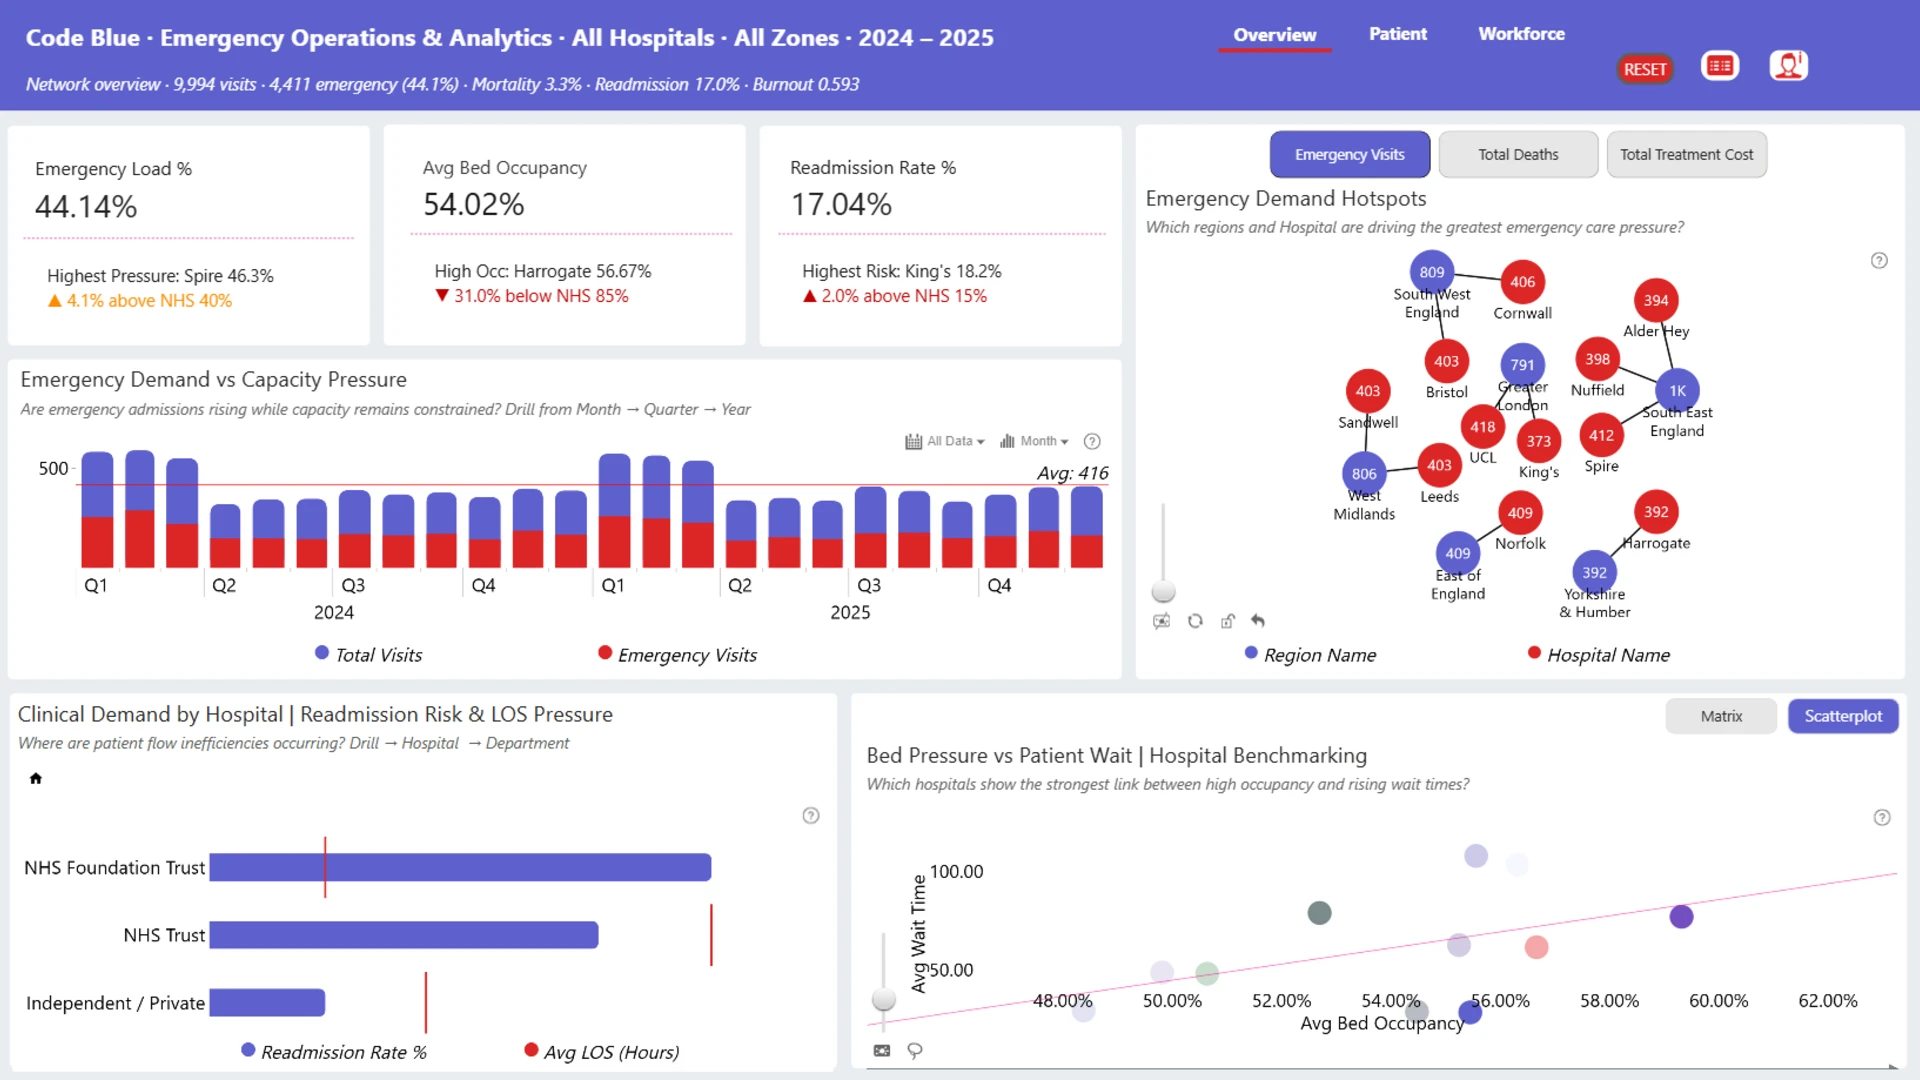
This interactive Power BI report explores the Code Blue Emergency Operations & Patient Flow dataset. It analyzes hospital performance, patient flow, bed capacity, emergency operations, pressure points, risks, inefficiencies, and outcome factors across hospitals and key healthcare segments.
Submitted to the FP20 Analytics ZoomCharts Data Challenge 38: Emergency Operations & Patient Flow Analytics, using native Power BI visuals and ZoomCharts Drill Down PRO custom visuals.
Author’s Description:
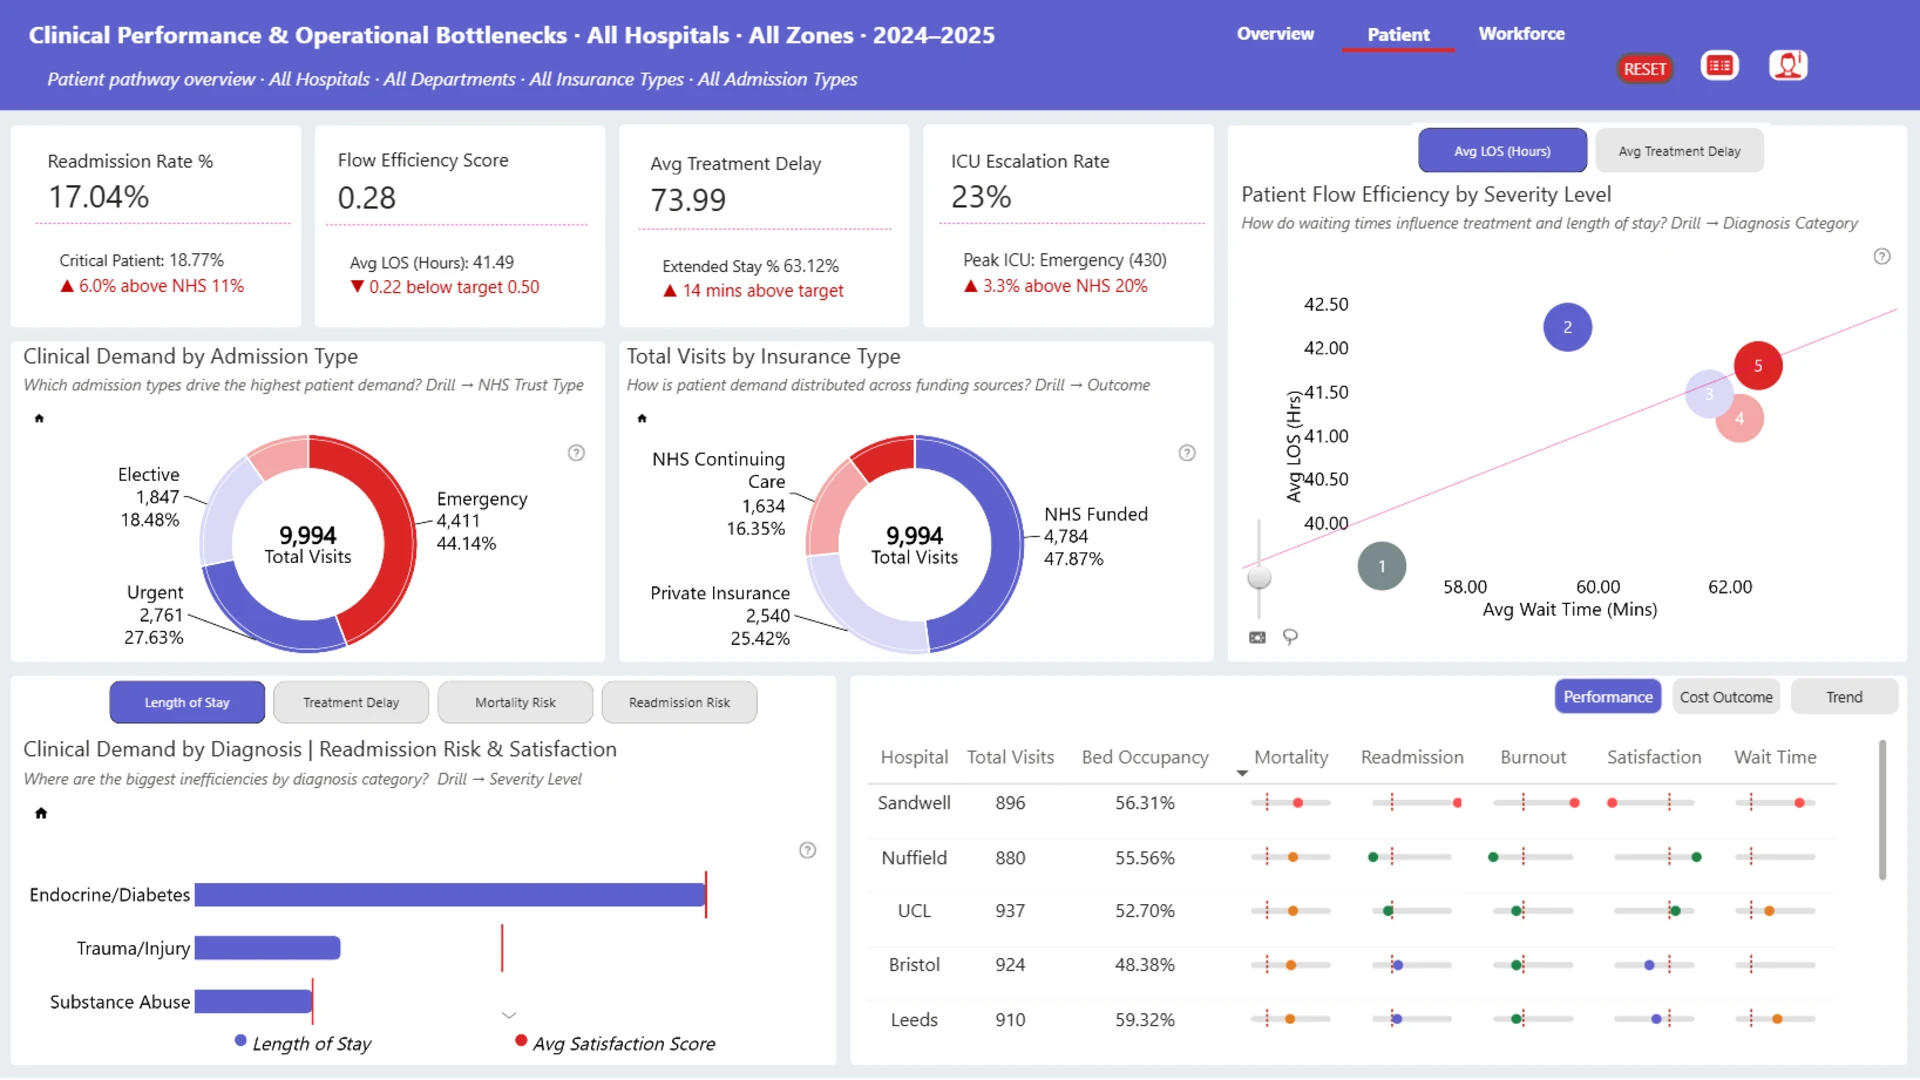
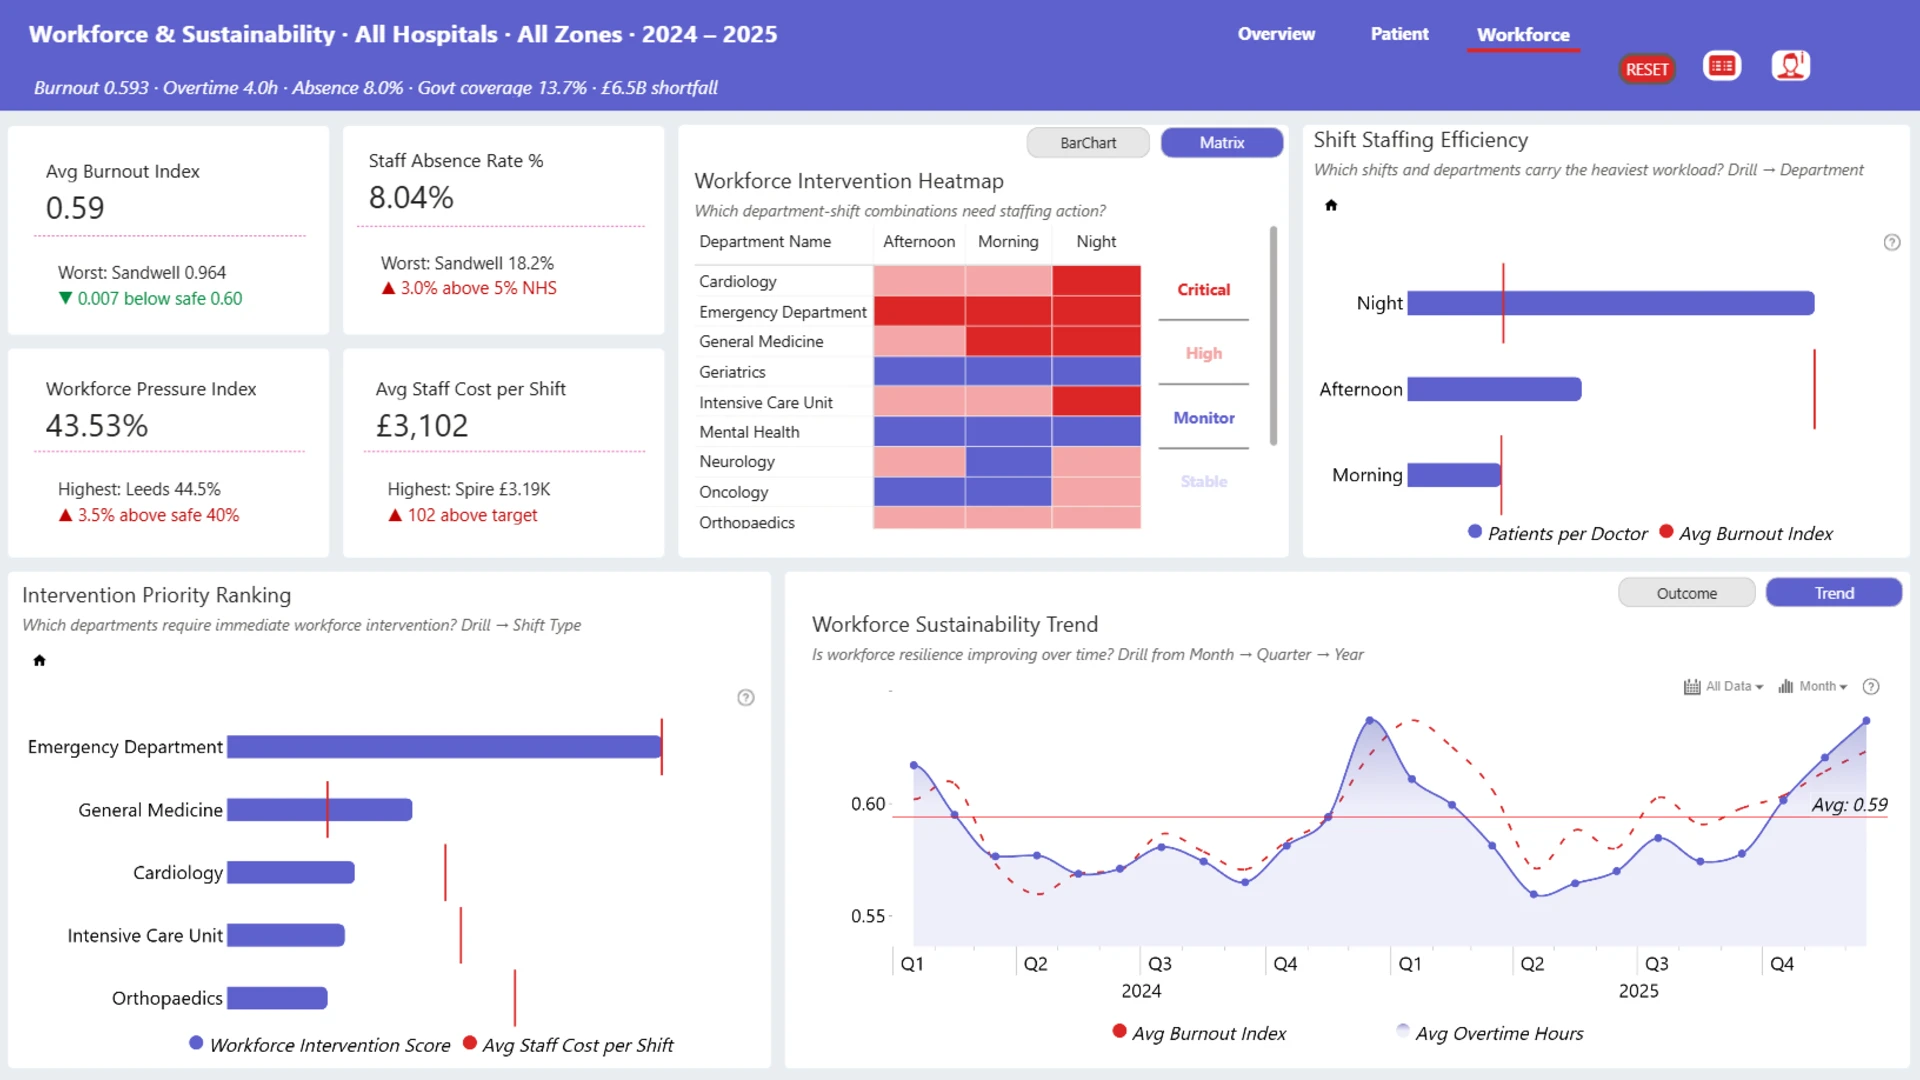
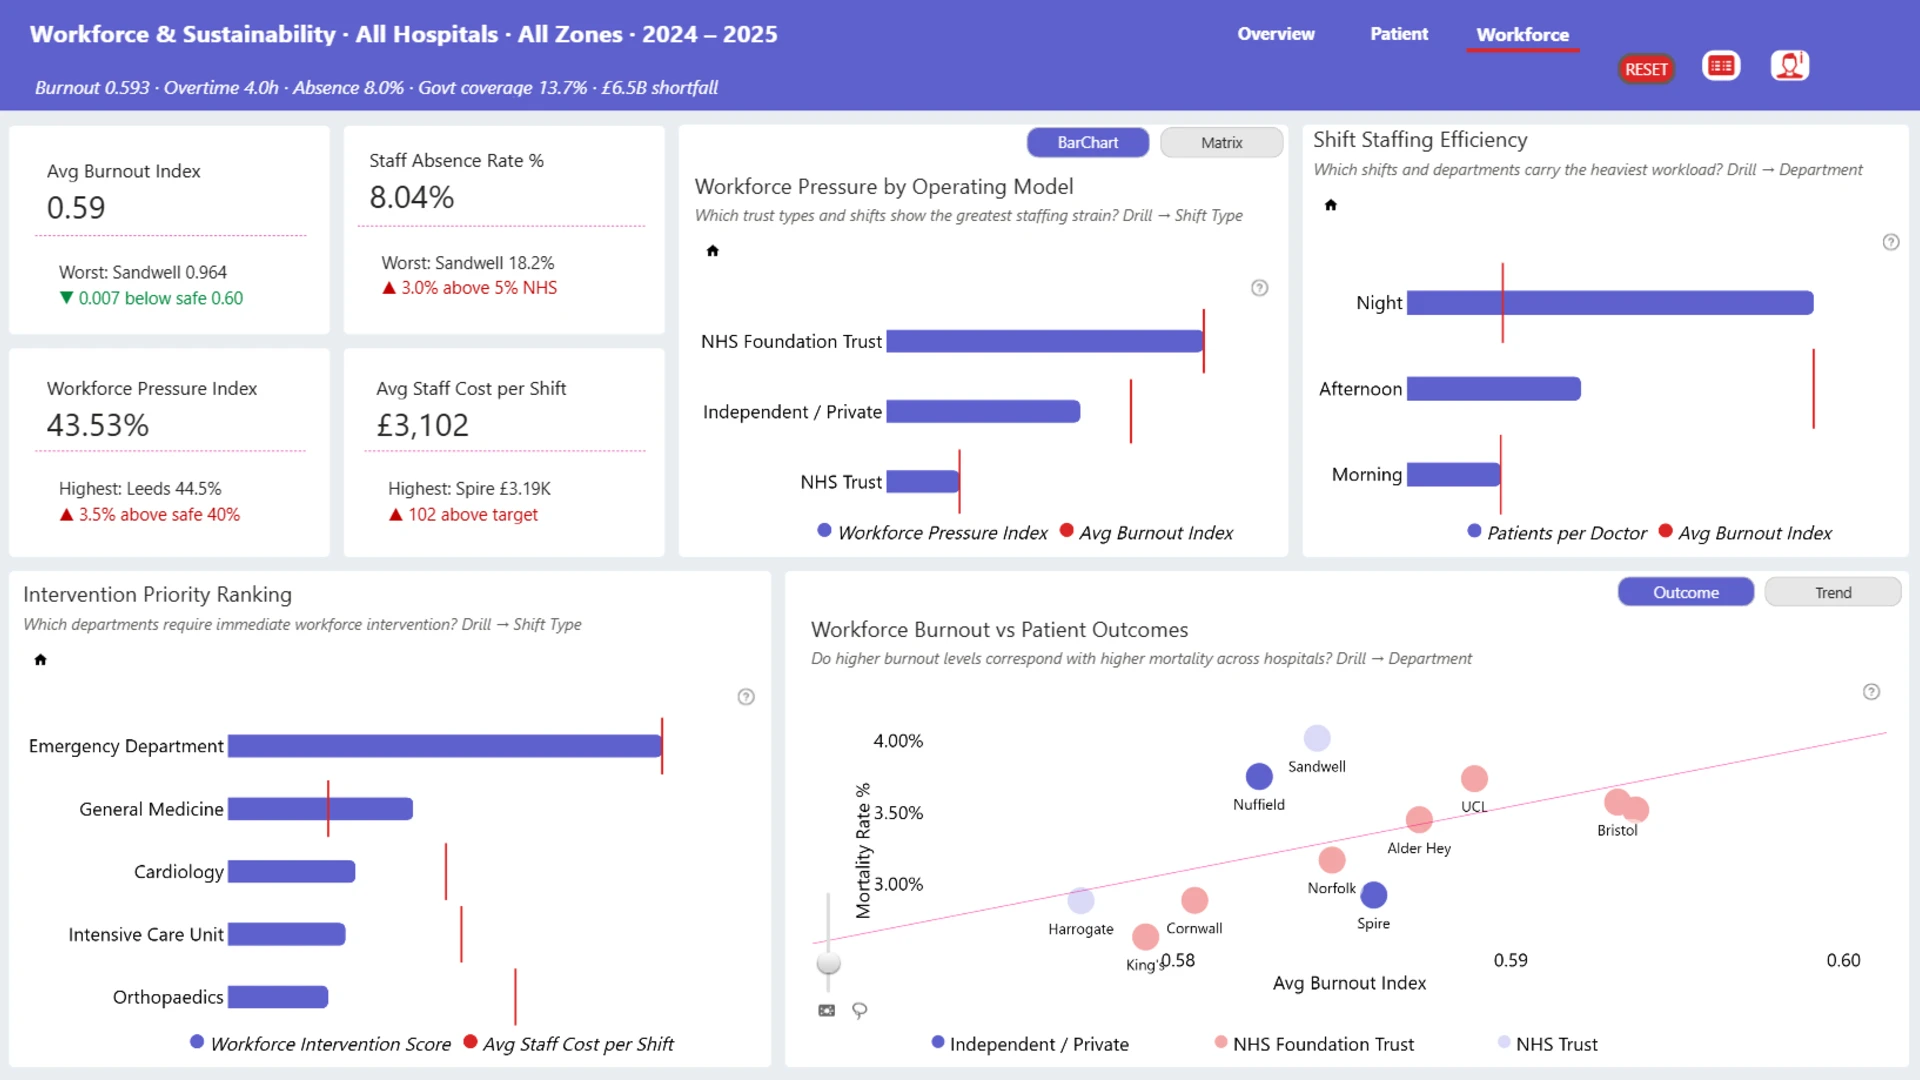
This executive Power BI report was created for the FP20 Healthcare Analytics Challenge to help healthcare leaders monitor emergency department performance, identify patient flow bottlenecks, and optimize workforce planning. Organized into three analytical pages, it guides users from a network-wide operational overview to detailed analysis of performance drivers and staffing efficiency. Interactive drill-downs, dynamic KPIs, benchmark comparisons, conditional formatting, and custom tooltips transform complex healthcare data into actionable insights, enabling faster, evidence-based decision-making to improve patient outcomes and operational performance.
ZoomCharts visuals used
4U Report Challenges
Participate in data challenges, build and submit reports to get free template downloads.
Join CommunityMobile view allows you to interact with the report. To Download the template please switch to desktop view.


Was this helpful? Thank you for your feedback!
Sorry about that.
How can we improve it?