575
B2B Sales Pipeline Power BI Report 7
B2B Sales Pipeline Power BI Report 7
Report Author: Oladimeji Michael
575
Share template with others
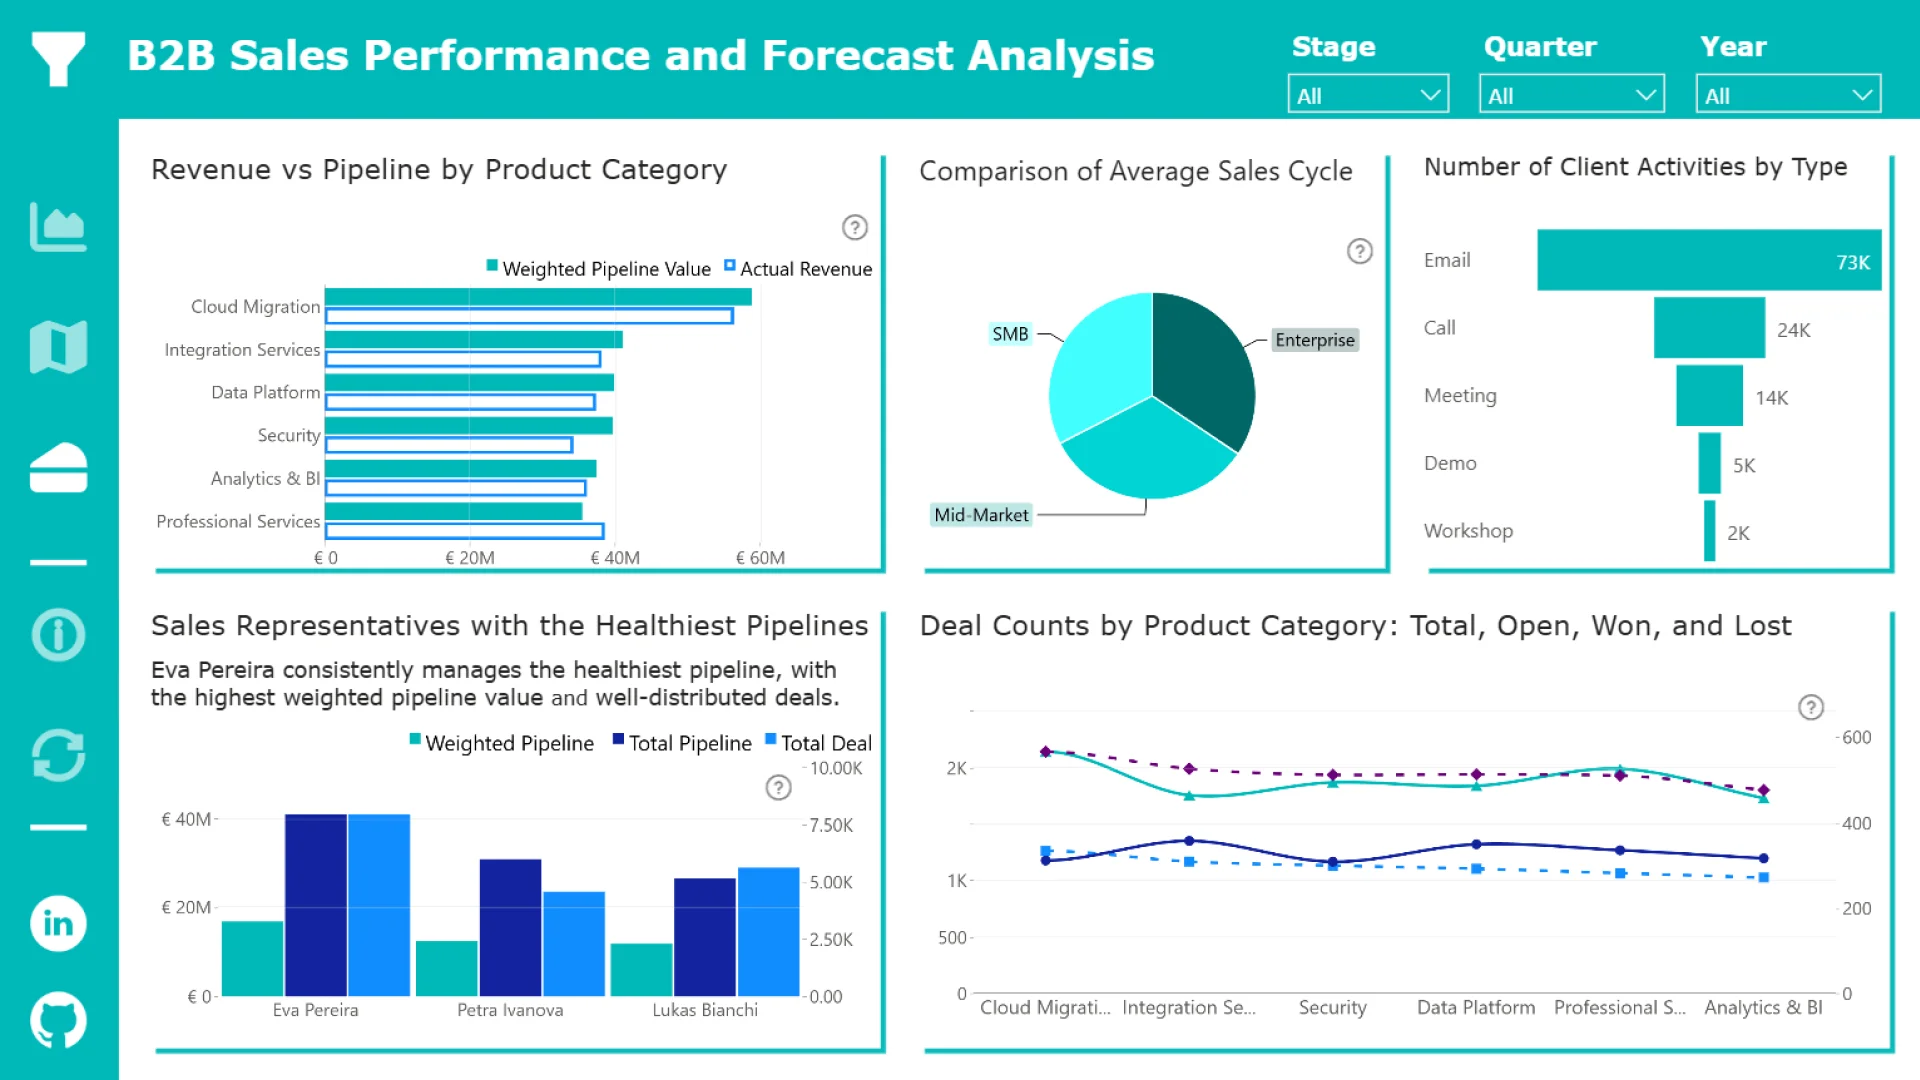
This interactive Power BI report explores the Global B2B Sales Pipeline & Deals Analytics dataset using ZoomCharts Drill Down PRO custom visuals for Power BI. It highlights pipeline value, deal progression, sales activity, and client engagement across regions and industries, helping teams monitor pipeline health and identify stalled or high-risk deals.
The report was submitted to the FP20 Analytics ZoomCharts Data Challenge #35 (February – March 2026).
Author’s Description:
This dashboard analyzes the sales performance of a global B2B SaaS and Professional Services company. The dataset includes thousands of sales deals, customer companies, pipeline stages, and sales activities across multiple industries and regions.
The purpose of this dashboard is to transform raw sales data into actionable insights that help stakeholders understand revenue performance, sales productivity, and pipeline health.
ZoomCharts visuals used
4U Report Challenges
Participate in data challenges, build and submit reports to get free template downloads.
Join CommunityMobile view allows you to interact with the report. To Download the template please switch to desktop view.

Was this helpful? Thank you for your feedback!
Sorry about that.
How can we improve it?