561
B2B Sales Pipeline Dashboard 2
B2B Sales Pipeline Dashboard 2
Report Author: Md Shafque
561
Share template with others
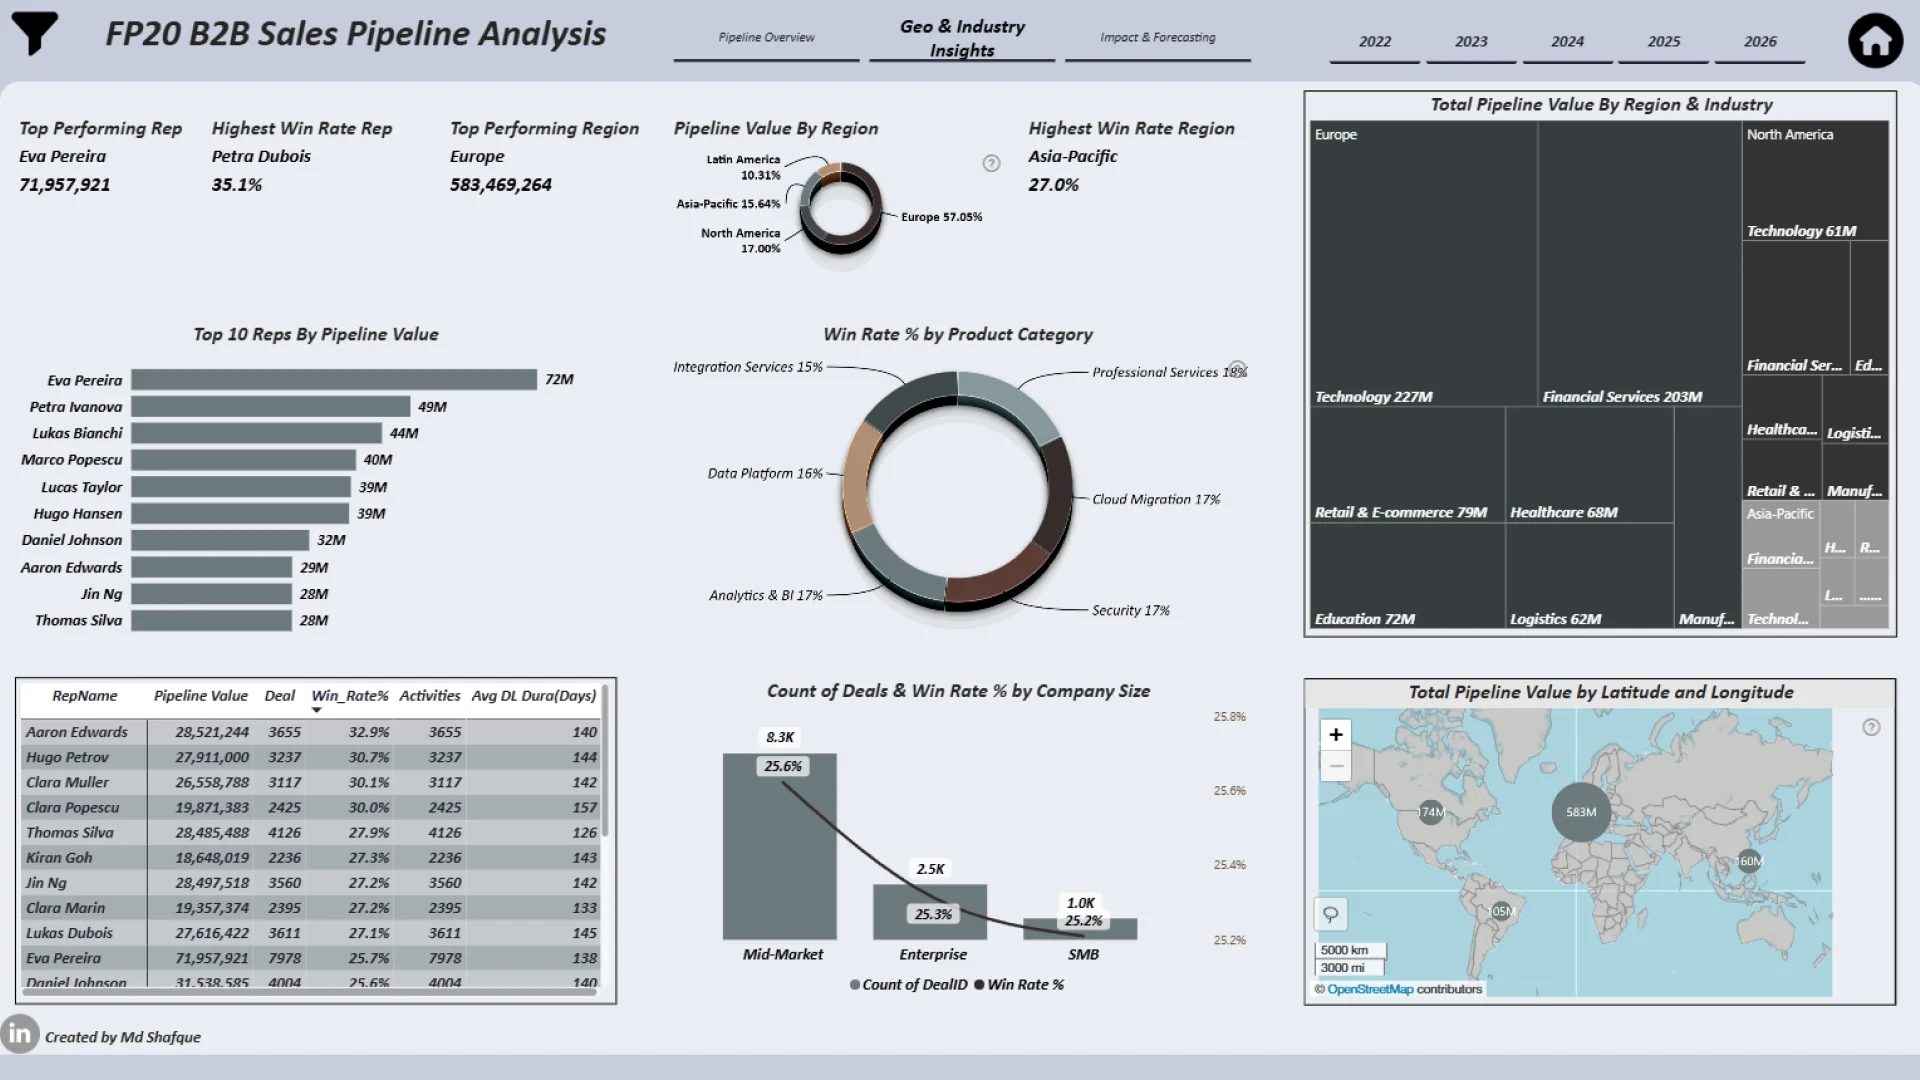
This interactive Power BI report explores the Global B2B Sales Pipeline & Deals Analytics dataset using ZoomCharts Drill Down PRO custom visuals for Power BI. It highlights pipeline value, deal progression, sales activity, and client engagement across regions and industries, helping teams monitor pipeline health and identify stalled or high-risk deals.
The report was submitted to the FP20 Analytics ZoomCharts Data Challenge #35 (February – March 2026).
Author’s Description
This report provides a structured view of the B2B sales pipeline for FP20 Analytics, focusing on pipeline value, win rate trends, activity distribution, seasonality, stage velocity, and sales representative performance. It analyzes pipeline trends, deal progression across stages, industry and regional segmentation, and activity patterns to understand factors that influence conversion and revenue growth. The dashboard also includes stage-level win rate analysis and seasonality insights to identify high-value contributors and underperforming stages.
Designed with simple navigation, minimal clutter, and clear drill-down paths, the report helps sales leaders quickly identify growth drivers, detect pipeline gaps, and make informed decisions to improve sales performance.
4U Report Challenges
Participate in data challenges, build and submit reports to get free template downloads.
Join CommunityMobile view allows you to interact with the report. To Download the template please switch to desktop view.

Was this helpful? Thank you for your feedback!
Sorry about that.
How can we improve it?