logo
For Power BI
  • Products
    • Custom Visuals for Power BI
    • Report Templates
  • Resources

      Resources

    • Documentation
    • Report Examples
    • Blog
    • Webinars
    • Video Tutorials
    • Visuals Gallery

    Support

    • ZoomCharts Assistance
    • Contact Sales
    • Contact Support
    • FAQ

    Challenges

    Challenges

    Improve your report creation skills by participating in free challenges for report creators.

    Learn more
    Get Developer License
  • Services
    • Power BI Report Development
    • Custom Visual Development
  • Challenges
  • Pricing
    • Custom Visuals for Power BI
    • Report Templates
Subscribe
Subscribe
Get it now
Go back

Contents

Contest logo
Contest logo
Contest logo
Contest logo
Try Free Now

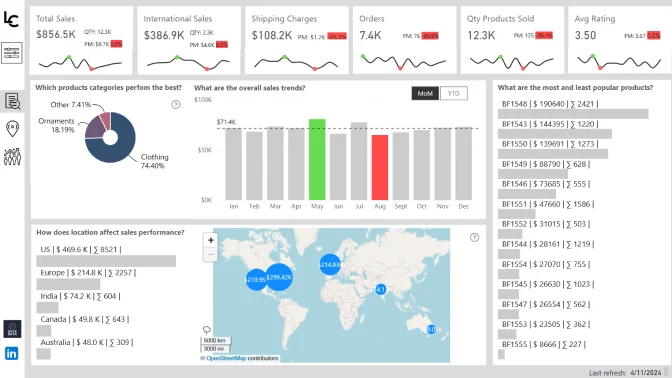
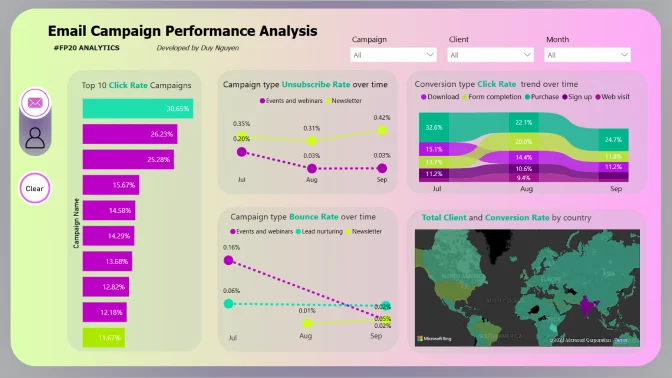
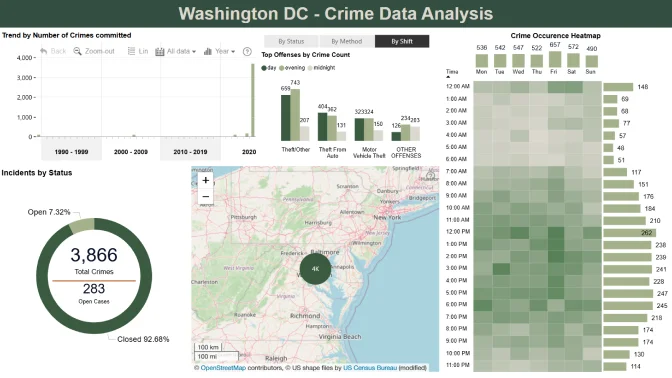
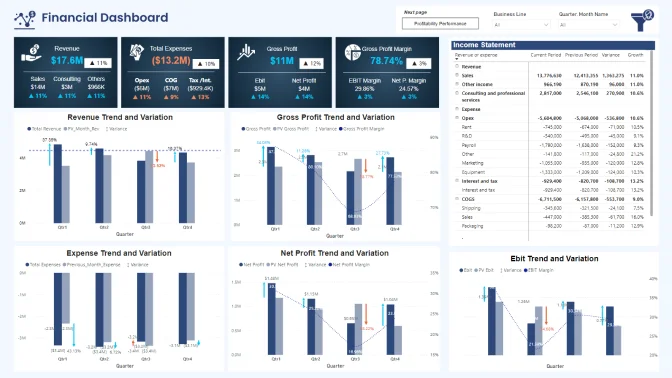
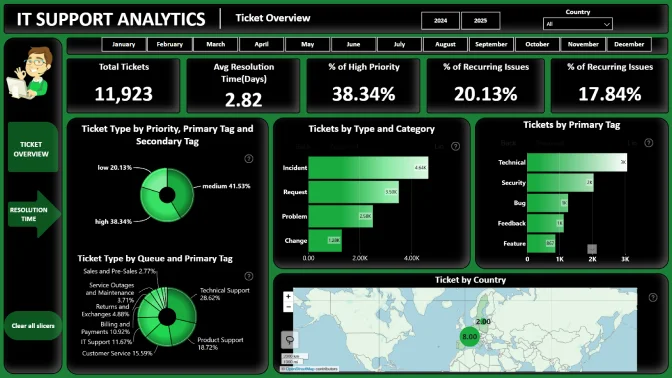
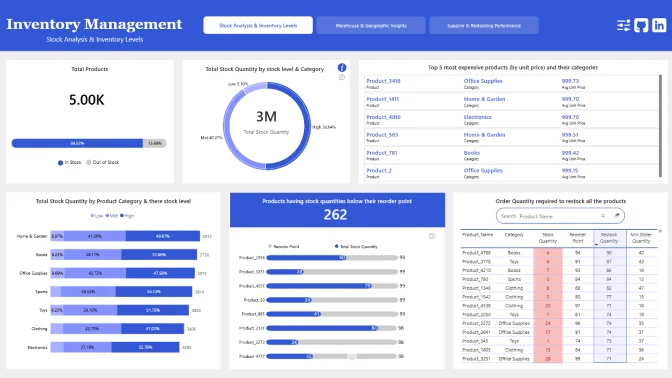
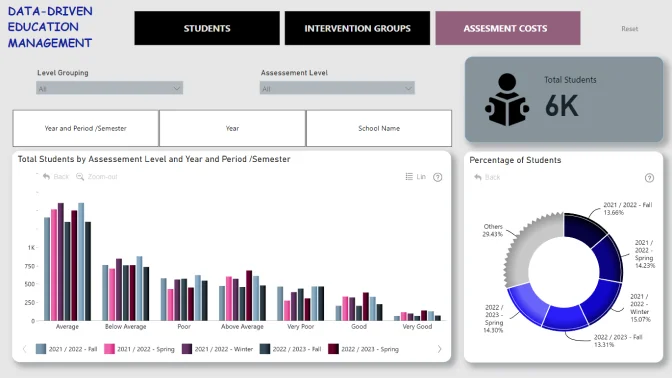
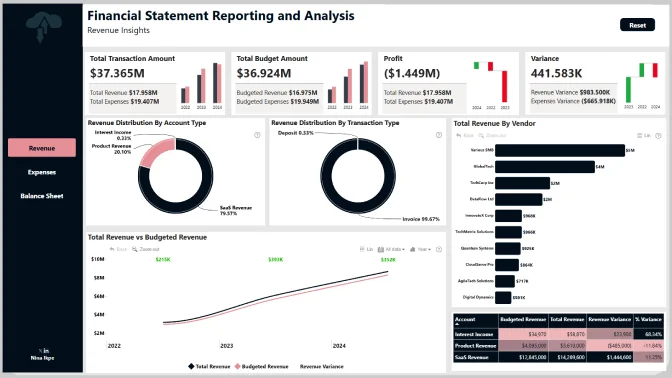
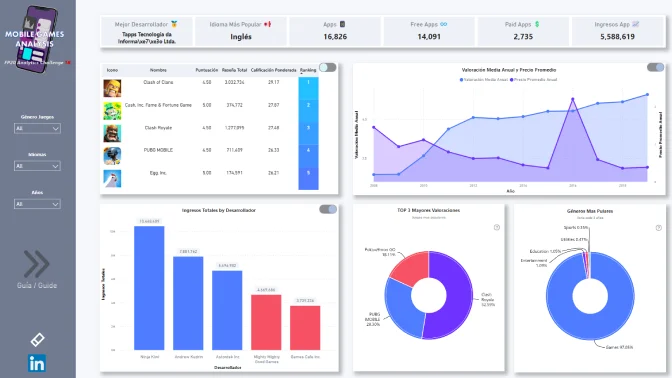
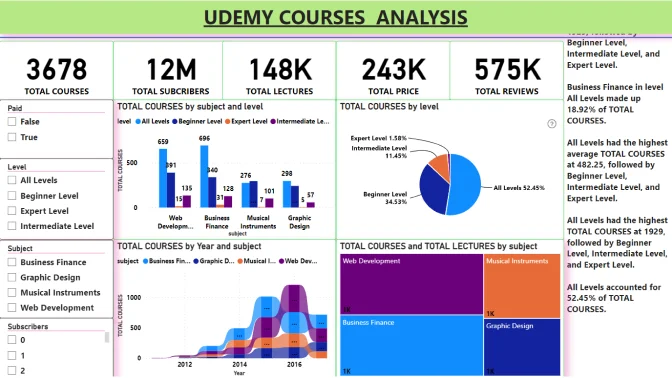
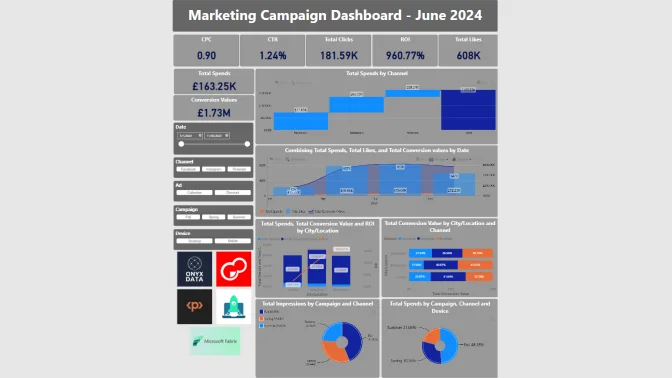
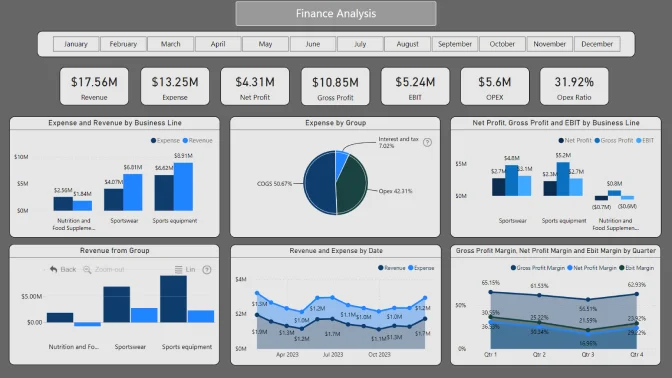
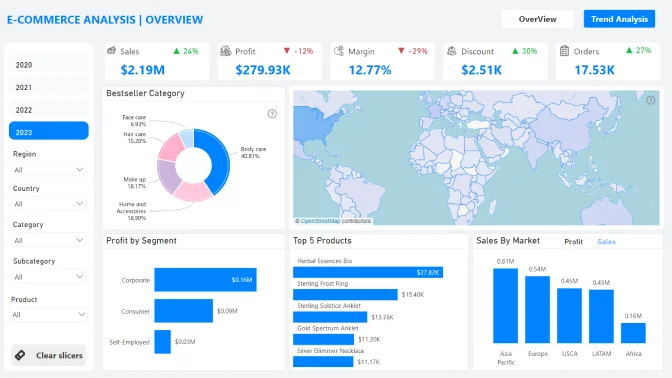
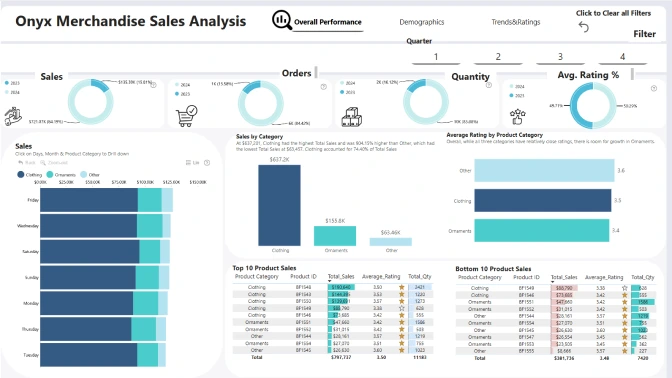
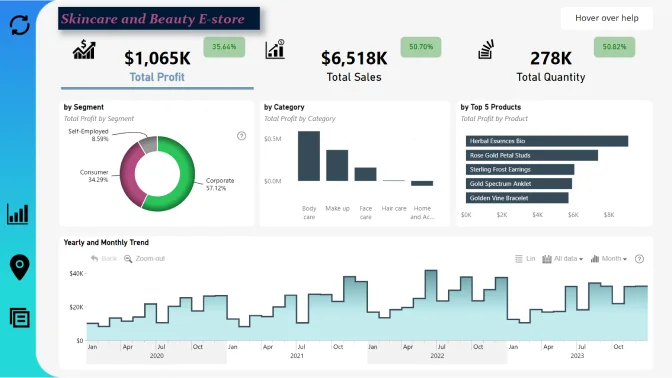
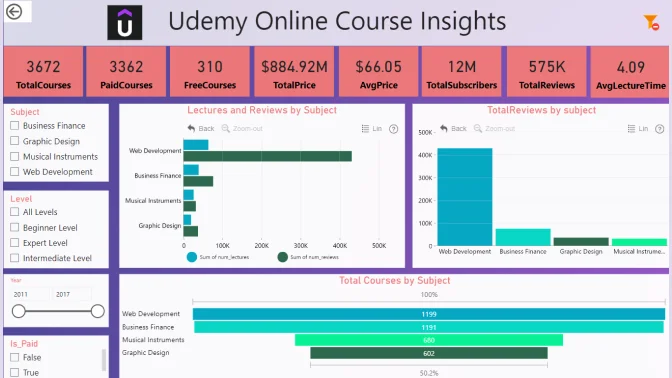
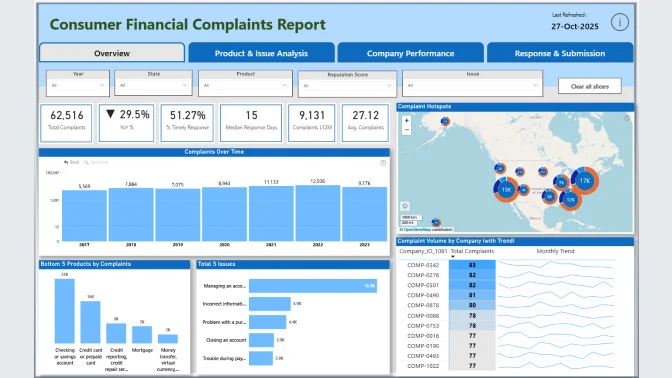
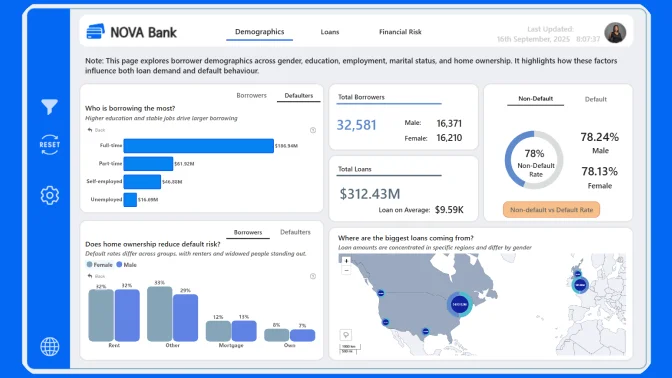
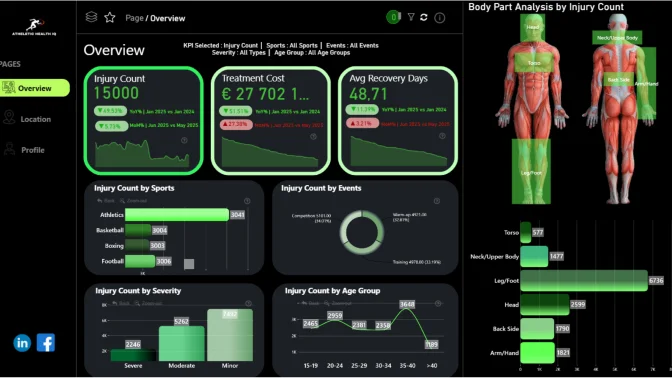
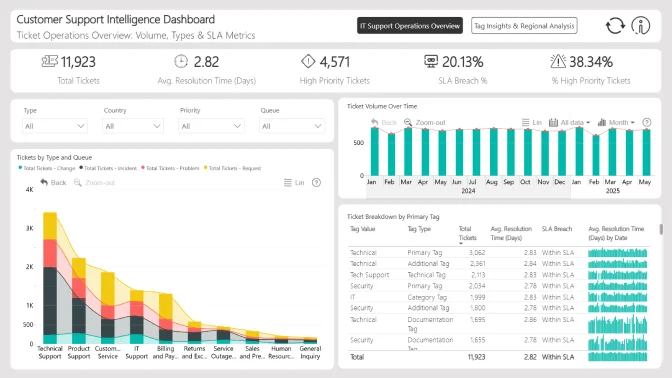
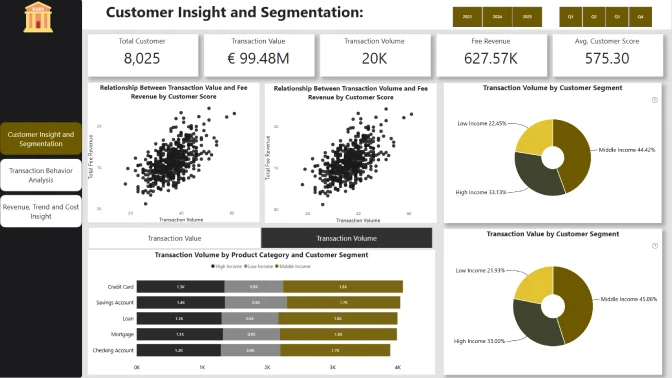
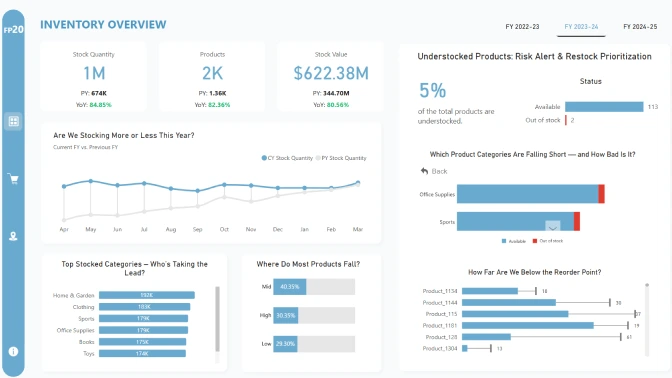
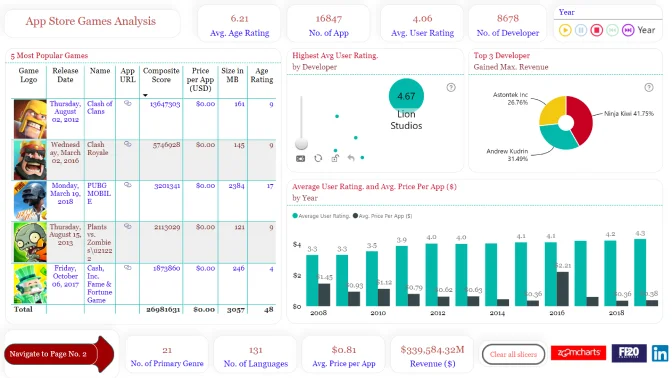
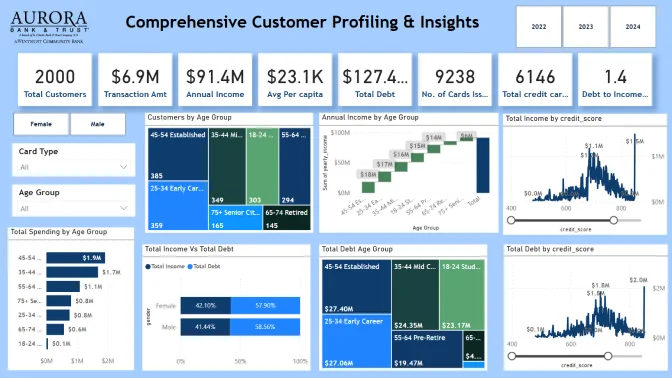
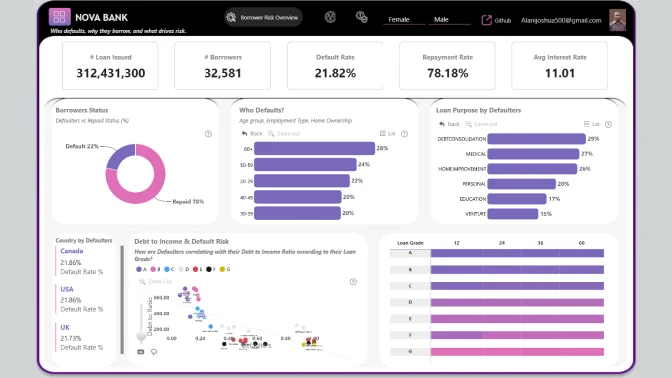
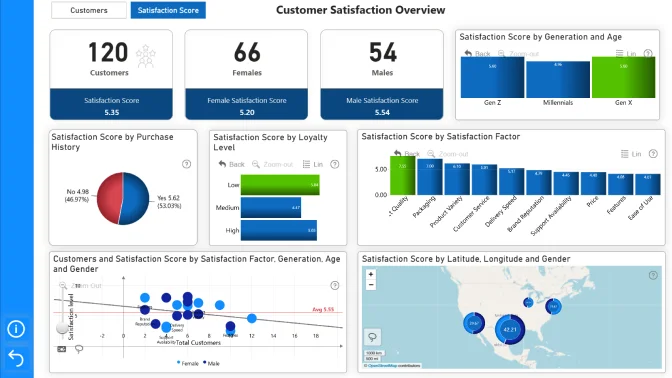
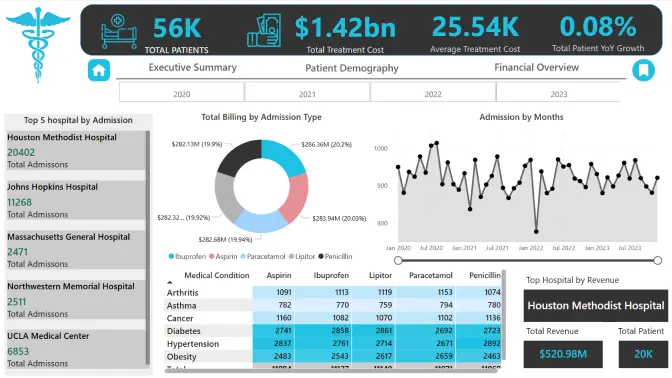
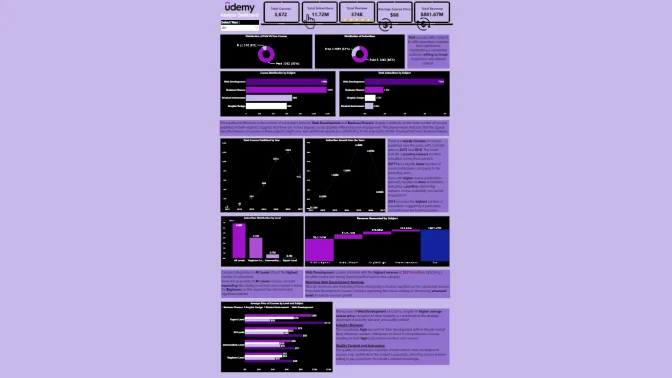
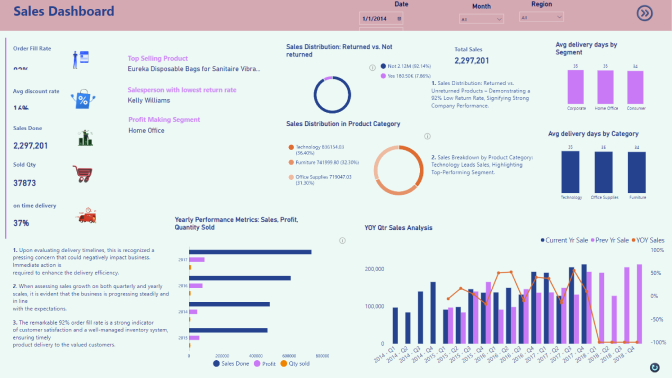
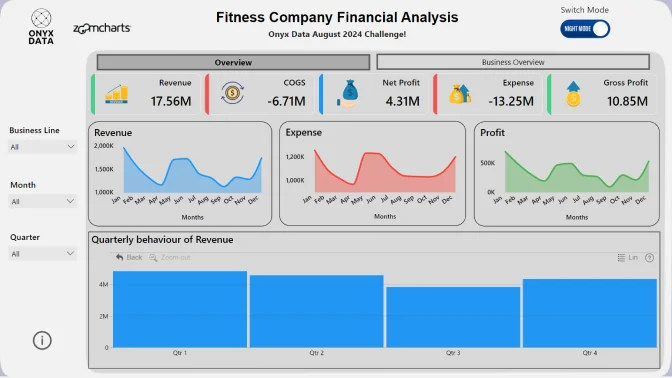
Power BI Dashboard Examples

The world’s #1 Interactive Power BI
Template Gallery

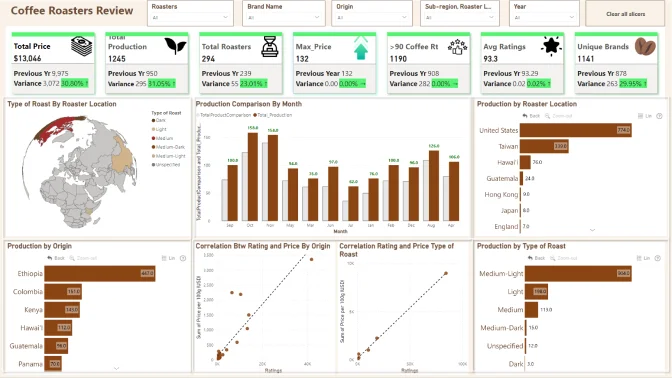
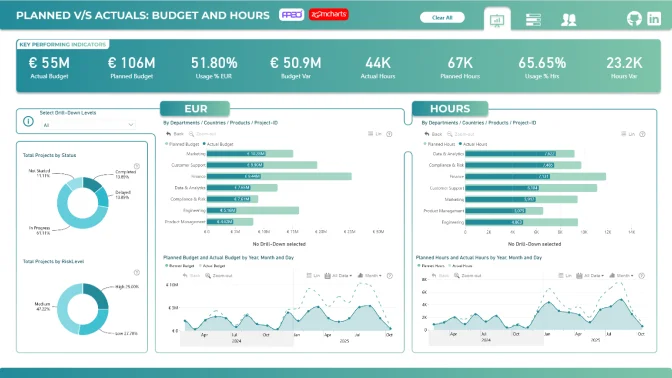
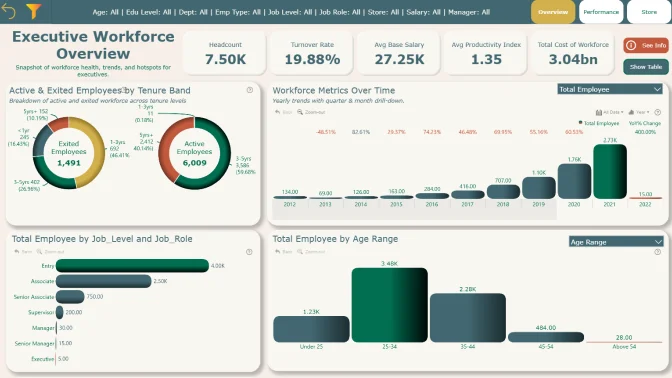
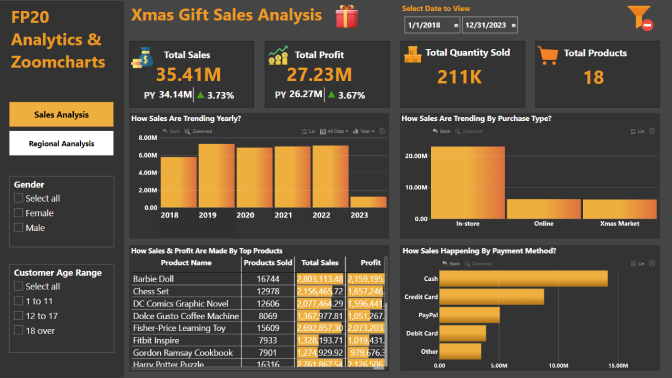
See our Power BI templates for new ideas to implement within your own reports. Explore interactive report examples of sales, banking, HR and other kinds of data. Click on each template to view in more detail. Download pbix and start interacting.

2000+

Power BI
Templates

1000+

Creators

100+

New Reports
Every Month

1M+

Views

Filters

Sort by:
2292 results
Report Card

Paralympic Games Performance Insights

Rakshit Bhadoria

136

Report Card

Urbanization in South America

Kamonphan Teeraphabpitag

136

Report Card

Ticketing System Analysis

Okeh Dono Efasa

136

Report Card

Consumer Financial Complaints Report 20

Ólger Arce Gómez

135

Report Card

Student Performance Power BI Report 10

Tanmoy Banerjee

135

Report Card

Consumer Financial Complaints Report 17

Farhan Jeelani

135

Report Card

Consumer Financial Complaints 3

Pradeep Kumar

135

Report Card

Credit Risk Analytics 2

Asuvila Marion

135

Report Card

Customer Satisfaction and Loyalty Report 45

Emmanuel Idowu

135

Report Card

Customer Satisfaction and Loyalty Report 26

Precious Duniya

135

Report Card

IT Support Helpdesk Dashboard 15

Nnamdi Atu

135

Report Card

Udemy Courses Dashboard

Vinod Jadhav

135

Report Card

Tactical Crime Analysis 9

Sezhiyan Selvaraj

135

Report Card

Marketing Email Campaign Analysis

Ugochukwu Nwasuruba

135

Report Card

Marketing Campaign Analysis - UK Fashion Store

Joan Chukwuemeka

135

Report Card

Tactical Crime Analytics

Nicolás San Marco

135

Report Card

Christmas Sales & Trends Analysis 2

Hajnalka Siflis

135

Report Card

Student Performance Power BI Report 12

Jeff Agwa

134

Report Card

Ankit singh

Ankit Singh

134

Report Card

Financial Reporting & Analysis

Msingisi Ratshana

134

Report Card

Tactical Crime Analysis - FP20 Analytics Challenge

Aditi Kathare

134

Report Card

Análisis de Tendencias Navideñas

Cynthia Marin Quiroz

134

Report Card

CRM & Sales Pipeline Analysis 5

Aravind Kontham

134

Report Card

Paralympics Games Analysis

Pratyush Majumdar

134

Report Card

Onyx Data Top 1000 Youtubers in 2023

Mayank Singh Rajawat

134

Report Card

IT Support Ticket Analysis Dashboard

Abdulafeez Fakorede

133

Report Card

Reporte Bancario

Stheven Higuita Pérez

133

Report Card

Regina onyx data challenge

Regina Onuoha

133

Report Card

RH DATA ANALYSIS

Chawki Hazam

133

Report Card

Onyx Data Challenge

Tharun R

133

  • «
  • 1
  • ...
  • 33
  • 34
  • 35
  • 36
  • 37
  • 38
  • 39
  • 40
  • 41
  • ...
  • 77
  • »
ZoomCharts

Welcome to ZoomCharts

You’re almost there! Create an account to keep your saved reports.

or
Sign up with Microsoft

Verify your email address

We have sent a code to your email address. Please input the code below.

Didn't receive code? Request again (after 30 seconds)

Already have an account? Log in

ZoomCharts

Log in to your ZoomCharts account

Log in with Microsoft
or
Forgot password?

Reset your password

We'll email you instructions on how to reset your password

Don't have an account? Sign up

logo
[email protected]
+44 204 577 3993
logo

Products

Drill Down Network PRO Drill Down Waterfall PRO Drill Down Graph PRO Drill Down Combo PRO Drill Down Combo Bar PRO Drill Down Donut PRO Drill Down Pie PRO Drill Down TimeSeries PRO Drill Down Timeline PRO Drill Down Map PRO Drill Down Scatter PRO All Visuals

Resources

Report Examples Webinars Blog ZoomCharts Academy Visuals Gallery Documentation Custom Visual Development Subscribe to News

Solutions

Custom Visual Development

Company

Pricing About Us Partners Leave feedback Join PowerGroup EU Funding

Help

ZoomCharts Assistance Contact Sales Contact Support FAQ

Drill Down Network PRO Drill Down Waterfall PRO Drill Down Graph PRO Drill Down Combo PRO Drill Down Combo Bar PRO Drill Down Donut PRO Drill Down Pie PRO Drill Down TimeSeries PRO Drill Down Timeline PRO Drill Down Map PRO Drill Down Scatter PRO All Visuals

Report Examples Webinars Blog ZoomCharts Academy Visuals Gallery Documentation Custom Visual Development Subscribe to News

Custom Visual Development

Pricing About Us Partners Leave feedback Join PowerGroup EU Funding

ZoomCharts Assistance Contact Sales Contact Support FAQ
+44 204 577 3993
[email protected]

Ready to get in touch?

Contact our experts with any question about Power BI and ZoomCharts for Free!

Contact us

© 2025, Data Visualization Software Lab

U.S. Patents No. 11,645,343; 11,921,804; 12,346,389

Cookies
Privacy Policy
Global
Legal
Patent
warning

Error message

success

Success info: Done!

ZoomCharts AI Assistant

We noticed you're using an old OS version.

For the best experience, we recommend upgrading to ensure that all website features display correctly.

Cookie settings

We use necessary cookies for site functionality, as well as statistic, marketing, and preference cookies to enhance your experience. For more information and to manage your preferences, please visit our Cookie policy