logo
For Power BI
  • Products
    • Custom Visuals for Power BI
    • Report Templates
  • Resources

      Resources

    • Documentation
    • Report Examples
    • Blog
    • Webinars
    • Video Tutorials
    • Visuals Gallery

    Support

    • ZoomCharts Assistance
    • Contact Sales
    • Contact Support
    • FAQ

    Challenges

    Challenges

    Improve your report creation skills by participating in free challenges for report creators.

    Learn more
    Get Developer License
  • Services
    • Power BI Report Development
    • Custom Visual Development
  • Challenges
  • Pricing
    • Custom Visuals for Power BI
    • Report Templates
Subscribe
Subscribe
Get it now
Go back

Contents

Contest logo
Contest logo
Contest logo
Contest logo
Try Free Now
Go back

Onyx Data June 2024 Challenge

Report Author: Lokesh Sharma

140

Marketing Campaign Dashboard

Report
Report Interact

Pie Timeline Sales Marketing

Share template with others

Report submitted for OnyxData #DataDNA and ZoomCharts Challenge June 2024. The report was built with the Marketing Campaing Dataset and includes ZoomCharts custom Drill Down PRO visuals for Power BI.

Author's description:

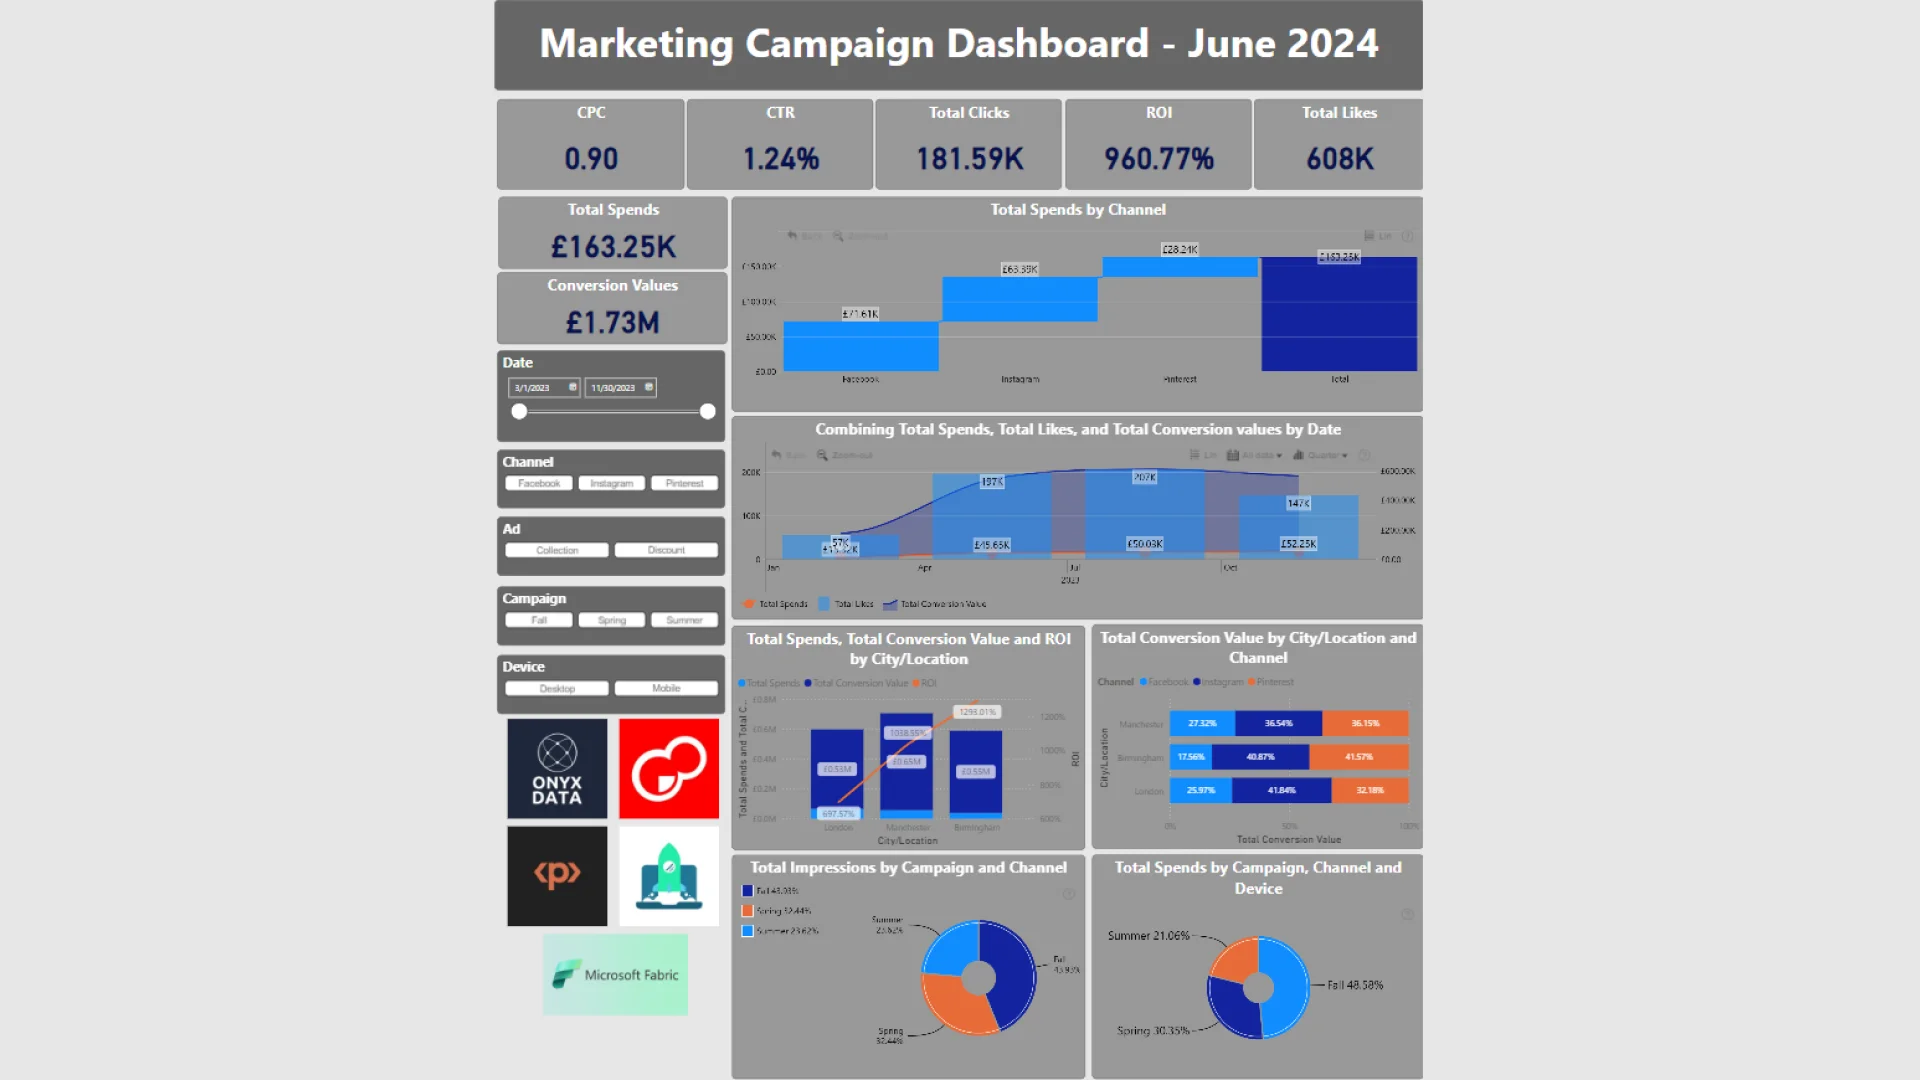
Exciting news! I'm thrilled to share the latest insights from our marketing campaign dashboard, which has been instrumental in driving our strategic decisions and optimizing performance. Our new dashboard highlights key performance indicators (KPIs) and provides a comprehensive view of our campaign’s impact across various dimensions. Here’s a closer look at what we’re tracking:

Key Performance Indicators:

  1. Total Spends: Monitors overall budget allocation to ensure strategic investment.
  2. Total Conversion Values: Measures the value generated from conversions to assess campaign effectiveness.
  3. ROI (Return on Investment): Evaluates financial return relative to marketing costs.
  4. Total Likes: Provides insights into audience engagement and content interaction.

Visual Insights:

  1. Total Spends By Channel: Breaks down investments across channels to align with strategic goals.
  2. Total Spends By Campaign: Analyzes campaign-specific spends for efficiency and effectiveness.
  3. Channel and Device Performance: Optimizes content across platforms based on device-specific performance.
  4. Combined Analysis Over Time: Tracks spends, conversion values, and likes to gauge temporal trends.
  5. Geographic Insights: Evaluates regional performance to tailor strategies for maximum impact.
  6. Location and Channel Conversion Analysis: Identifies high-value conversion areas by combining location and channel data.

I've utilized multiple ZoomCharts in this report, allowing us to drill down into charts for detailed analysis.

ZoomCharts visuals used

Drill Down Pie PRO Drill Down Pie PRO
Drill Down Timeline PRO Drill Down Timeline PRO

Need help?

Send your question to ZoomCharts assistant, and we will respond to you as soon as possible.

Contact Us

Mobile view allows you to interact with the report. To Download the template please switch to desktop view.

Report Overhaul

ZoomCharts Academy

Learn ZoomCharts with experts and become certified!

Go to Academy!
Report Overhaul

Was this helpful? Thank you for your feedback!

Sorry about that.

How can we improve it?

Marketing Campaign Dashboard

Share

ZoomCharts

Welcome to ZoomCharts

You’re almost there! Create an account to keep your saved reports.

or
Sign up with Microsoft

Verify your email address

We have sent a code to your email address. Please input the code below.

Didn't receive code? Request again (after 30 seconds)

Already have an account? Log in

ZoomCharts

Log in to your ZoomCharts account

Log in with Microsoft
or
Forgot password?

Reset your password

We'll email you instructions on how to reset your password

Don't have an account? Sign up

Please add credits

You have 0 available downloads.
Get more credits or upgrade your plan to continue.

View pricing
logo
[email protected]
+44 204 577 3993
logo

Products

Drill Down Network PRO Drill Down Waterfall PRO Drill Down Graph PRO Drill Down Combo PRO Drill Down Combo Bar PRO Drill Down Donut PRO Drill Down Pie PRO Drill Down TimeSeries PRO Drill Down Timeline PRO Drill Down Map PRO Drill Down Scatter PRO All Visuals

Resources

Report Examples Webinars Blog ZoomCharts Academy Visuals Gallery Documentation Custom Visual Development Subscribe to News

Solutions

Custom Visual Development

Company

Pricing About Us Partners Leave feedback Join PowerGroup EU Funding

Help

ZoomCharts Assistance Contact Sales Contact Support FAQ

Drill Down Network PRO Drill Down Waterfall PRO Drill Down Graph PRO Drill Down Combo PRO Drill Down Combo Bar PRO Drill Down Donut PRO Drill Down Pie PRO Drill Down TimeSeries PRO Drill Down Timeline PRO Drill Down Map PRO Drill Down Scatter PRO All Visuals

Report Examples Webinars Blog ZoomCharts Academy Visuals Gallery Documentation Custom Visual Development Subscribe to News

Custom Visual Development

Pricing About Us Partners Leave feedback Join PowerGroup EU Funding

ZoomCharts Assistance Contact Sales Contact Support FAQ
+44 204 577 3993
[email protected]

Ready to get in touch?

Contact our experts with any question about Power BI and ZoomCharts for Free!

Contact us

© 2025, Data Visualization Software Lab

U.S. Patents No. 11,645,343; 11,921,804; 12,346,389

Cookies
Privacy Policy
Global
Legal
Patent
warning

Error message

success

Success info: Done!

ZoomCharts AI Assistant

We noticed you're using an old OS version.

For the best experience, we recommend upgrading to ensure that all website features display correctly.

Cookie settings

We use necessary cookies for site functionality, as well as statistic, marketing, and preference cookies to enhance your experience. For more information and to manage your preferences, please visit our Cookie policy