Registration Open
Registration Open
03 August | 11:53
-

Reset your password
We'll email you instructions on how to reset your password

Analyze global sales performance across regions, products, channels, and customer segments using Power BI. Build an interactive executive-ready report that helps sales leaders monitor sales & revenue growth
Workshop | Workshop: How to create Sales Performance Dashboard in Power BI
Workshop | Workshop: How to create Sales Performance Dashboard in Power BI
07 August | 07:00
-
Webinar | Best Sales Dashboards in Power BI: ZoomCharts Challenge Top 5
Webinar | Best Sales Dashboards in Power BI: ZoomCharts Challenge Top 5
27 August | 11:00
03 August - 23 August
Improve your Power BI data visualization skills and demonstrate strong professional credibility by building 4U Reports.
In this challenge, you’ll be provided with a business case dataset to analyze and visualize in Power BI. Each month, a new dataset is released, allowing you to build high-demand Power BI reports and dashboards for your portfolio, gain recognition within a community of 20k+ BI professionals, and win amazing prizes from ZoomCharts.
🏆 The best 3 overall reports will receive a $300 / $200 / $100 Amazon gift card.
Being selected in the Top 5 will grant you +10 free downloads from the Power BI Report Gallery.
On August 27, the top 5 reports and prize winners will be announced during the Live Webinar.

Follow these steps to register, build your Power BI report, submit your entry, and compete for prizes.
Upload your report in .pbix format using the submission form on this page.
If your report does not meet the challenge requirements:
You will receive an email explaining what needs to be fixed. You can update your report and submit it again.
Validation timeline:
Note: You can resubmit your entry as many times as needed before the final deadline.
The ZoomCharts team reviews and analyzes the Top 5 Mini Challenge entries during the live webinar. You will learn best practices, improvement tips, and see how others solved the challenge. Winners will be announced during the live webinar and afterward on the ZoomCharts LinkedIn page.
ZoomCharts 4U Report Challenge August 2026
Tool
Power BI
Recommended length
Up to 3 pages
Including drill-through pages
Canvas size
16:9 or 1920 x 1080
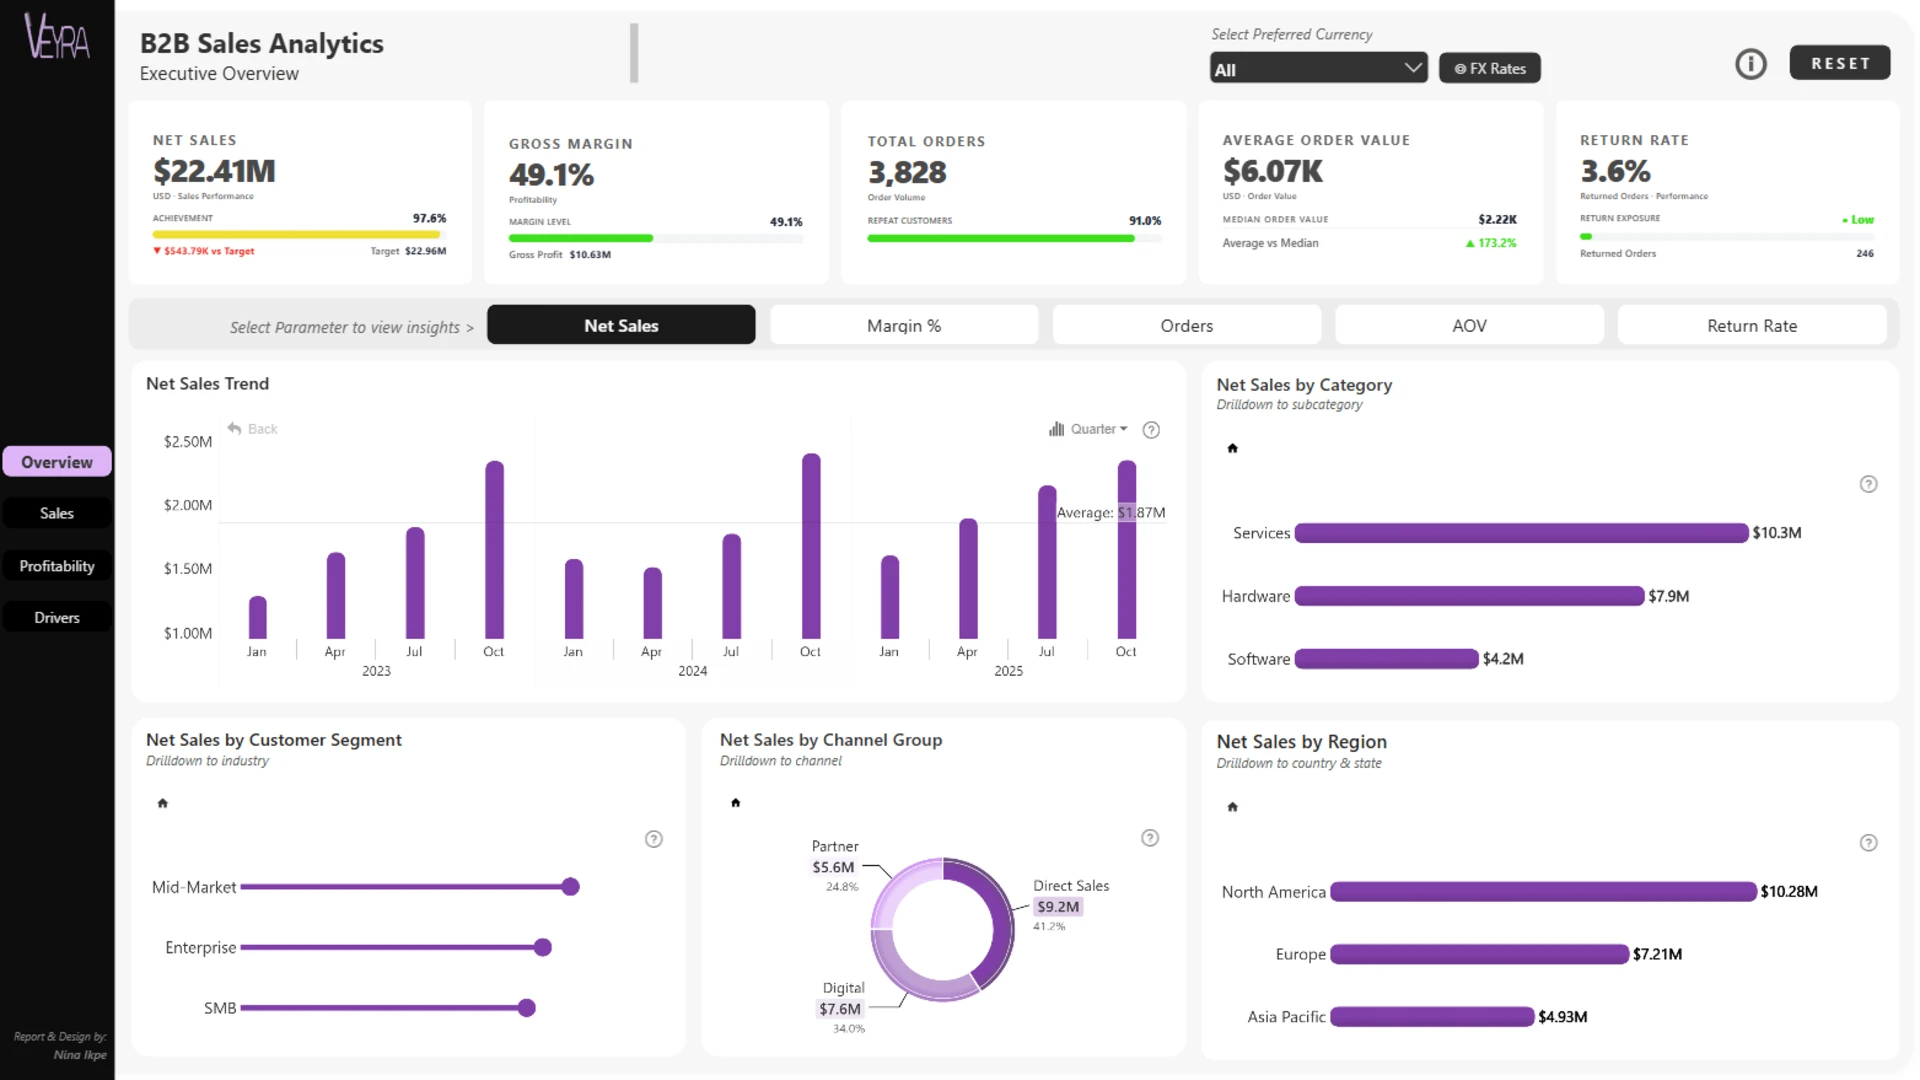
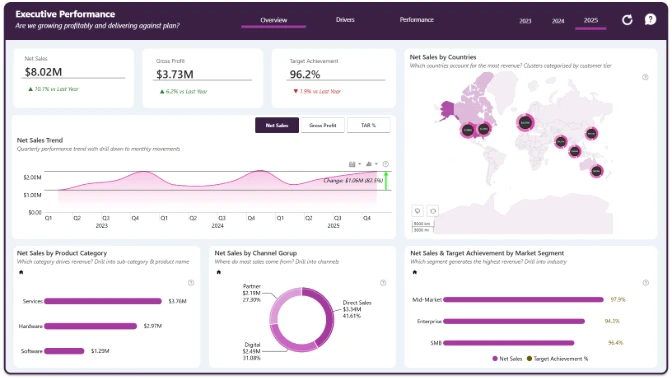
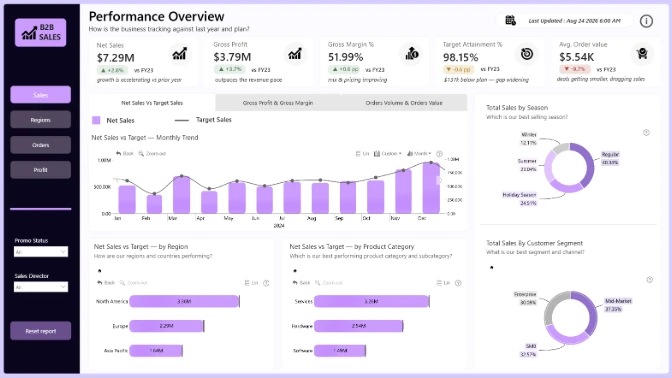
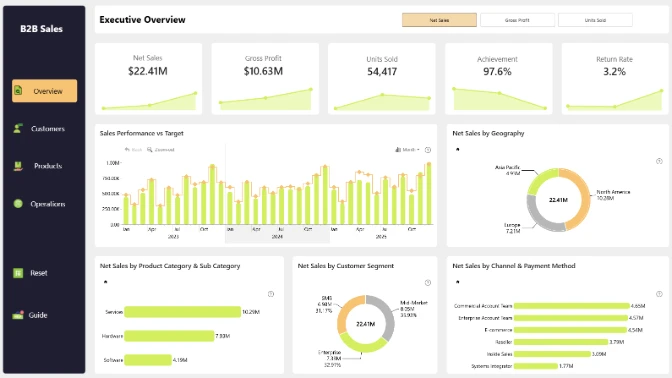
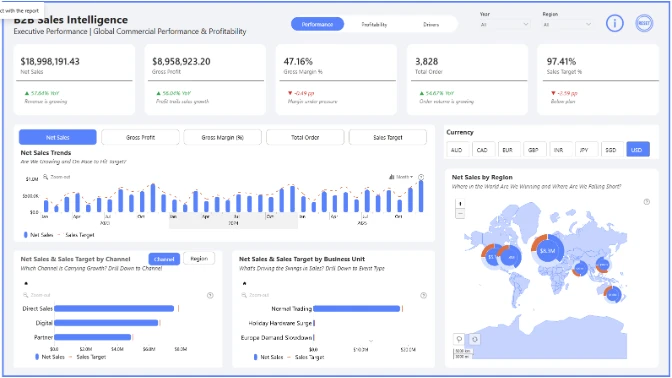
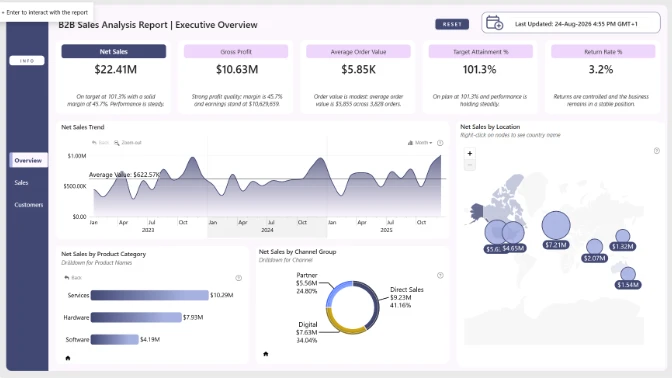
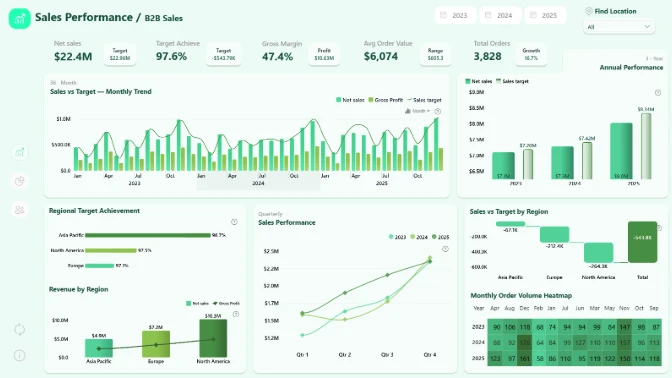
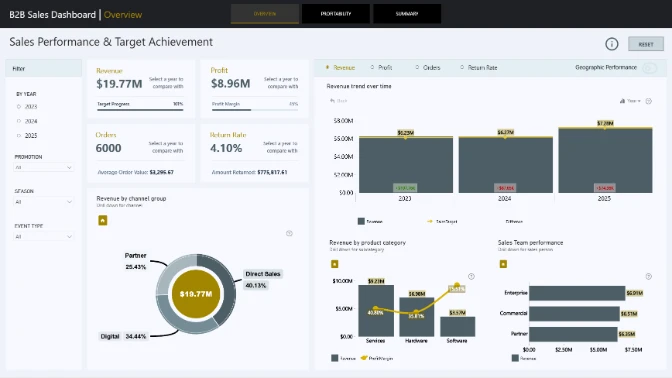
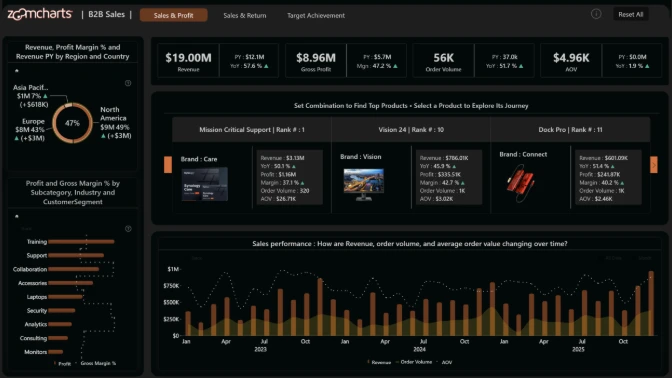
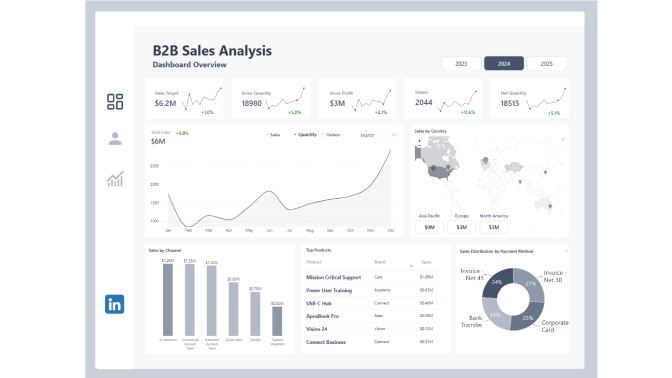
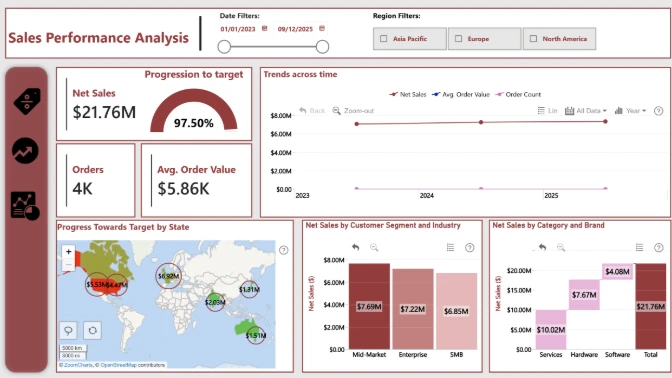
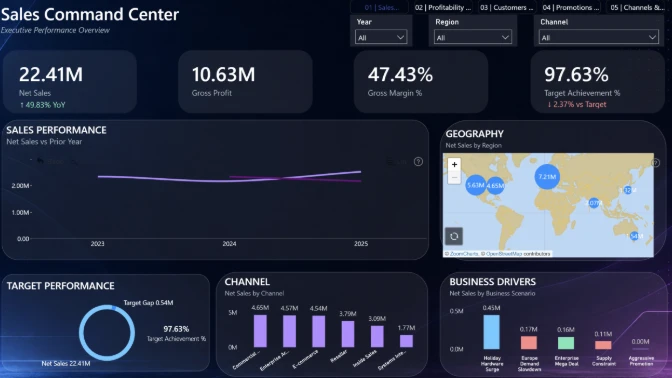
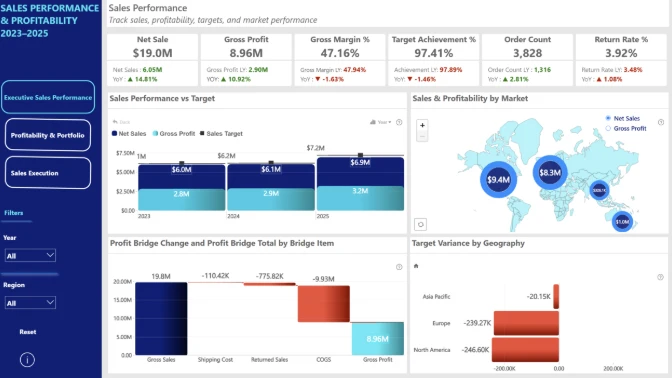
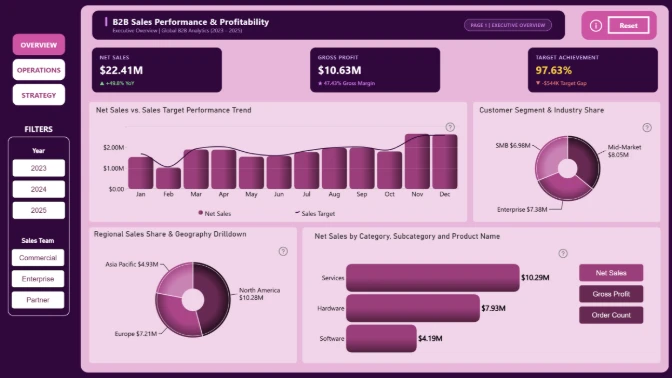
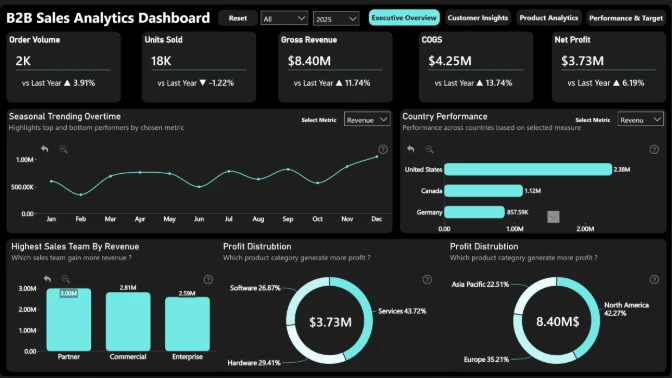
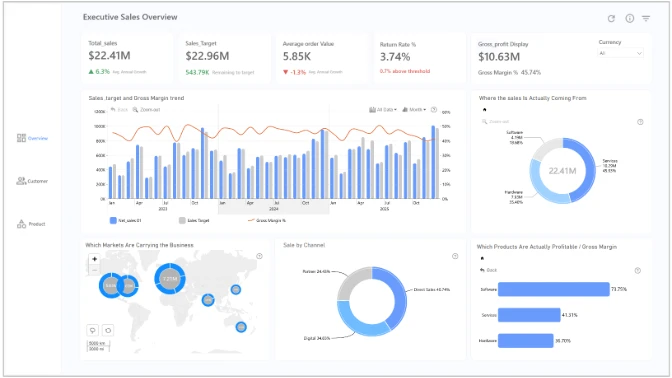
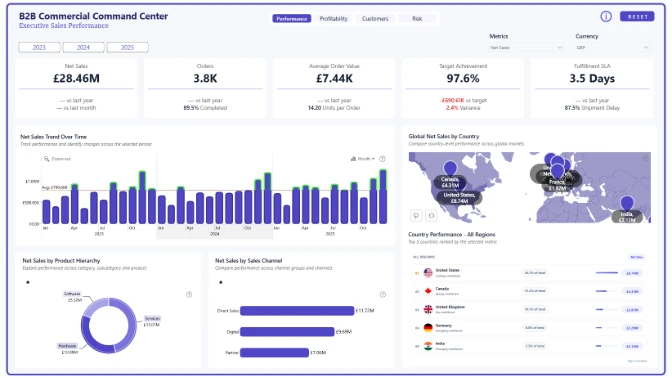
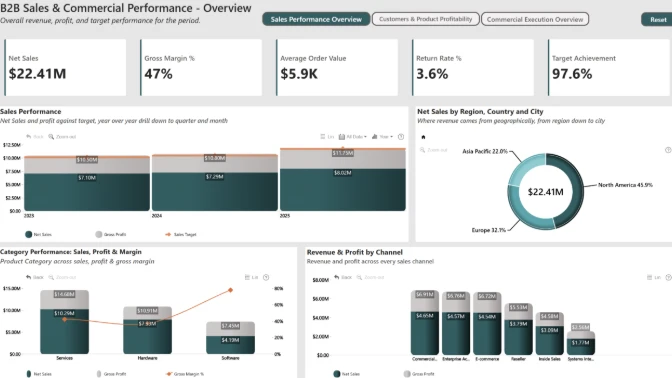
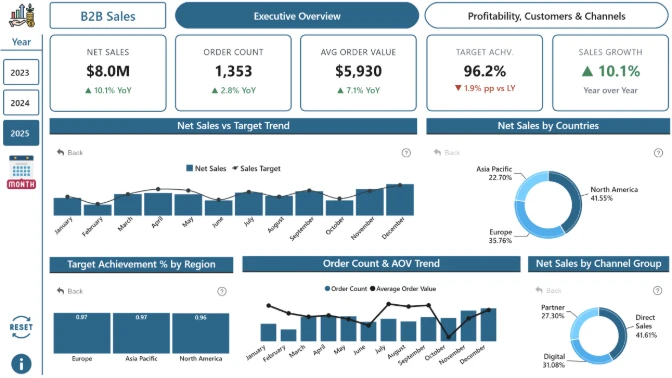
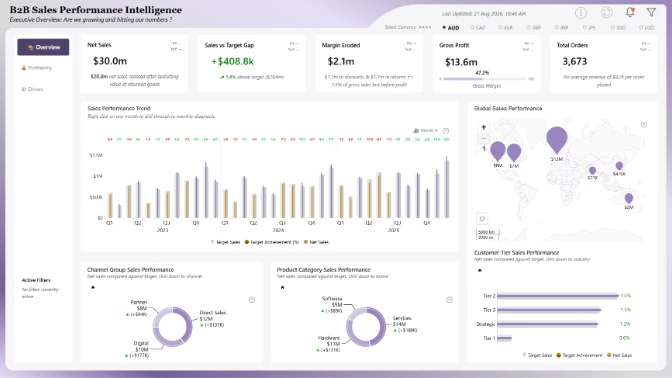
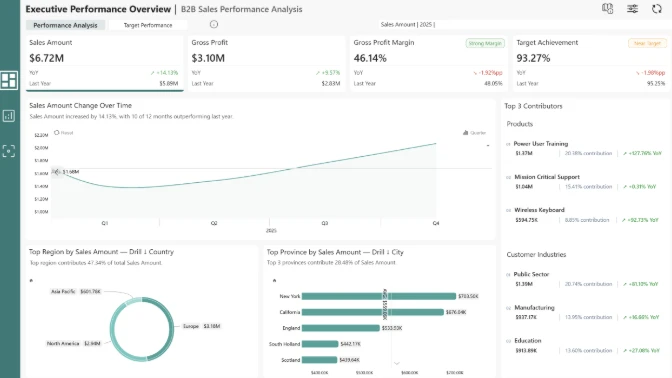
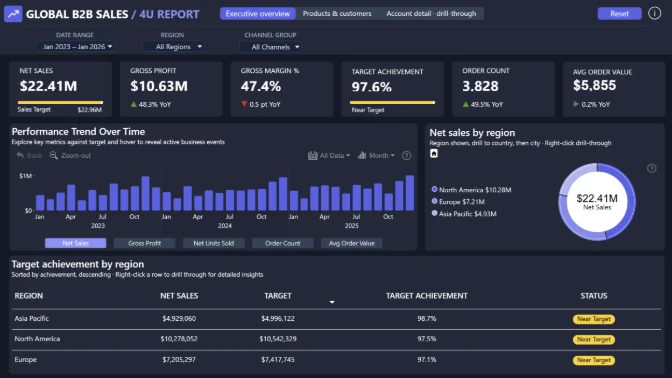
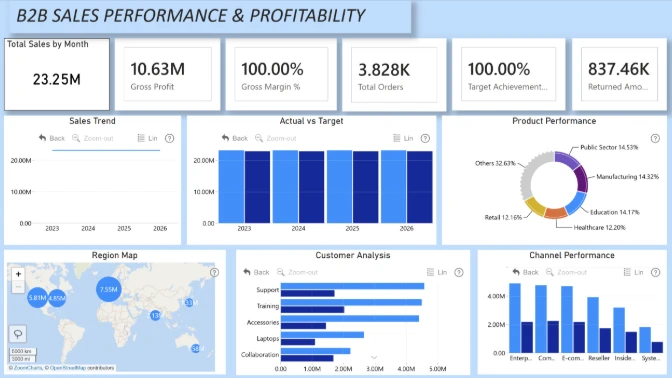
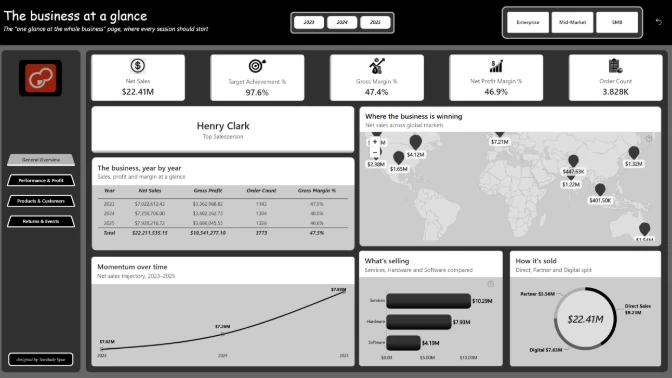
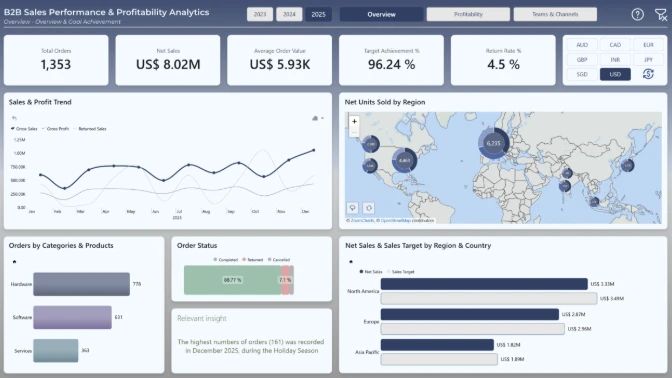
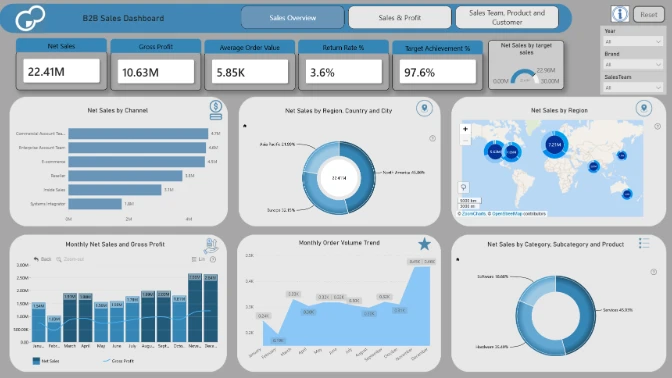
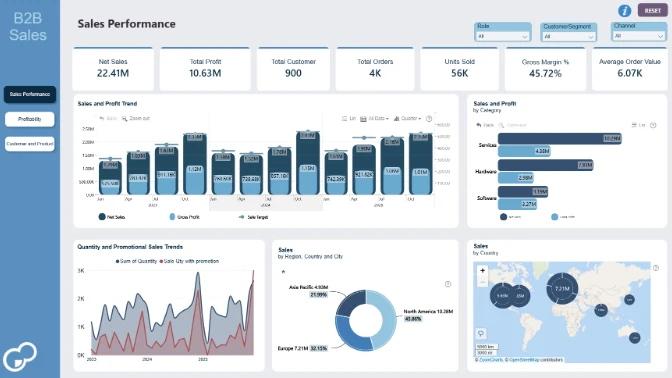
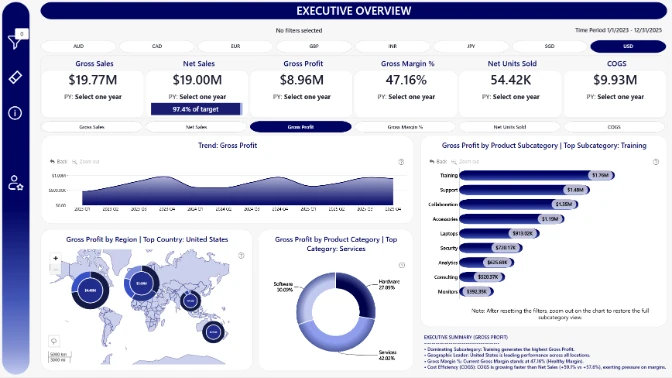
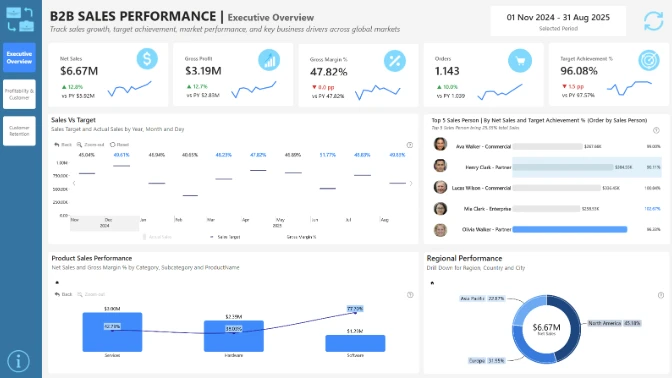
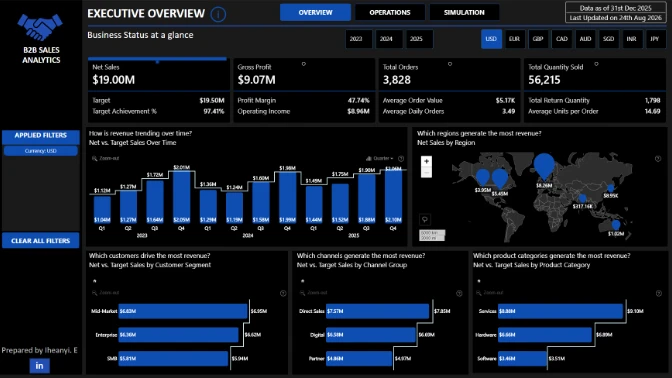
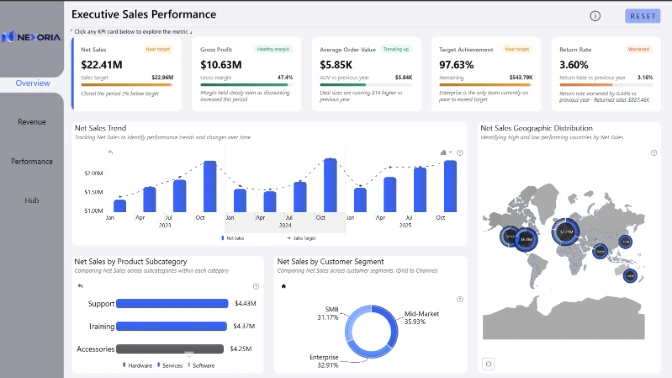
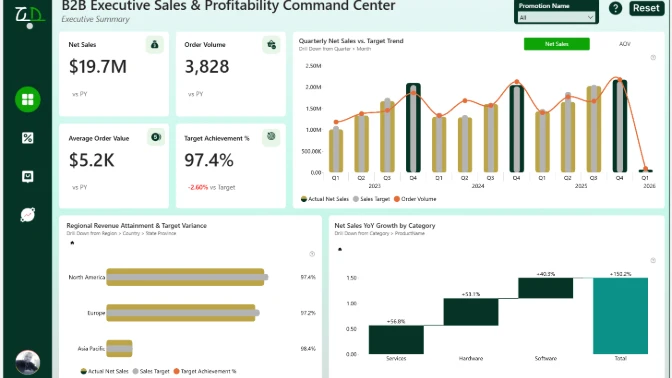
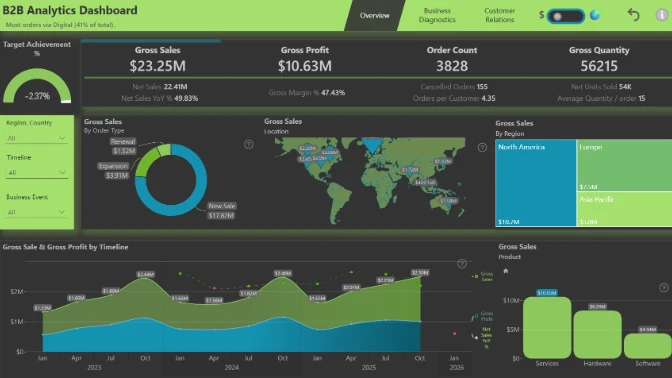
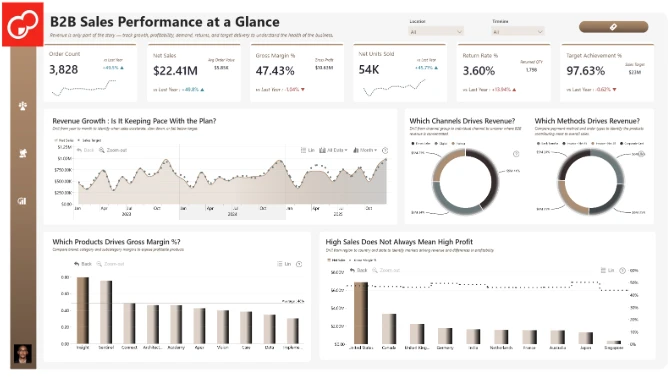
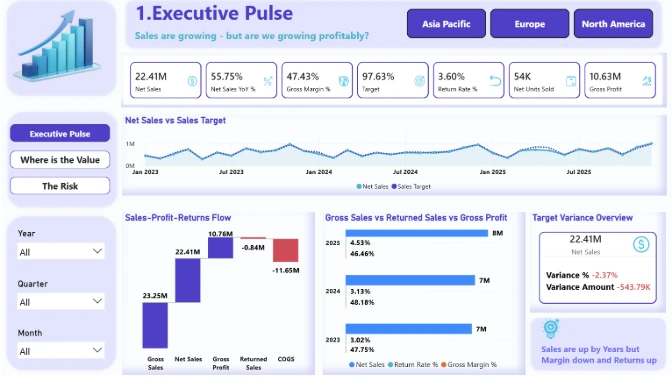
Build an interactive Power BI B2B sales dashboard that helps business leaders understand revenue performance, profitability, target achievement, customer behavior, and the factors driving results across global markets.
In this ZoomCharts Power BI Challenge, participants will work with a global B2B sales dataset covering 6,000 sales records from 2023 to 2025. The data includes customers, products, sales teams, channels, promotions, targets, costs, returns, currencies, and business events across North America, Europe, and Asia Pacific.
The goal is to design a clear, decision-ready B2B sales analytics report that helps stakeholders monitor business performance, compare actual sales against targets, identify profitable products and customer segments, and understand the reasons behind changes in revenue, margin, and returns.
Sales performance
How are net sales, order volume, and average order value changing over time?
Profitability
Which products, regions, and customer segments generate the strongest gross profit and margin?
Target achievement
Where is the business exceeding or falling behind its sales targets?
Customers and products
Which customer segments, industries, product categories, and brands are driving B2B sales results?
Channels and sales teams
How do direct, partner, and digital channels compare, and which teams or salespeople perform best?
Returns and business events
Where are returns affecting performance, and how do promotions, seasonal peaks, supply constraints, or market changes influence sales?
Combine B2B sales data storytelling with intuitive Power BI report design. Use ZoomCharts Drill Down visuals to help users explore performance over time, compare markets and business segments, and move smoothly from executive KPIs to detailed insights about products, customers, channels, sales teams, and profitability.
Each submission is evaluated based on four main criteria: Inspiring, Intuitive, Interactive, and Insightful. These dimensions ensure that the solution is visually compelling, easy to understand, engaging to use, and capable of delivering valuable insights.
How visually clear, modern, and purposeful the report looks.
How clear and easy it is to understand the report at a glance.
How engaging and seamless the report exploration and interaction with data feels.
How accurate, complete, and meaningful the data is in driving decisions.
Workshop | Workshop: How to create Sales Performance Dashboard in Power BI
Workshop | Workshop: How to create Sales Performance Dashboard in Power BI
07 August | 07:00
-
Webinar | Best Sales Dashboards in Power BI: ZoomCharts Challenge Top 5
Webinar | Best Sales Dashboards in Power BI: ZoomCharts Challenge Top 5
27 August | 11:00
03 August - 23 August