357
Power BI Revenue Growth Dashboard
Power BI Revenue Growth Dashboard
More Report pages
Report Author: chetanpabbarthi
357
Share template with others
This Power BI Revenue Growth Dashboard gives executives a complete view of B2B sales growth, profitability, customers, promotions, channels, sales teams, and target achievement.
The report combines Net Sales, Gross Profit, Gross Margin, Average Order Value, Return Rate, Target Achievement, regional performance, customer mix, product profitability, and sales force performance in one interactive analysis.
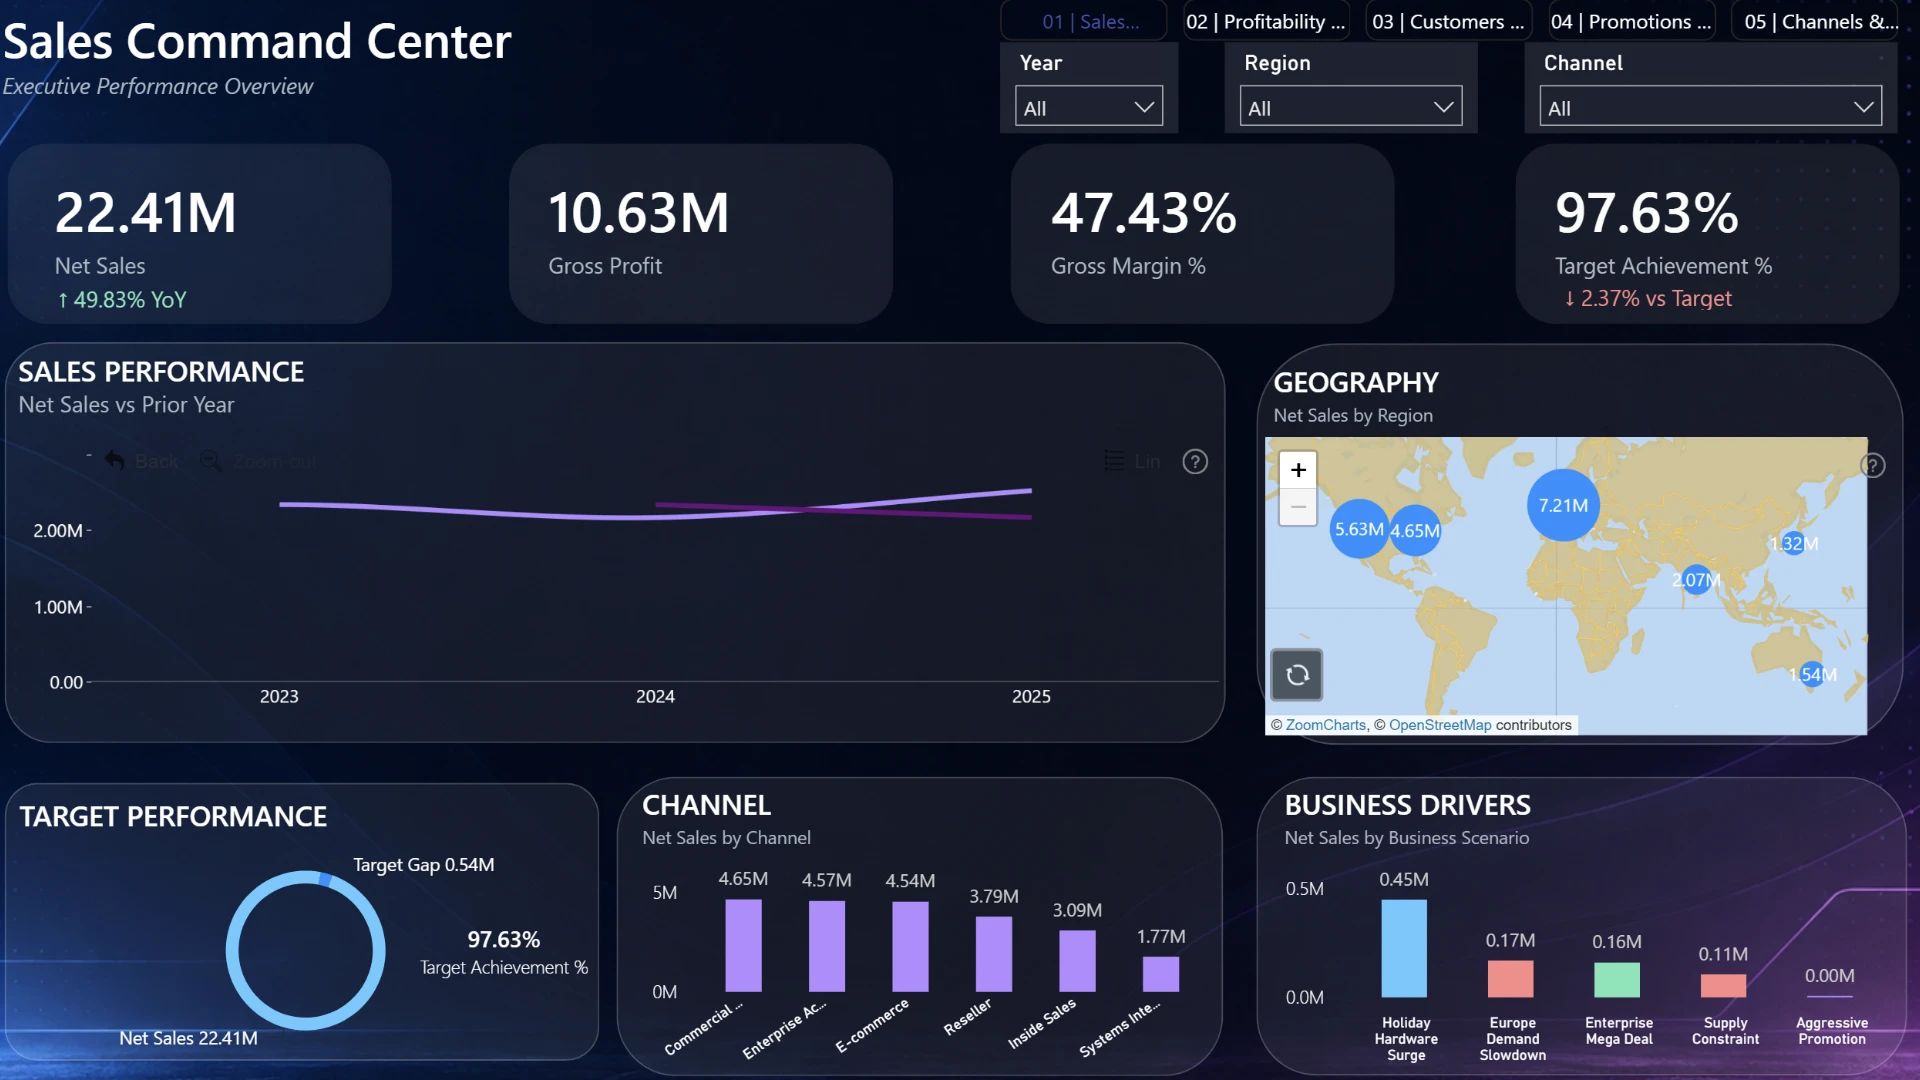
Sales Command Center
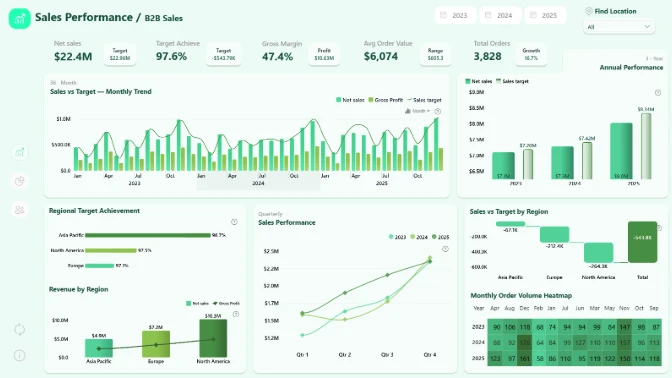
The Sales Command Center provides an executive overview of overall business performance and shows how revenue is changing across time, regions, channels, targets, and major business drivers.
- Track Net Sales, Gross Profit, Gross Margin %, and Target Achievement %.
- Compare Net Sales with the prior year to understand revenue growth over time.
- Analyze geographic performance using Net Sales by Region.
- Monitor the target gap and overall target achievement.
- Compare Net Sales across major sales channels.
- Identify the impact of key business scenarios and operational events on sales.
Profitability & Products
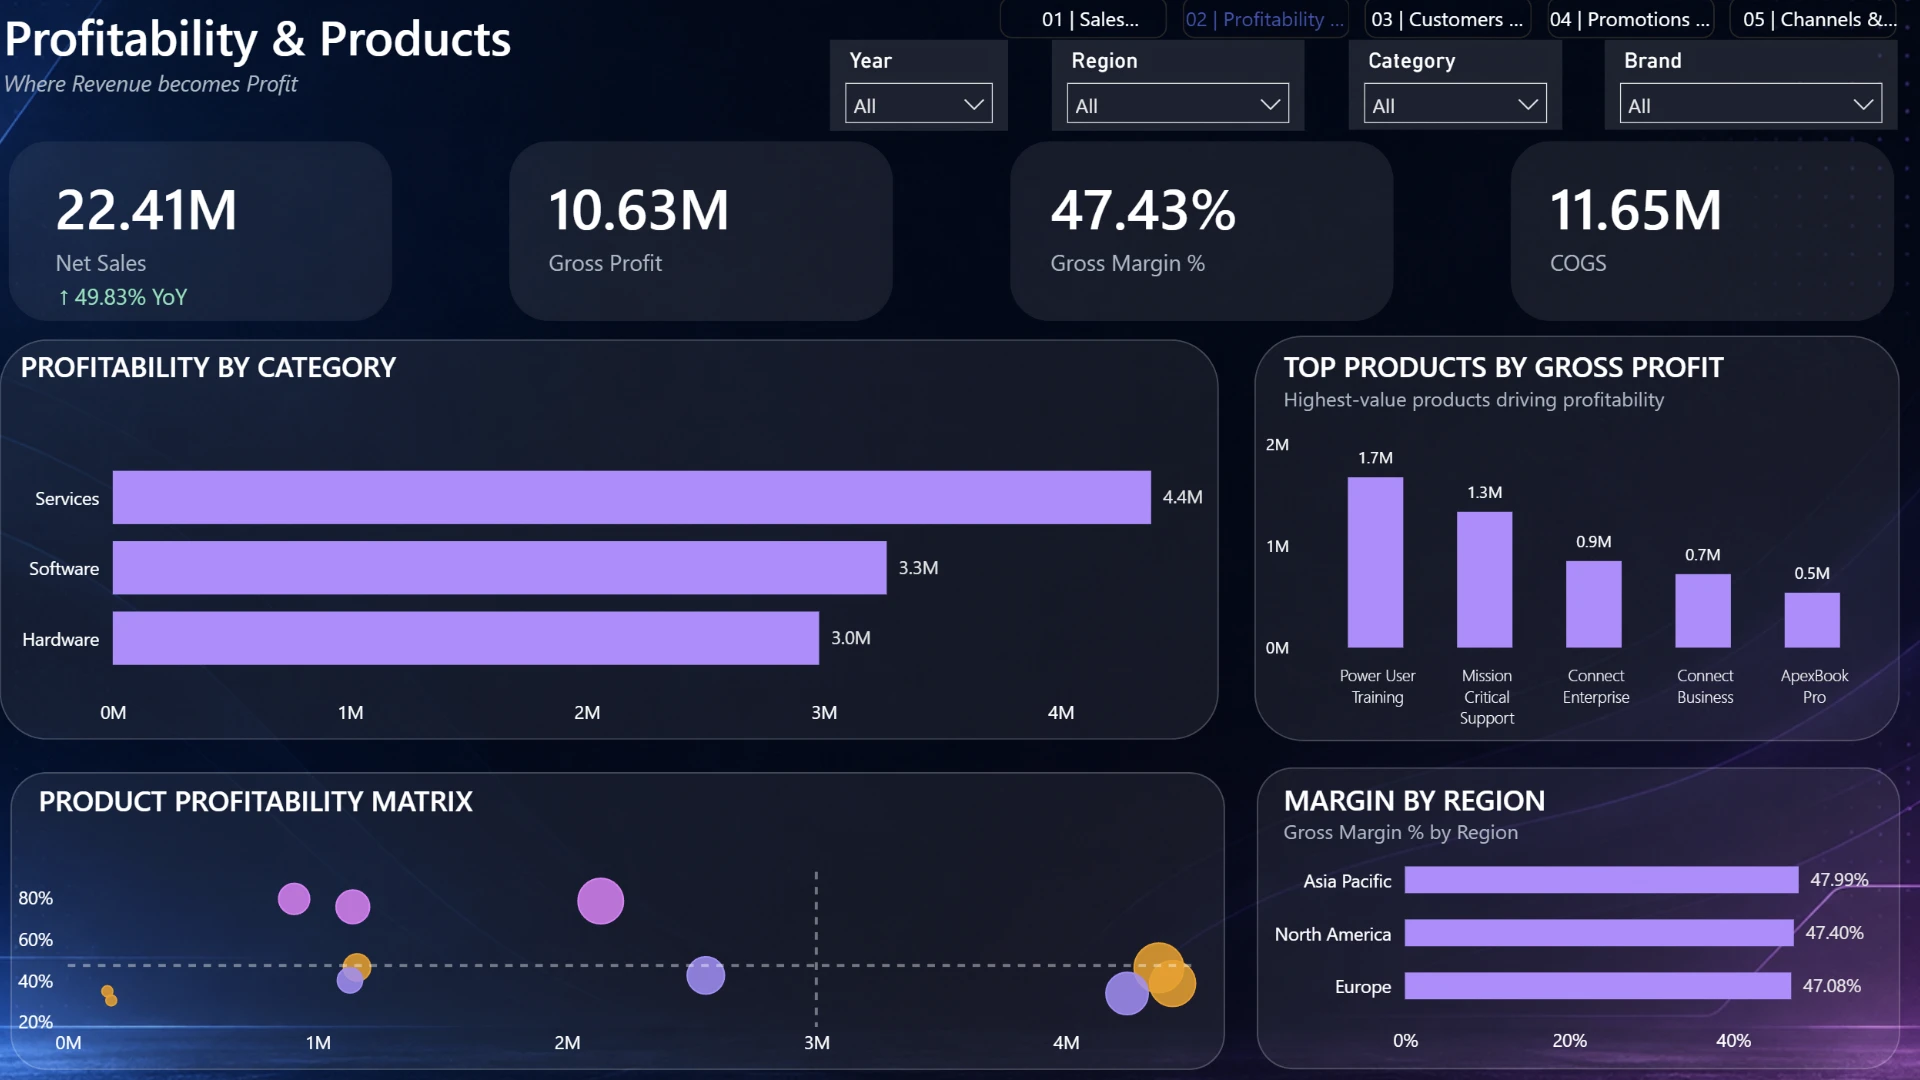
The Profitability & Products page shows where revenue becomes profit by comparing categories, products, margins, costs, and regional profitability.
- Track Net Sales, Gross Profit, Gross Margin %, and COGS.
- Compare Gross Profit across Services, Software, and Hardware.
- Identify the top products by Gross Profit.
- Use the Product Profitability Matrix to compare products by sales and margin performance.
- Compare Gross Margin % by region to identify stronger and weaker profitability markets.
- Filter performance by year, region, category, and brand.
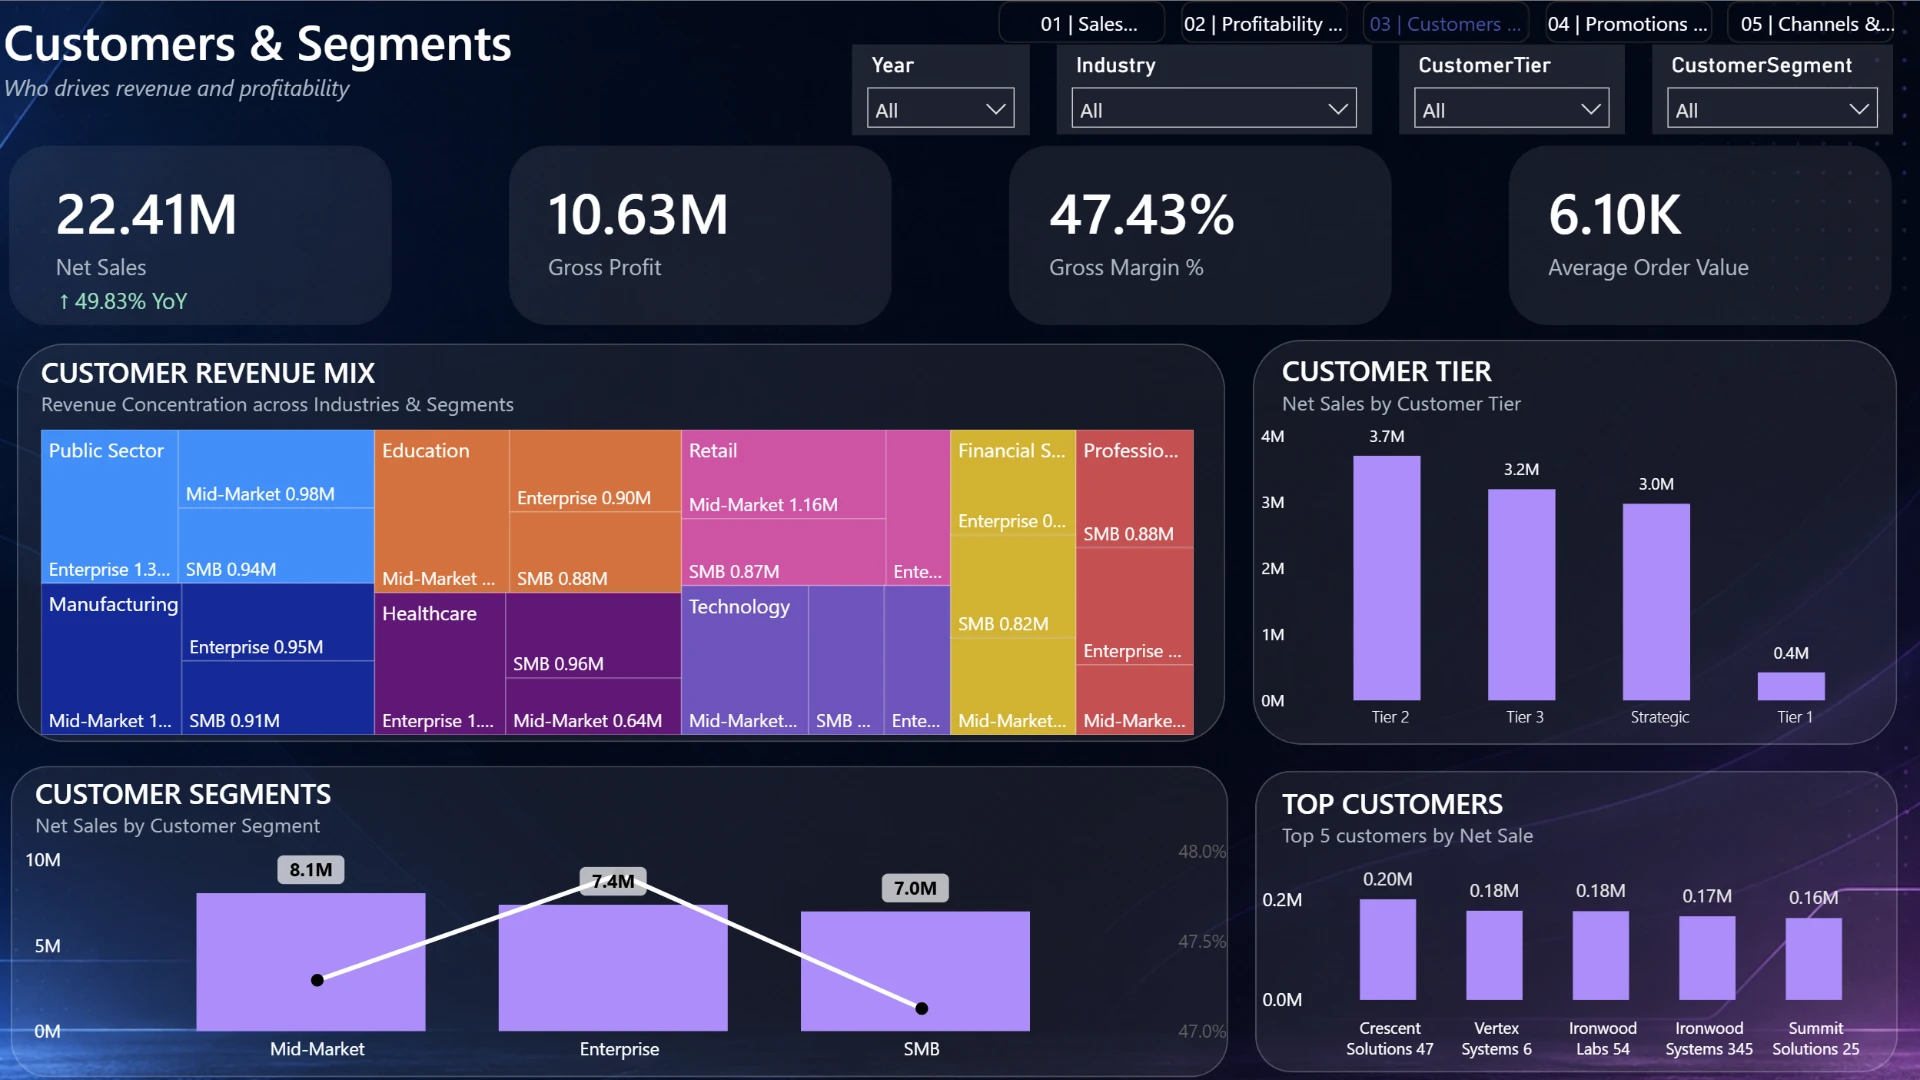
Customers & Segments
The Customers & Segments page explains who drives revenue and profitability by analyzing customer industries, market segments, customer tiers, and individual accounts.
- Track Net Sales, Gross Profit, Gross Margin %, and Average Order Value.
- Explore the Customer Revenue Mix across industries and customer segments.
- Compare Net Sales across different customer tiers.
- Analyze revenue and profitability across Mid-Market, Enterprise, and SMB segments.
- Identify the top customers by Net Sales.
- Filter analysis by industry, customer tier, customer segment, and year.
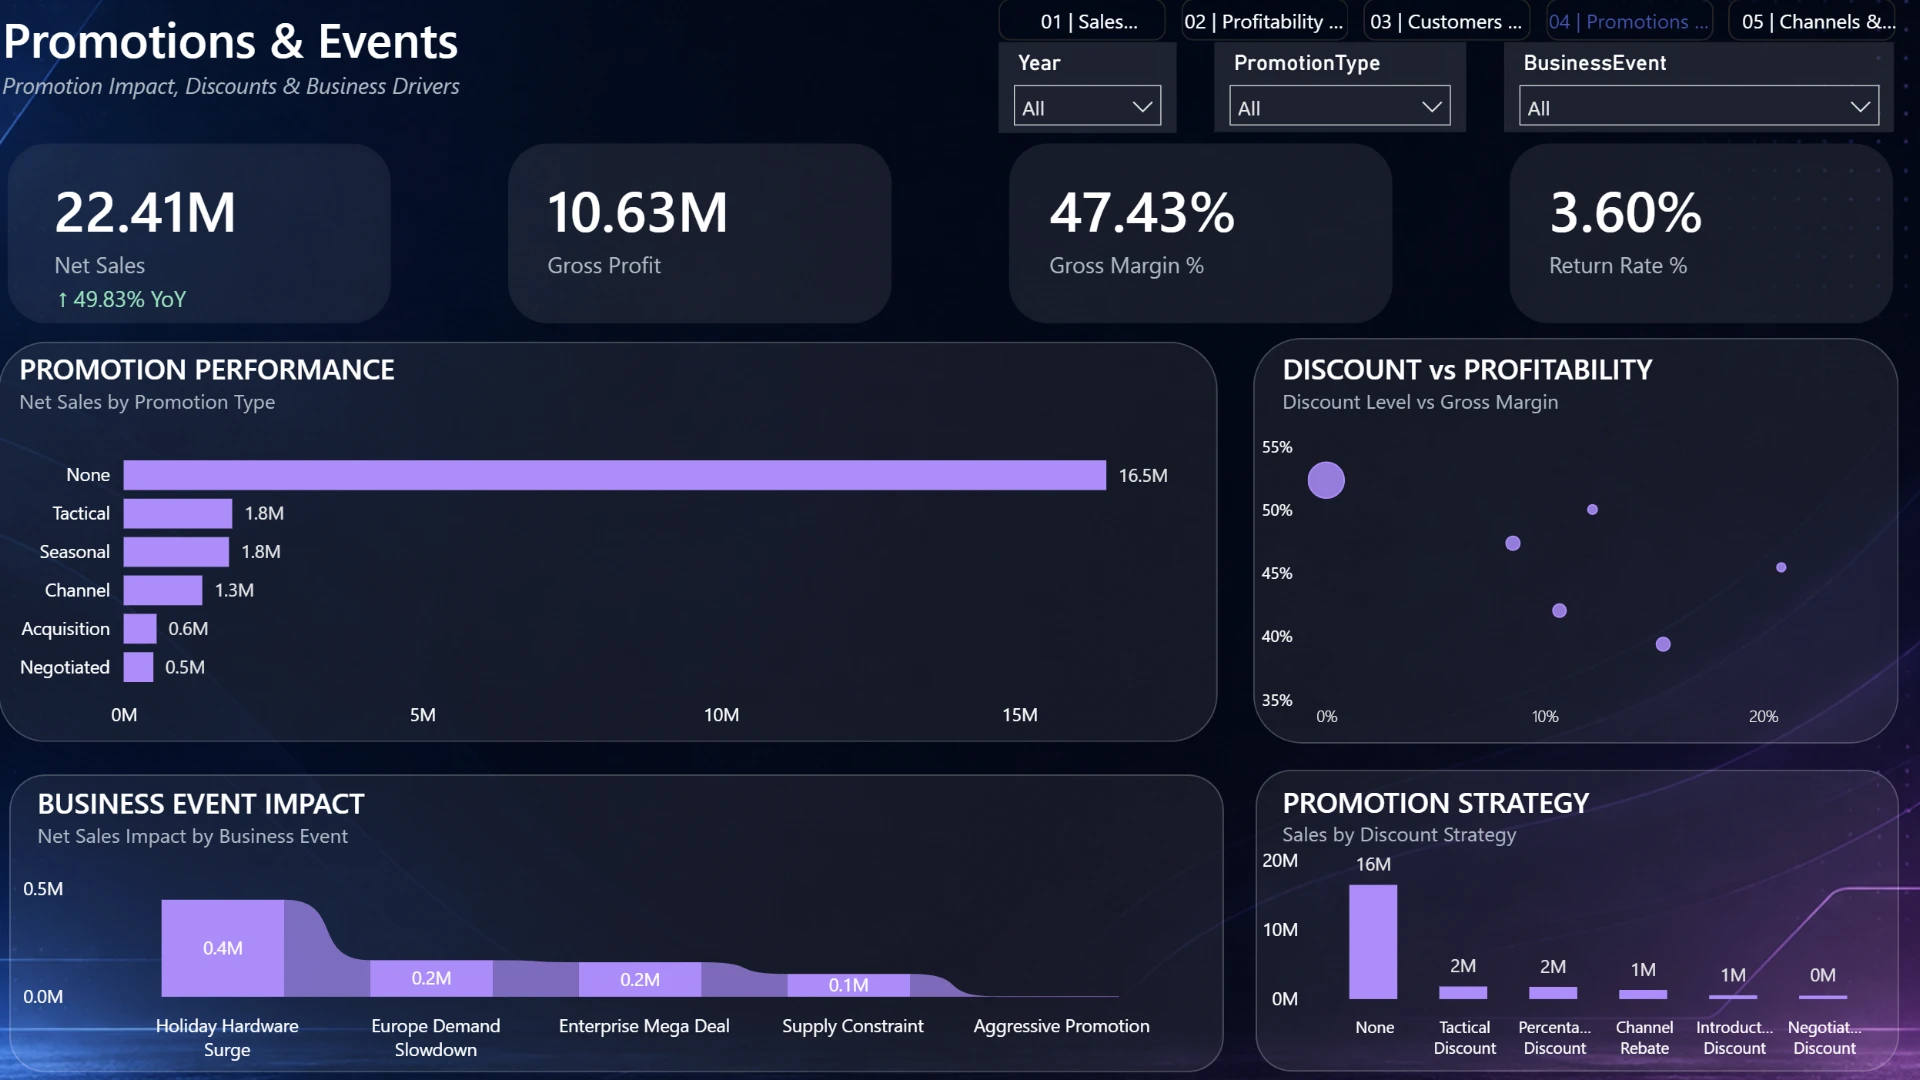
Promotions & Events
The Promotions & Events page evaluates how discounts, promotion strategies, and external business events affect sales, profitability, and return behavior.
- Track Net Sales, Gross Profit, Gross Margin %, and Return Rate %.
- Compare Net Sales by promotion type.
- Analyze the relationship between discount level and Gross Margin.
- Evaluate the sales impact of major business events.
- Compare sales across different discount strategies.
- Filter the analysis by year, promotion type, and business event.
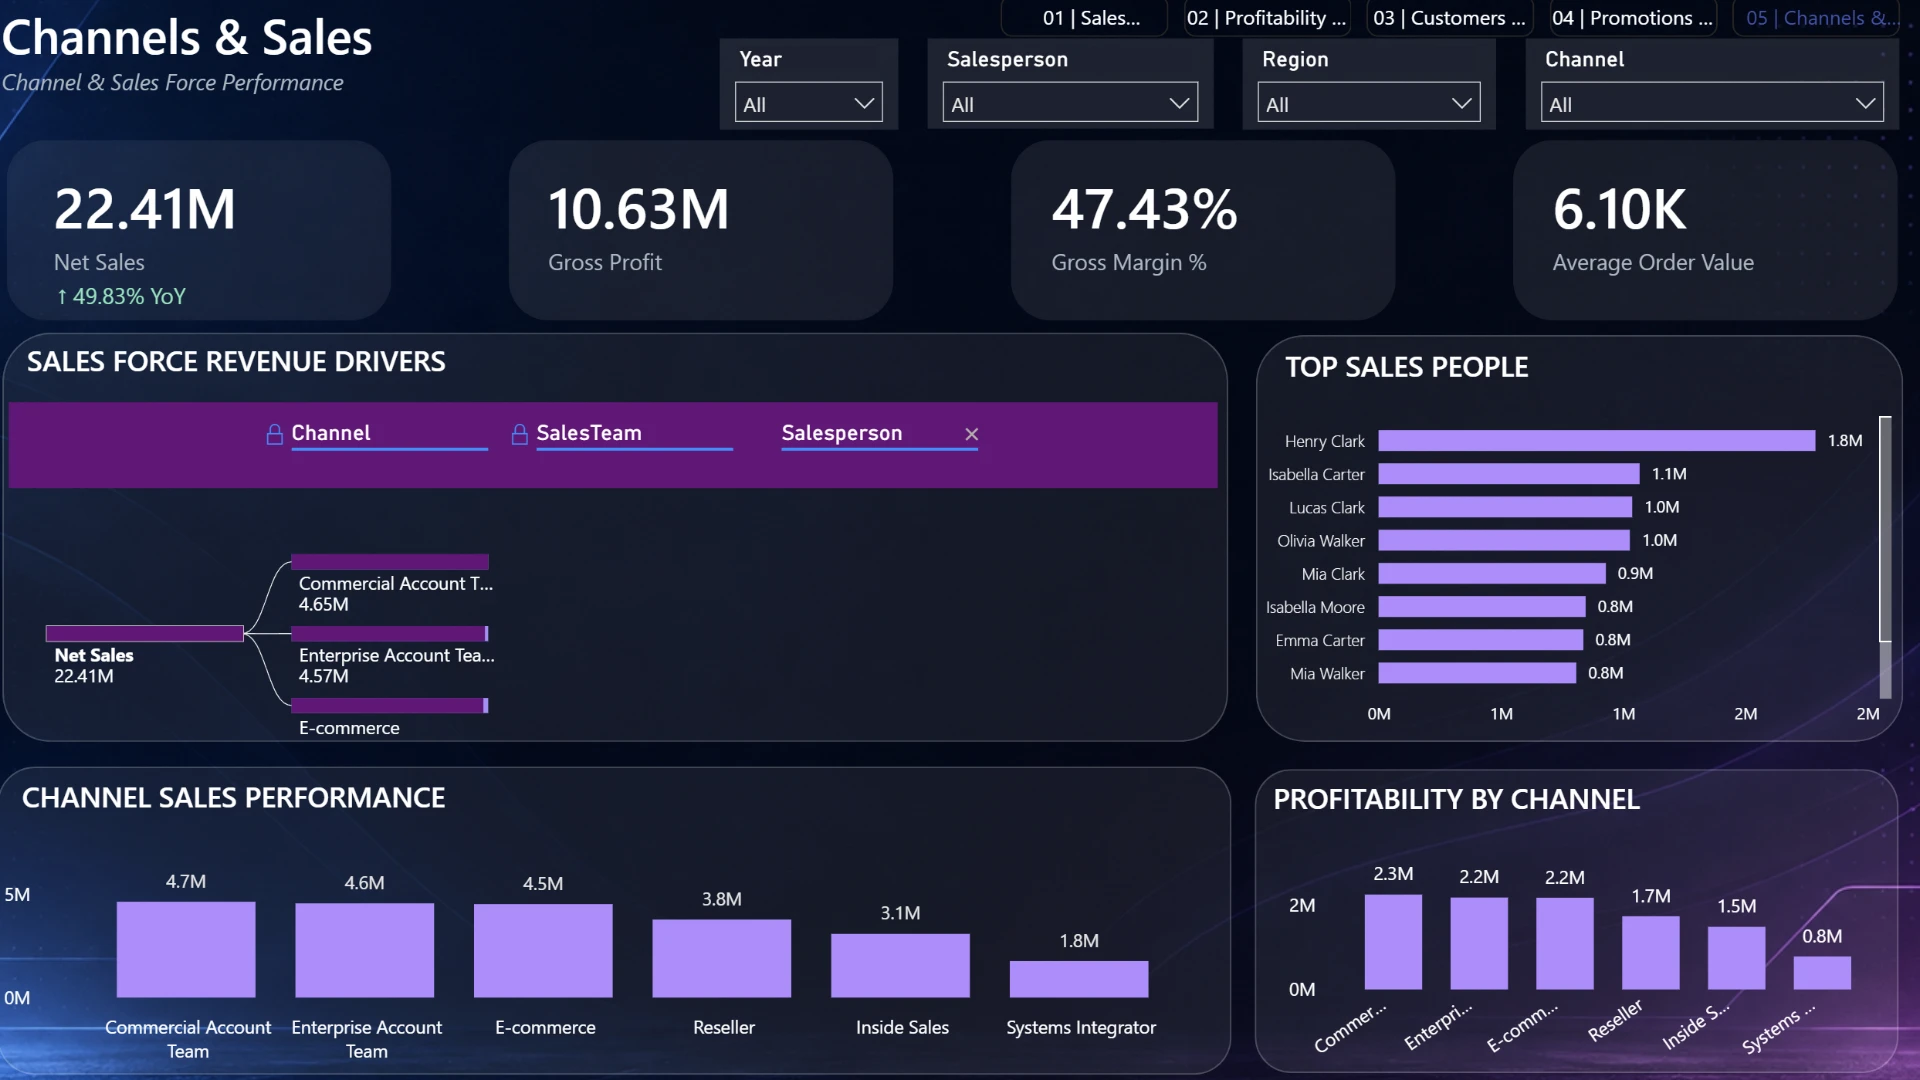
Channels & Sales
The Channels & Sales page analyzes channel performance, sales teams, individual salespeople, and profitability across the sales organization.
- Track Net Sales, Gross Profit, Gross Margin %, and Average Order Value.
- Explore revenue drivers across the hierarchy of Channel, Sales Team, and Salesperson.
- Identify the top salespeople by Net Sales.
- Compare Net Sales by channel and sales team.
- Analyze Gross Profit by channel to compare sales contribution with profitability.
- Filter performance by year, salesperson, region, and channel.
Interactive Exploration
The report is structured as an executive command center with dedicated pages for sales, profitability, customers, promotions, and channels, allowing users to move from high-level KPIs into detailed business analysis.
- Filter analysis by year, region, channel, product category, brand, customer segment, and salesperson.
- Compare revenue, profitability, and target performance from multiple business perspectives.
- Explore relationships between sales growth, margins, discounts, customers, channels, and business events.
- Move from executive KPIs into detailed product, customer, channel, and salesperson performance.


4U Report Challenges
Participate in data challenges, build and submit reports to get free template downloads.
Join CommunityMobile view allows you to interact with the report. To Download the template please switch to desktop view.
How to use a PBIX template
Preview the interactive report, download the PBIX file, open it in Power BI Desktop, and replace the same data connection with your own dataset.
Preview and download
Explore the report online and download the PBIX template file.
Open in Power BI Desktop
Open the downloaded PBIX file in Power BI Desktop.
Connect your data
Replace the sample data source with your own dataset.
Refresh and adjust
Refresh the model and update fields or visual were needed.
Save and share
Save your report and publish it for your audience.


