423
B2B Executive Power BI Dashboard
B2B Executive Power BI Dashboard
More Report pages
Report Author: Gbenga Emmanuel Popoola
423
Share template with others
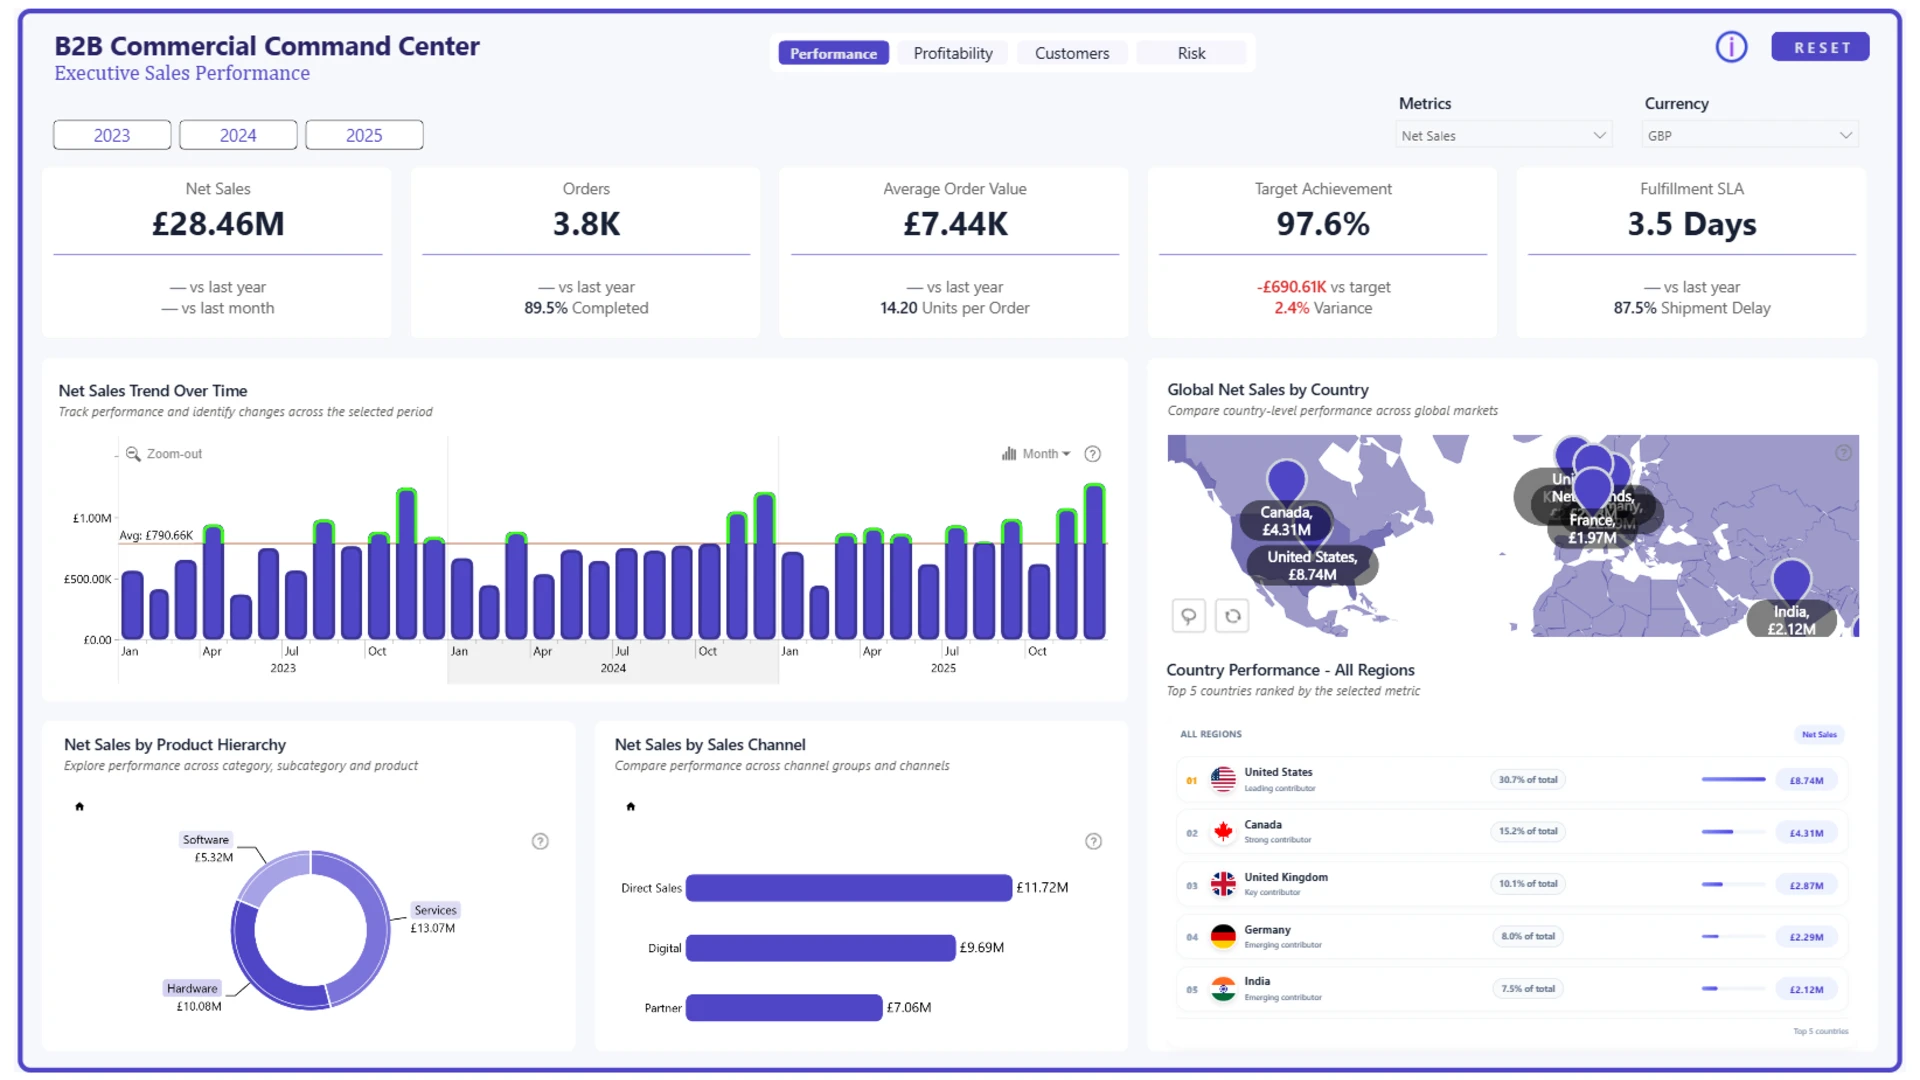
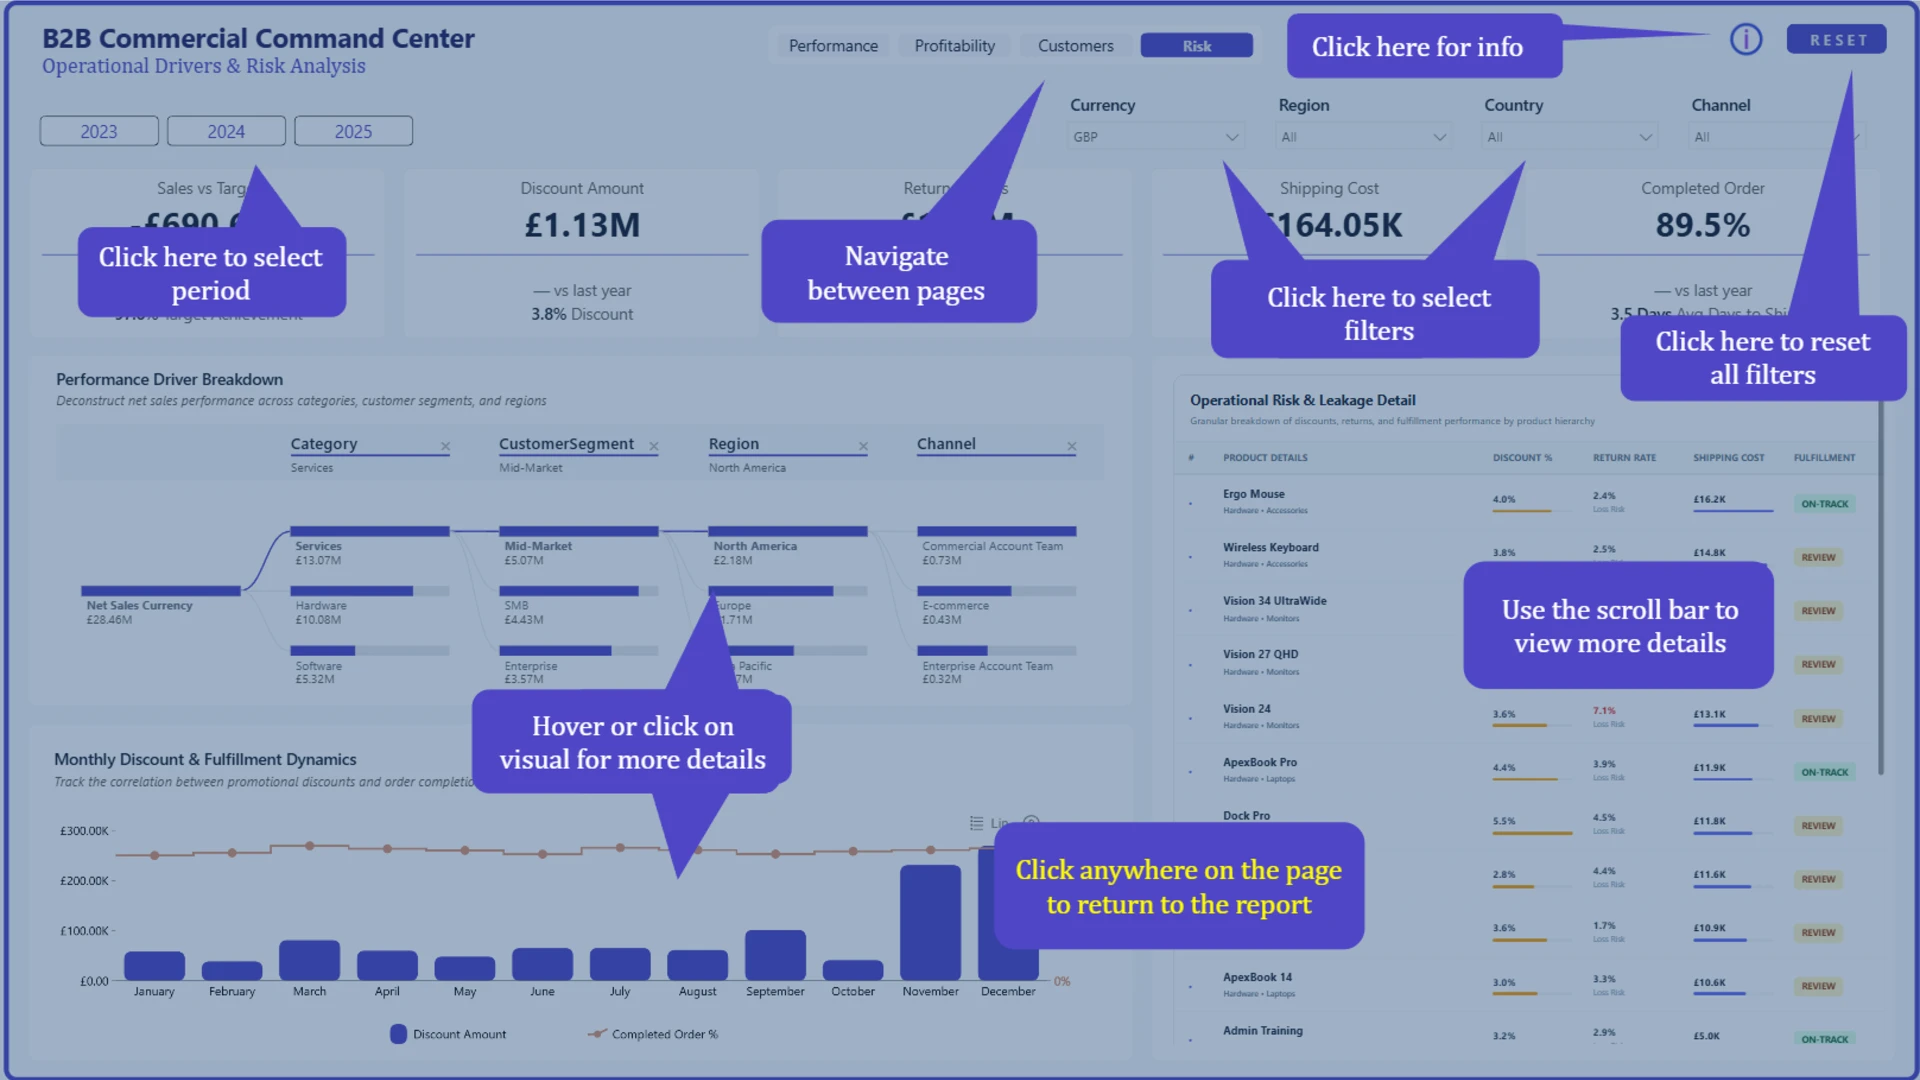
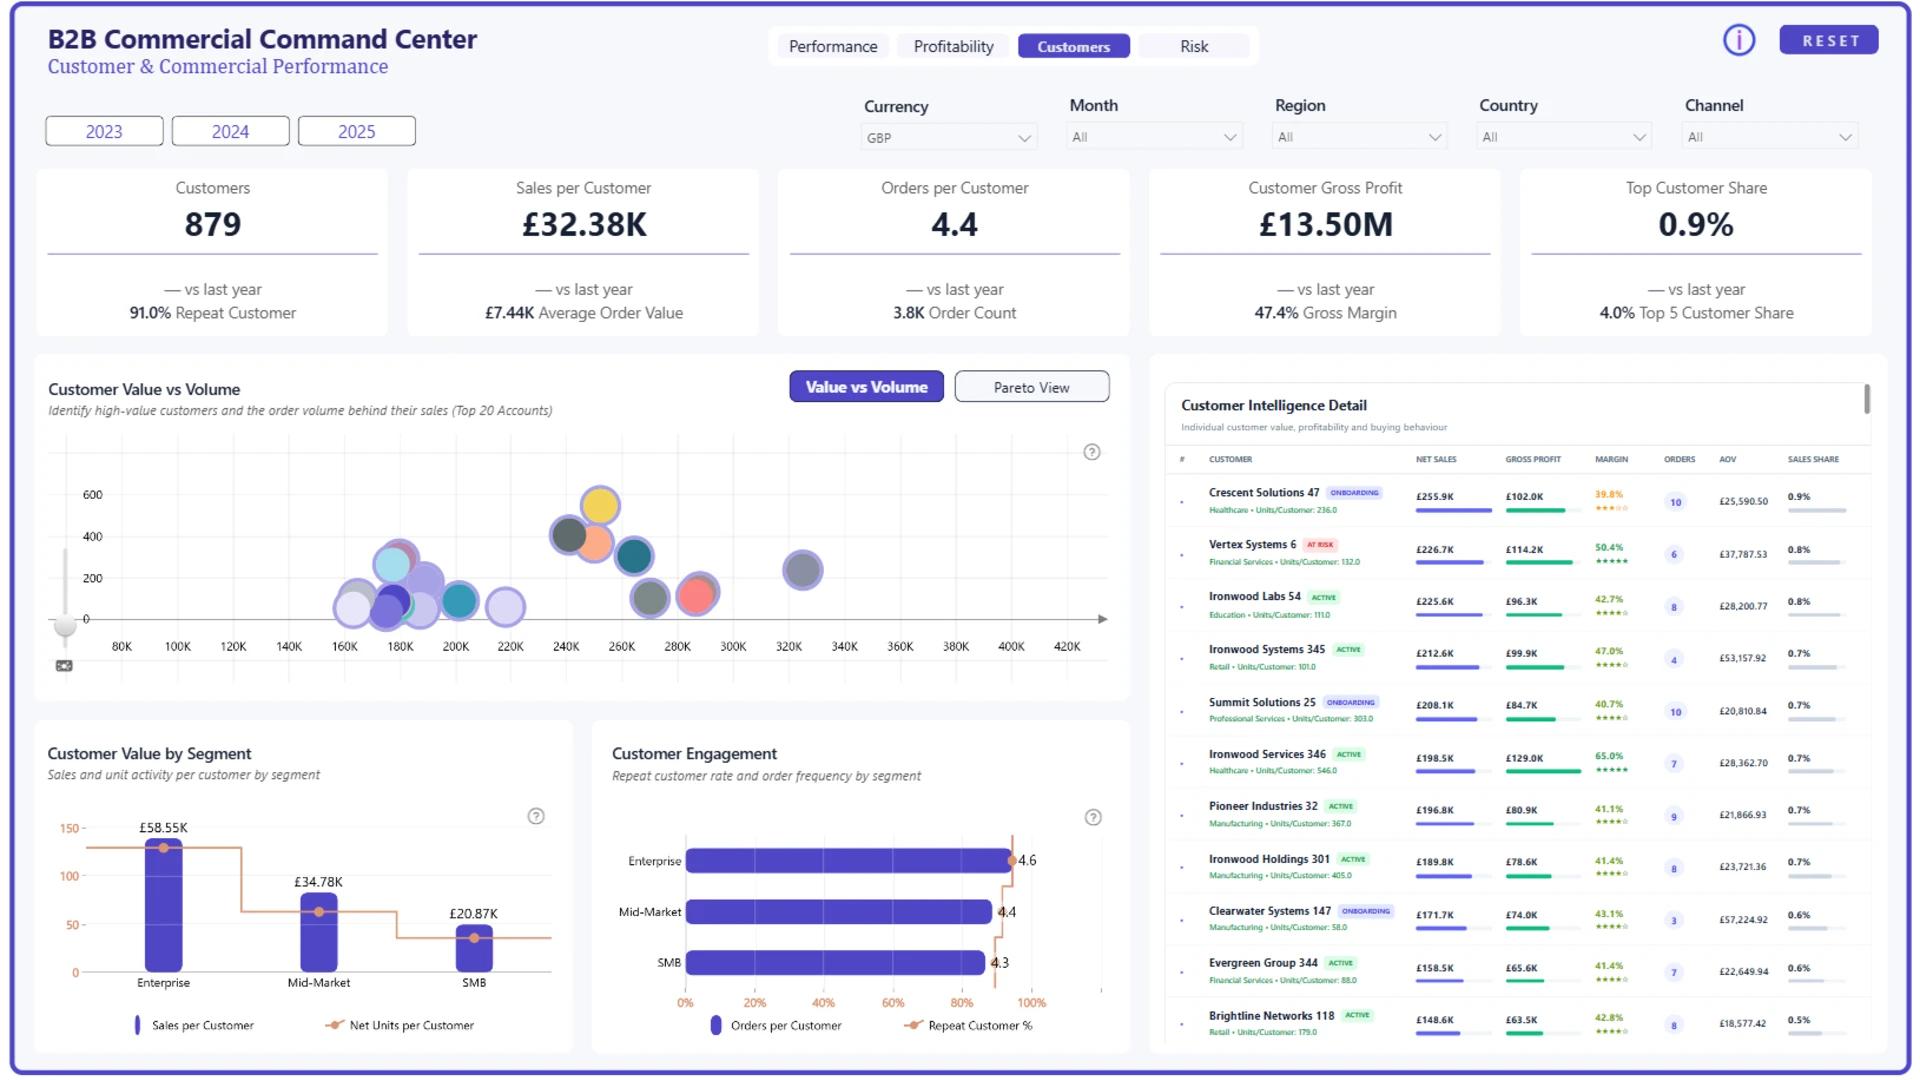
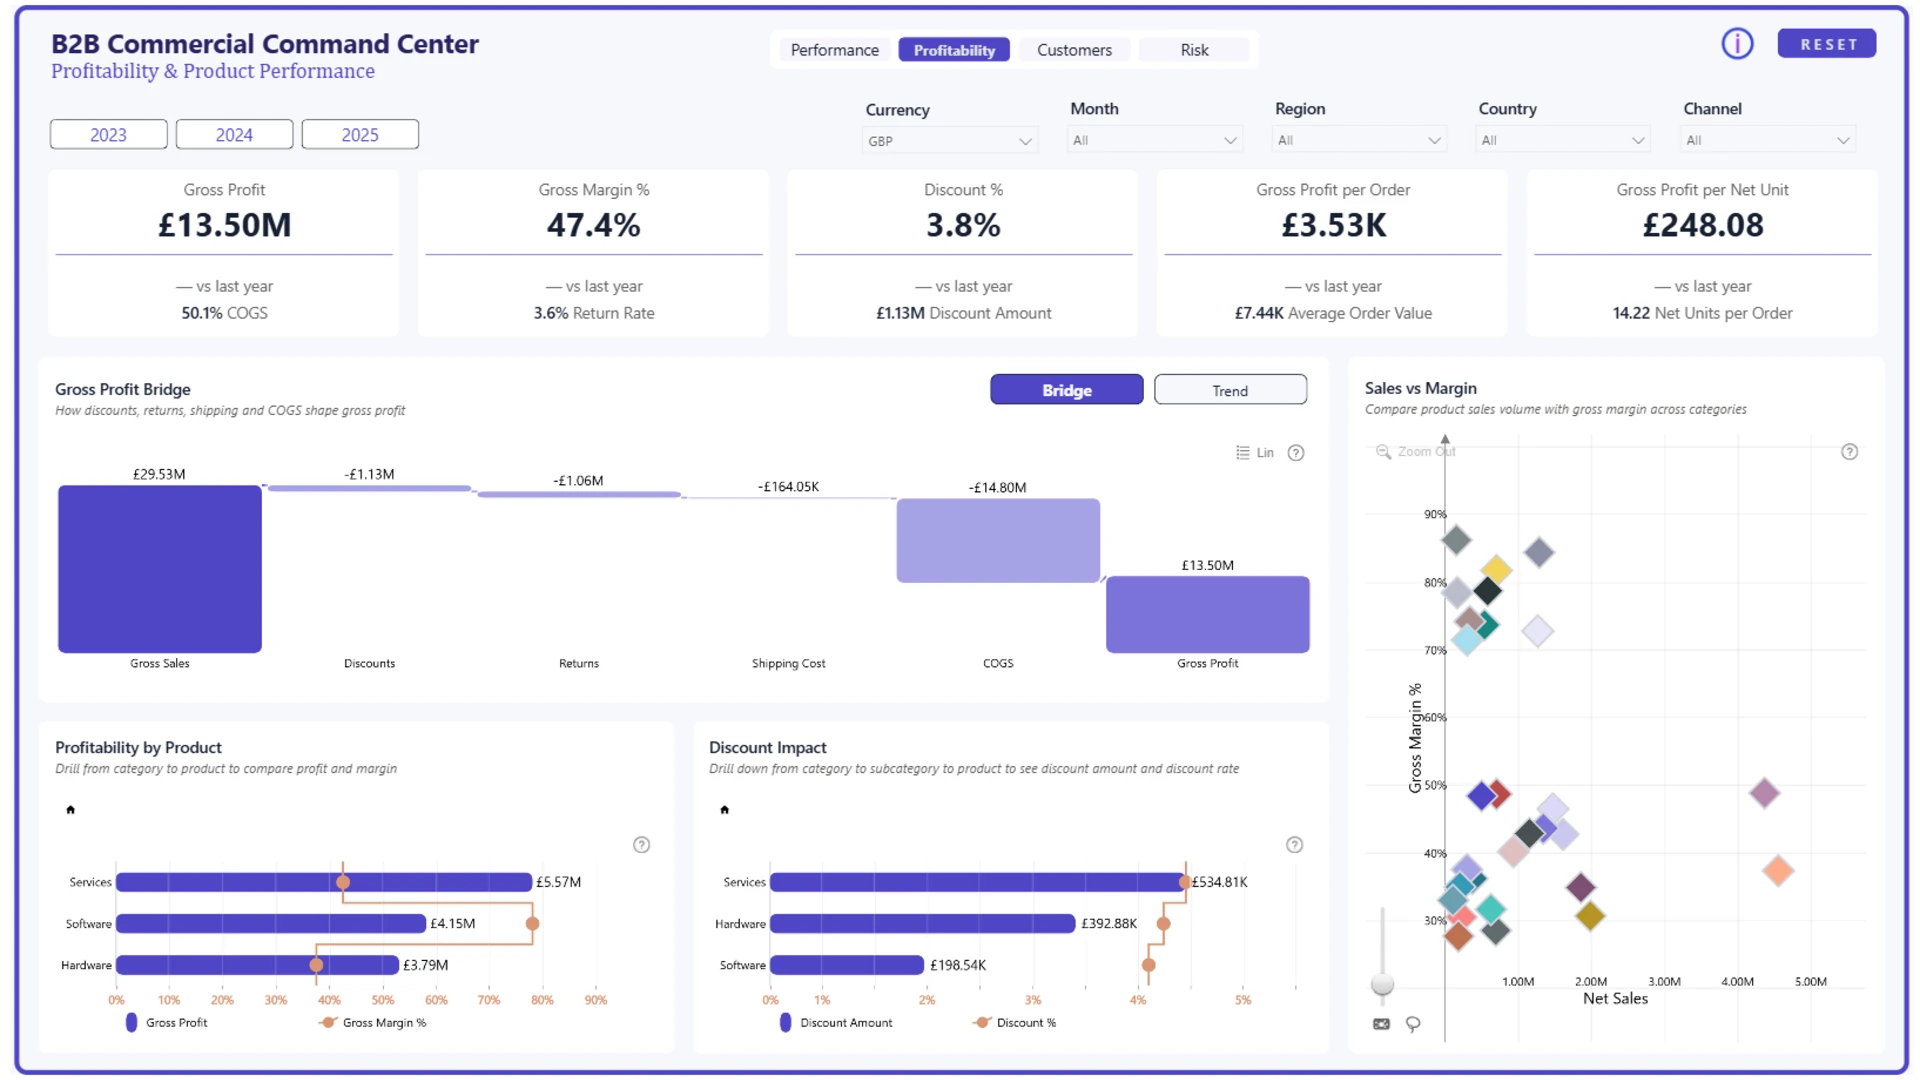
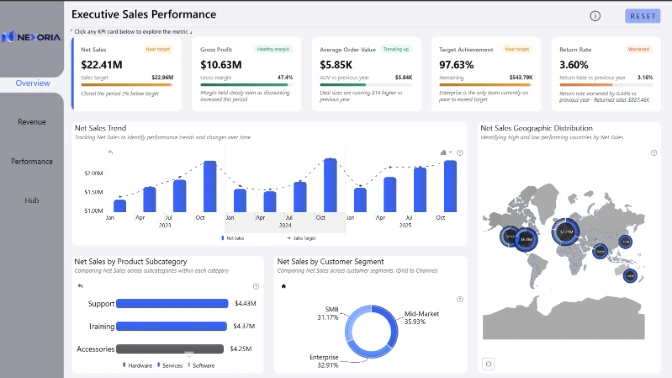
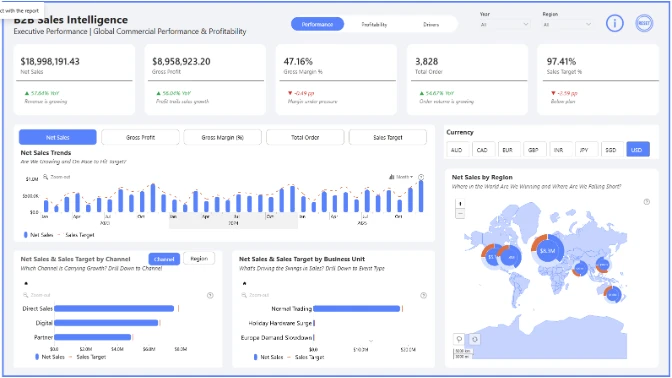
An interactive 4-page B2B executive Power BI dashboard connecting commercial performance, profitability, customer dependency and operational risk. The report moves from revenue and target performance to margin drivers, account concentration and operational leakage, helping leadership understand what is happening, why it is happening, where the risks are, and where to focus action.
This submission to the ZoomCharts 4U Report Challenge August 2026 combines Power BI with ZoomCharts Drill Down visuals to explore the 2023-2025 global B2B sales dataset.
ZoomCharts visuals used







4U Report Challenges
Participate in data challenges, build and submit reports to get free template downloads.
Join CommunityMobile view allows you to interact with the report. To Download the template please switch to desktop view.
How to use a PBIX template
Preview the interactive report, download the PBIX file, open it in Power BI Desktop, and replace the same data connection with your own dataset.
Preview and download
Explore the report online and download the PBIX template file.
Open in Power BI Desktop
Open the downloaded PBIX file in Power BI Desktop.
Connect your data
Replace the sample data source with your own dataset.
Refresh and adjust
Refresh the model and update fields or visual were needed.
Save and share
Save your report and publish it for your audience.


