1985
Power BI B2B Sales Performance KPI Dashboard
Power BI B2B Sales Performance KPI Dashboard
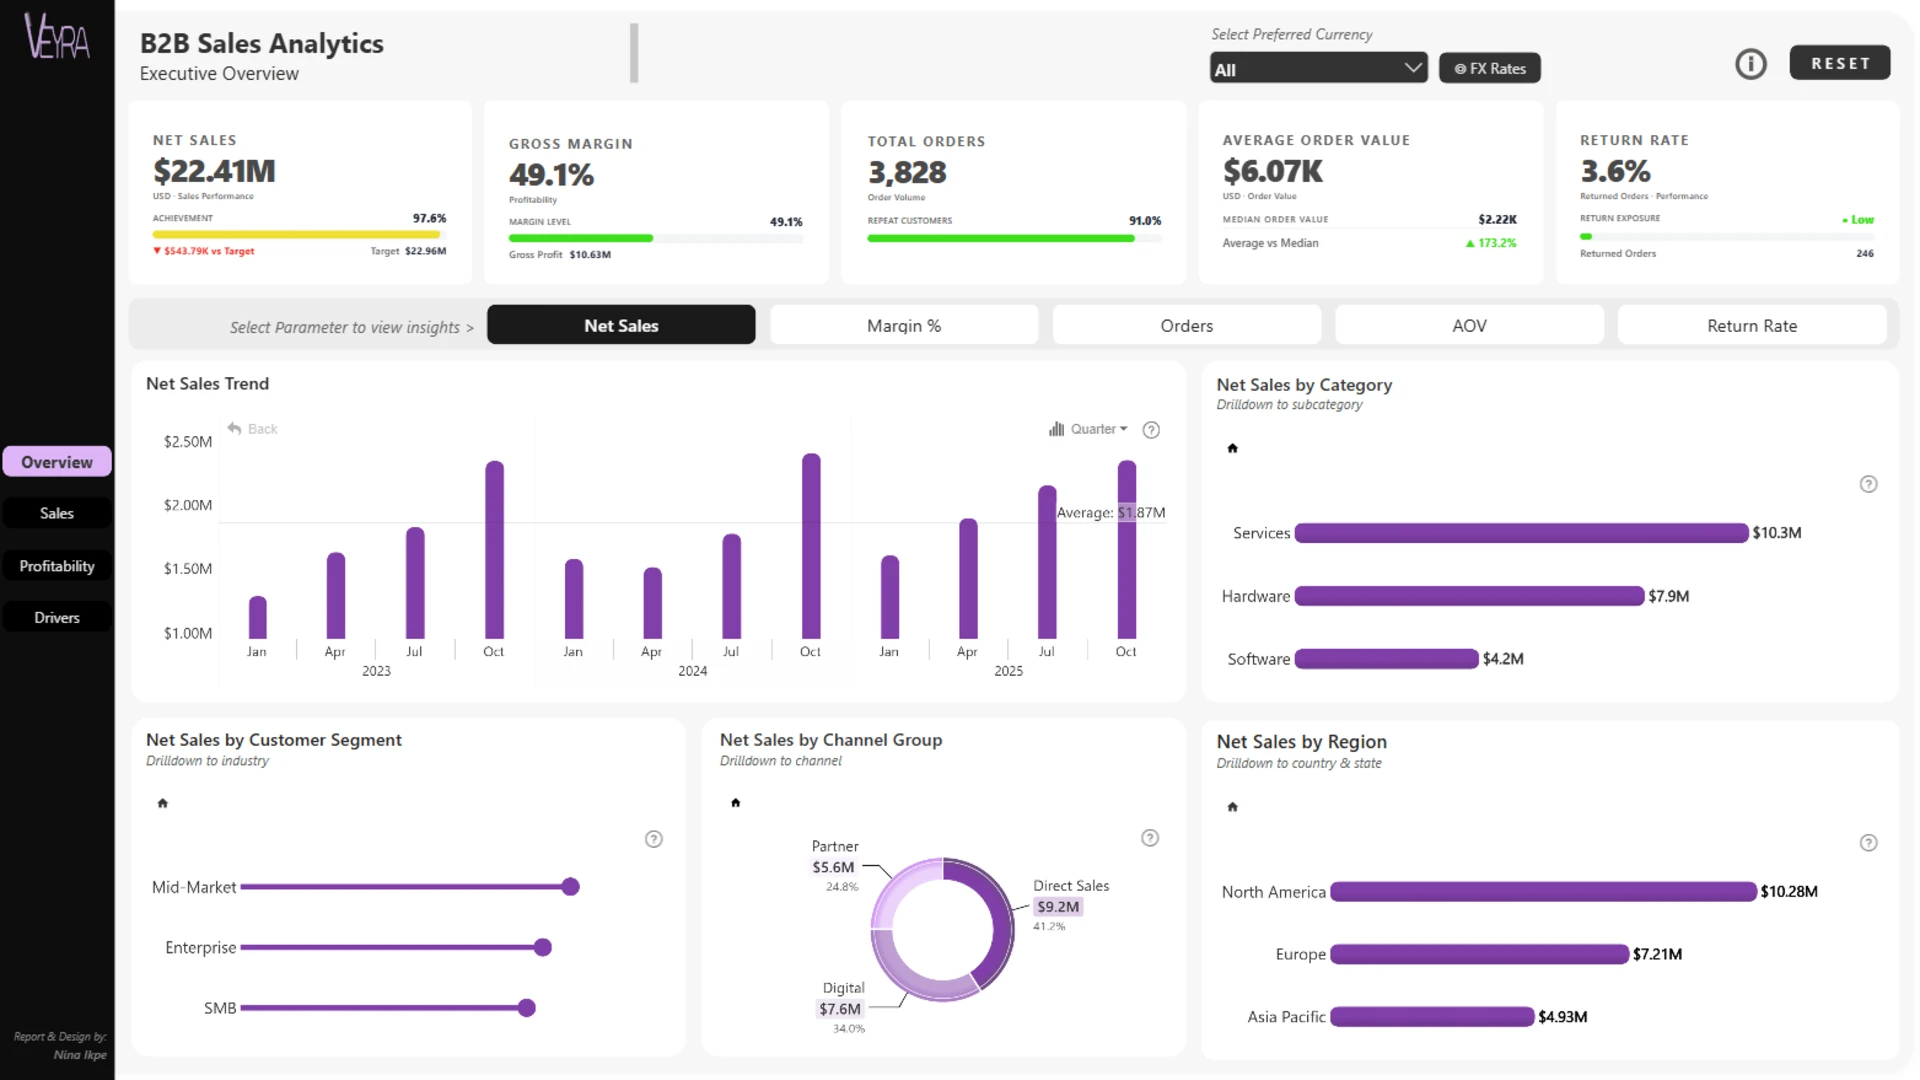
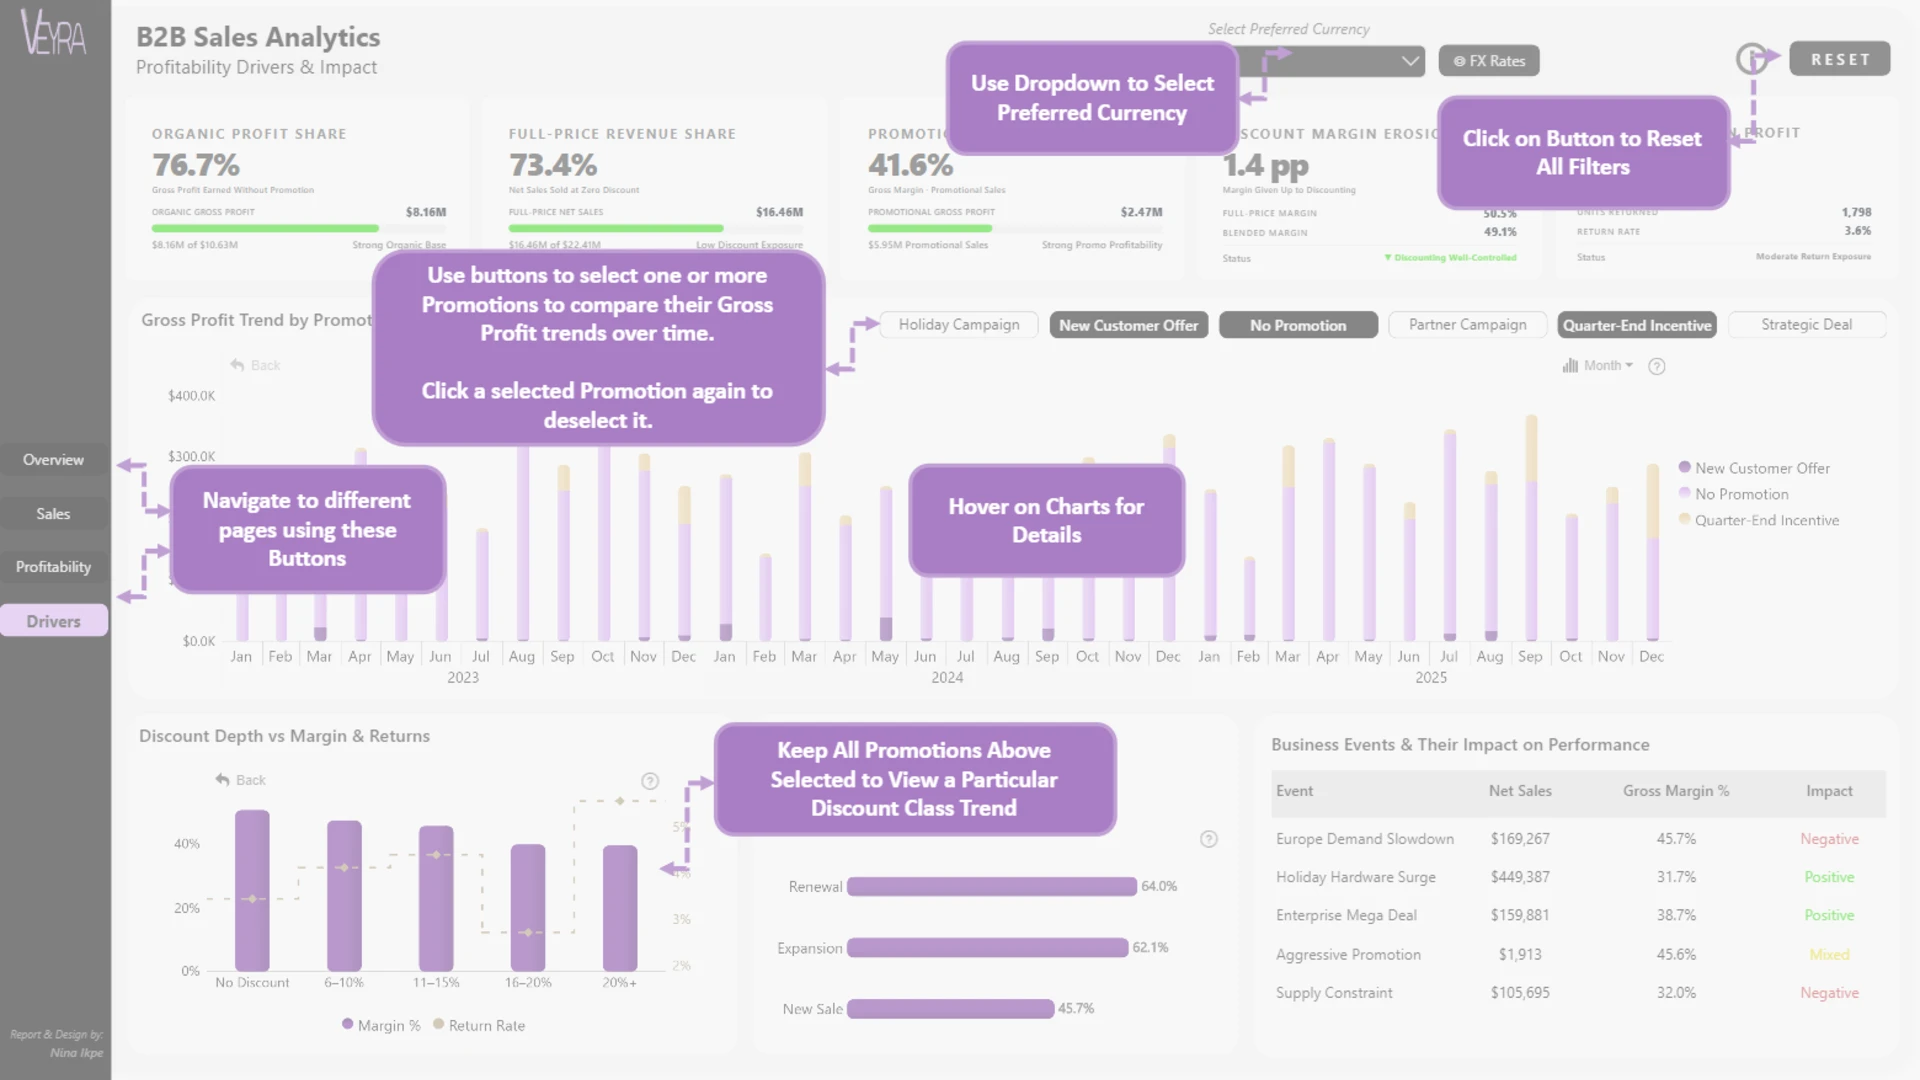
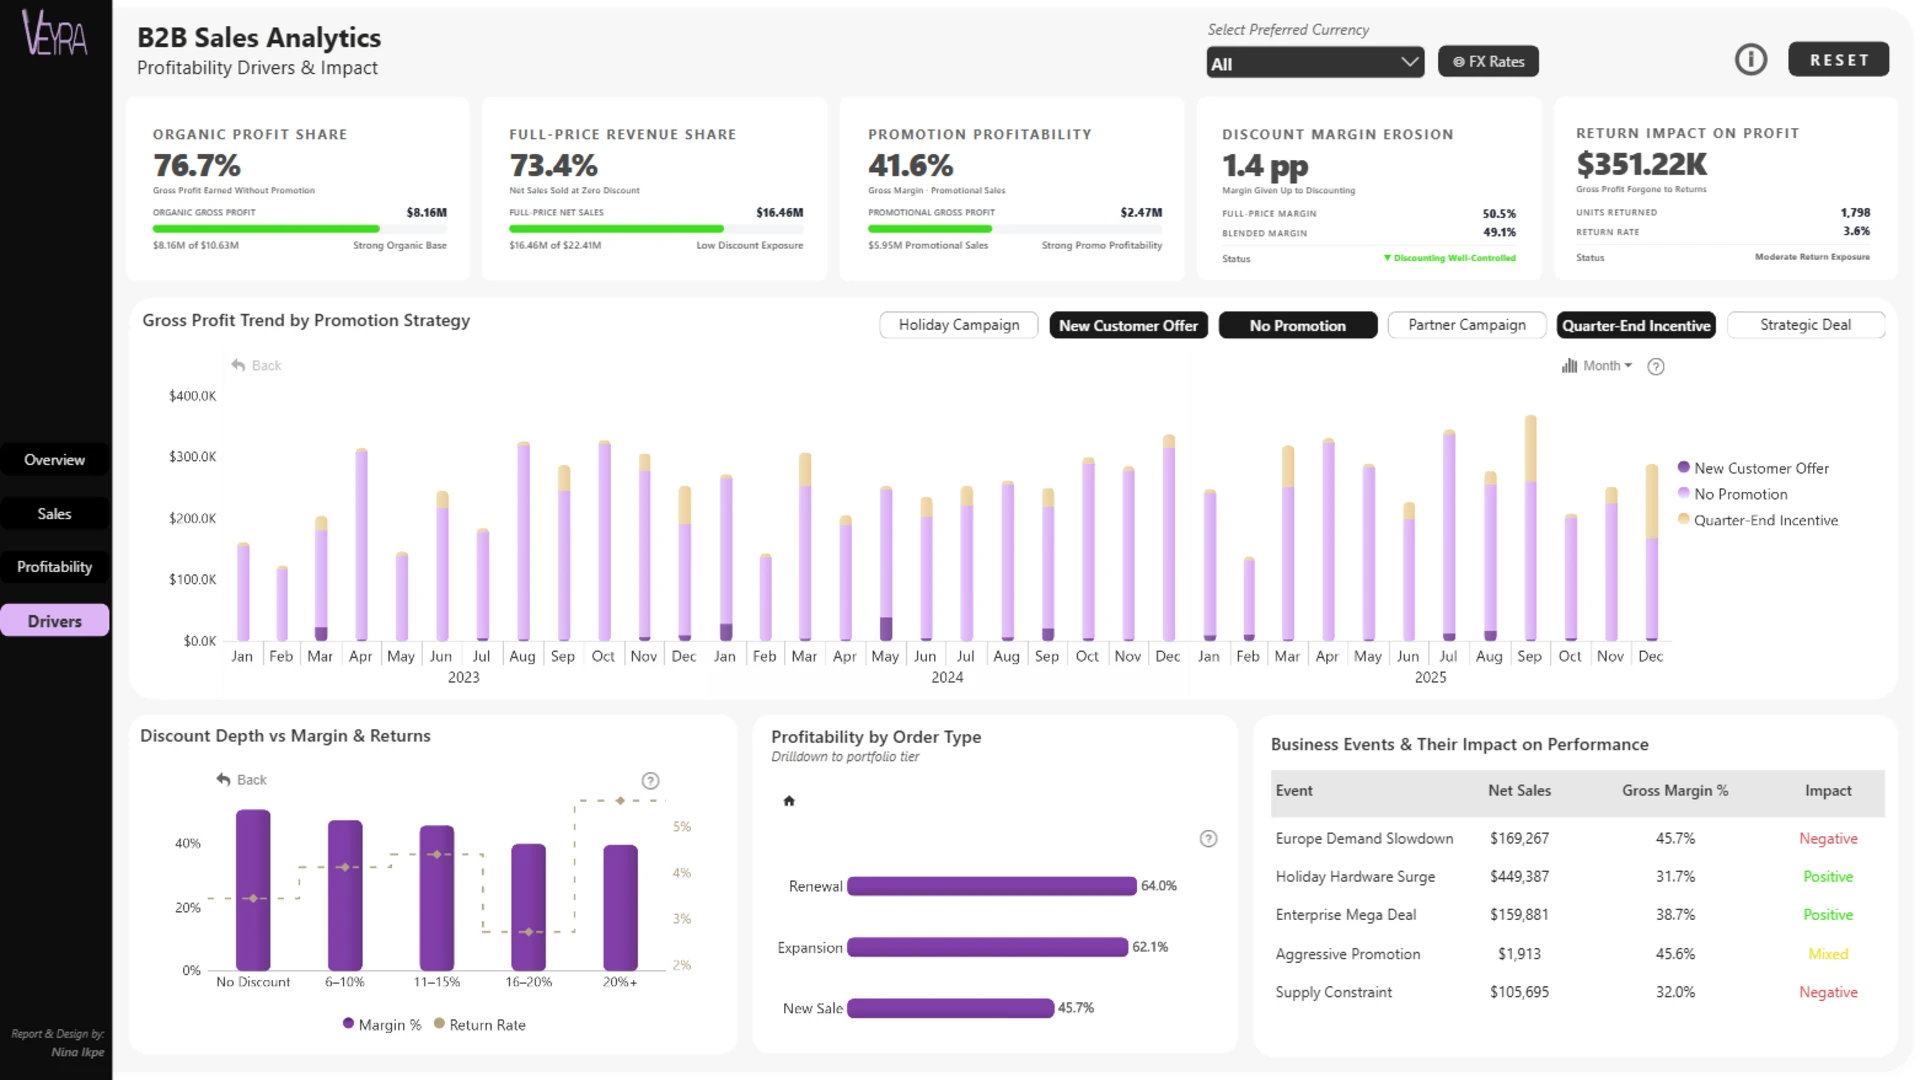
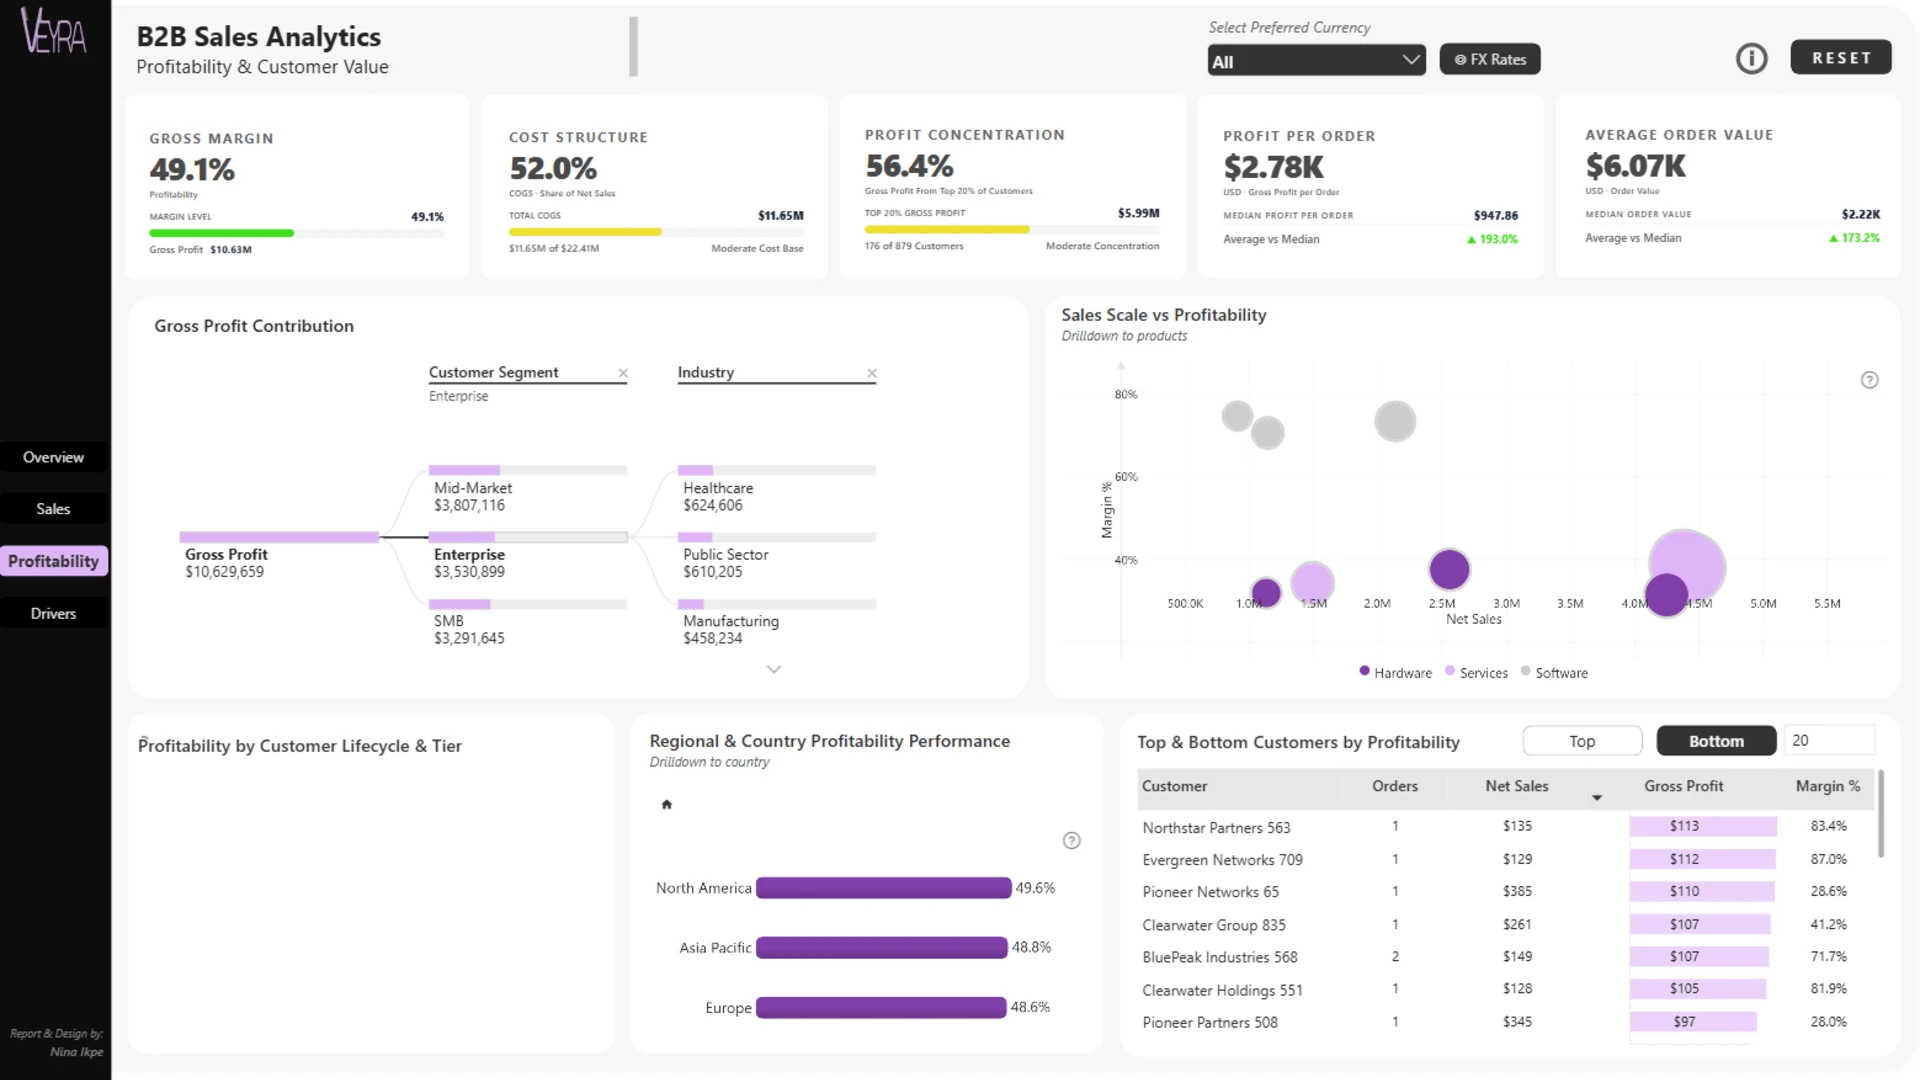
More Report pages
Report Author: Nina Ikpe
1985
Share template with others
Summary
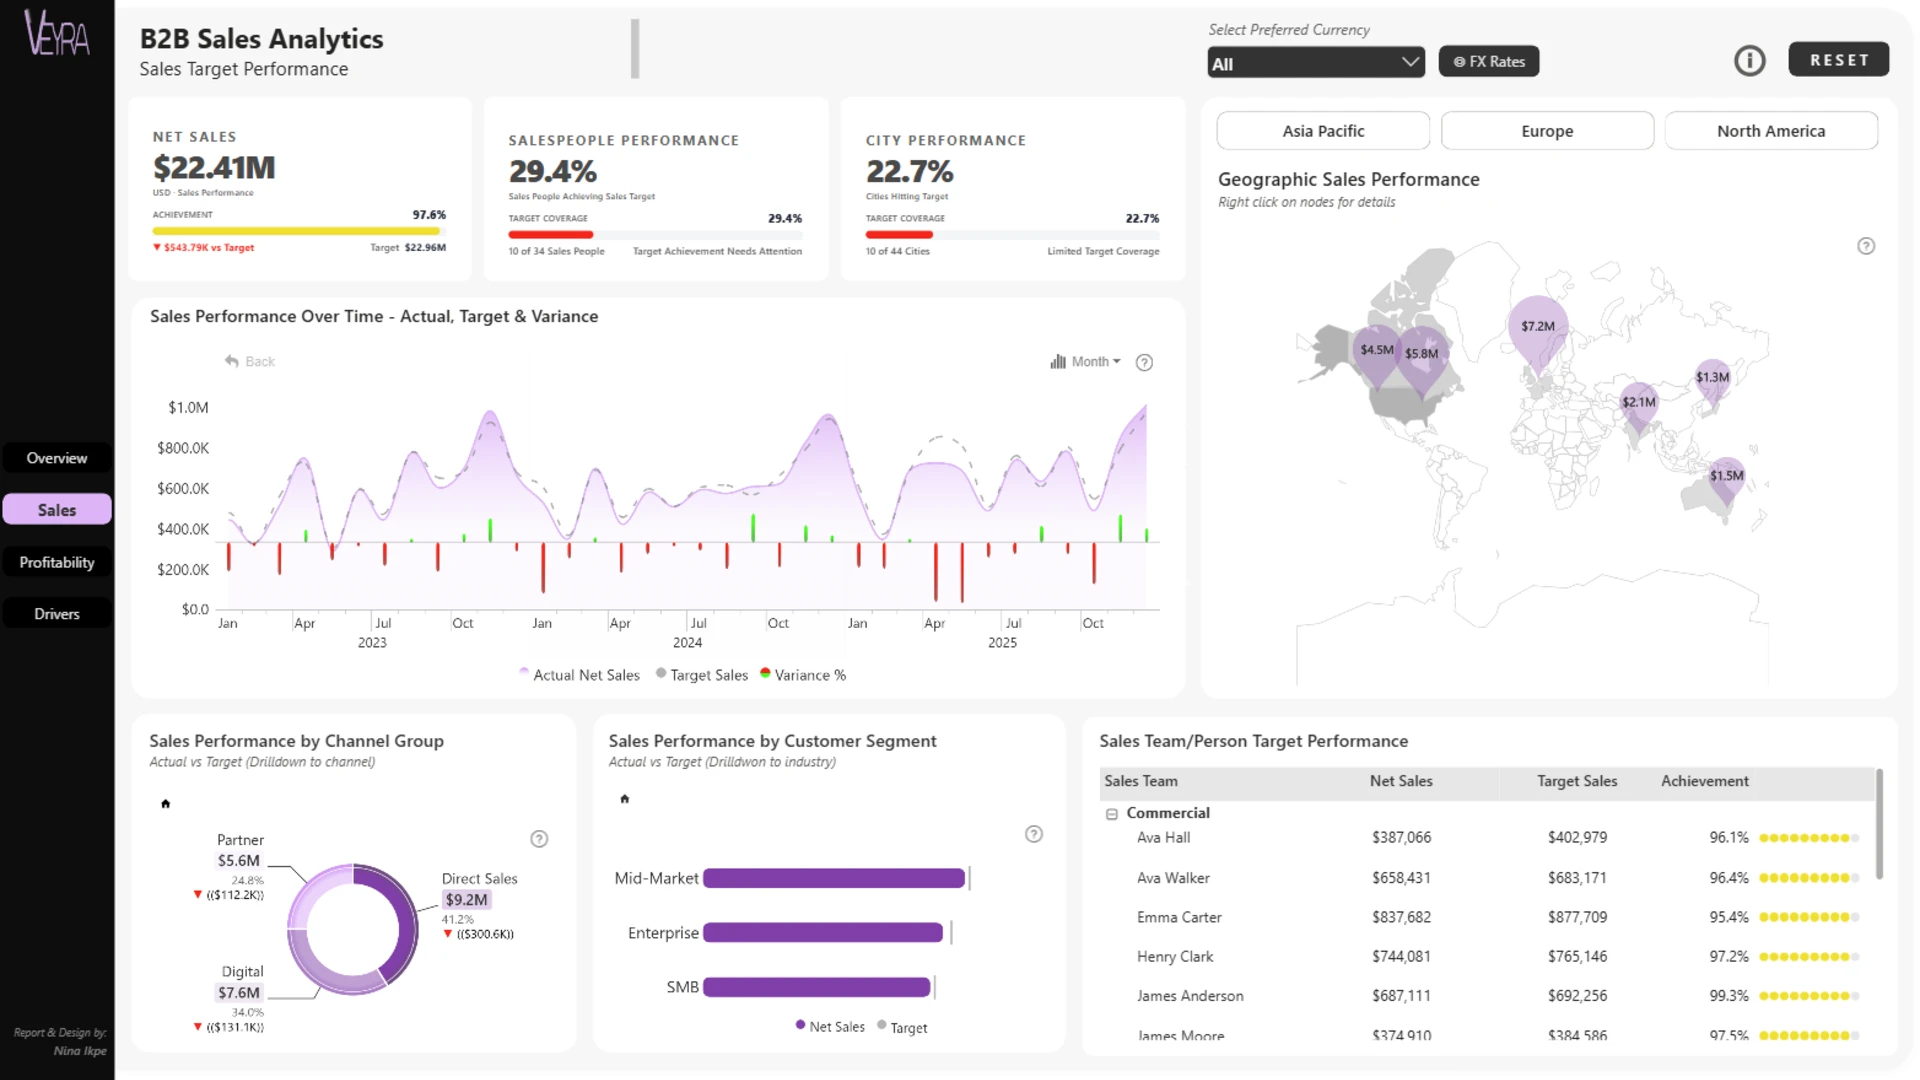
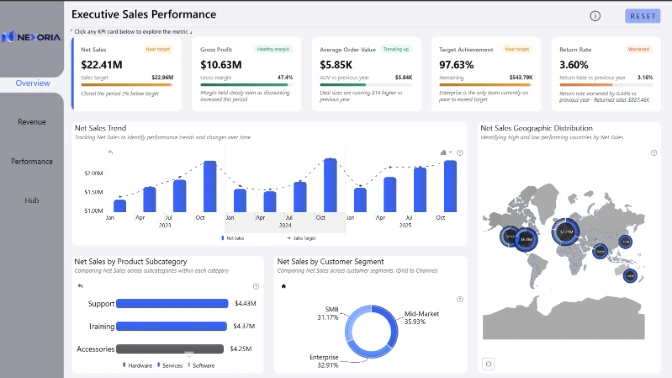
This Power BI B2B sales performance dashboard provides a decision-ready view of net sales, order volume, average order value, gross profit, gross margin, target achievement, and returns. It helps commercial teams understand where sales and profitability are being created or lost across a global operation.
The report was created by Nina Ikpe for the August 2026 ZoomCharts 4U Report Challenge using a global B2B sales dataset.
Key Insights of the Power BI B2B Sales Performance KPI Dashboard
The report is structured across four pages covering executive performance, target achievement, profitability, and commercial drivers. Its main insights include:
- Executive sales performance: monitor net sales, orders, average order value, gross profit, gross margin, and returns
- Target achievement: compare sales results with targets and identify areas performing above or below expectations
- Revenue and profitability: examine where revenue, gross profit, and margin are being generated
- Regional and channel performance: compare results across geographic markets and sales channels
- Customer and industry analysis: explore performance by customer segment and industry
- Product and sales-team performance: identify the products and commercial teams contributing most to results
- Commercial drivers: analyze how promotions, discounts, returns, order types, and business events affect profitability
Scatter, Combo Bar, Timeline, Map, and Donut visuals provide relationship, comparison, time-based, geographic, and category-composition views. Cross-filtering helps users move from headline KPIs to a selected region, channel, segment, industry, product, team, or commercial activity.
How to Use This Power BI B2B Sales Performance KPI Dashboard
Navigate between the executive sales, target achievement, revenue and profitability, and commercial performance pages. Click an active chart, timeline period, map location, or category segment to filter the related sales data and investigate performance differences.
Download the PBIX template to review the report structure, KPI calculations, data model, and visual settings in Power BI Desktop. Connect it to your own sales data and adjust the targets, products, customer segments, channels, regions, and commercial measures as needed.
ZoomCharts visuals used





4U Report Challenges
Participate in data challenges, build and submit reports to get free template downloads.
Join CommunityMobile view allows you to interact with the report. To Download the template please switch to desktop view.
How to use a PBIX template
Preview the interactive report, download the PBIX file, open it in Power BI Desktop, and replace the same data connection with your own dataset.
Preview and download
Explore the report online and download the PBIX template file.
Open in Power BI Desktop
Open the downloaded PBIX file in Power BI Desktop.
Connect your data
Replace the sample data source with your own dataset.
Refresh and adjust
Refresh the model and update fields or visual were needed.
Save and share
Save your report and publish it for your audience.


