Welcome to the Onyx Data March 2024 Challenge!

Feb 29 - Mar 28, 2024 | EDT

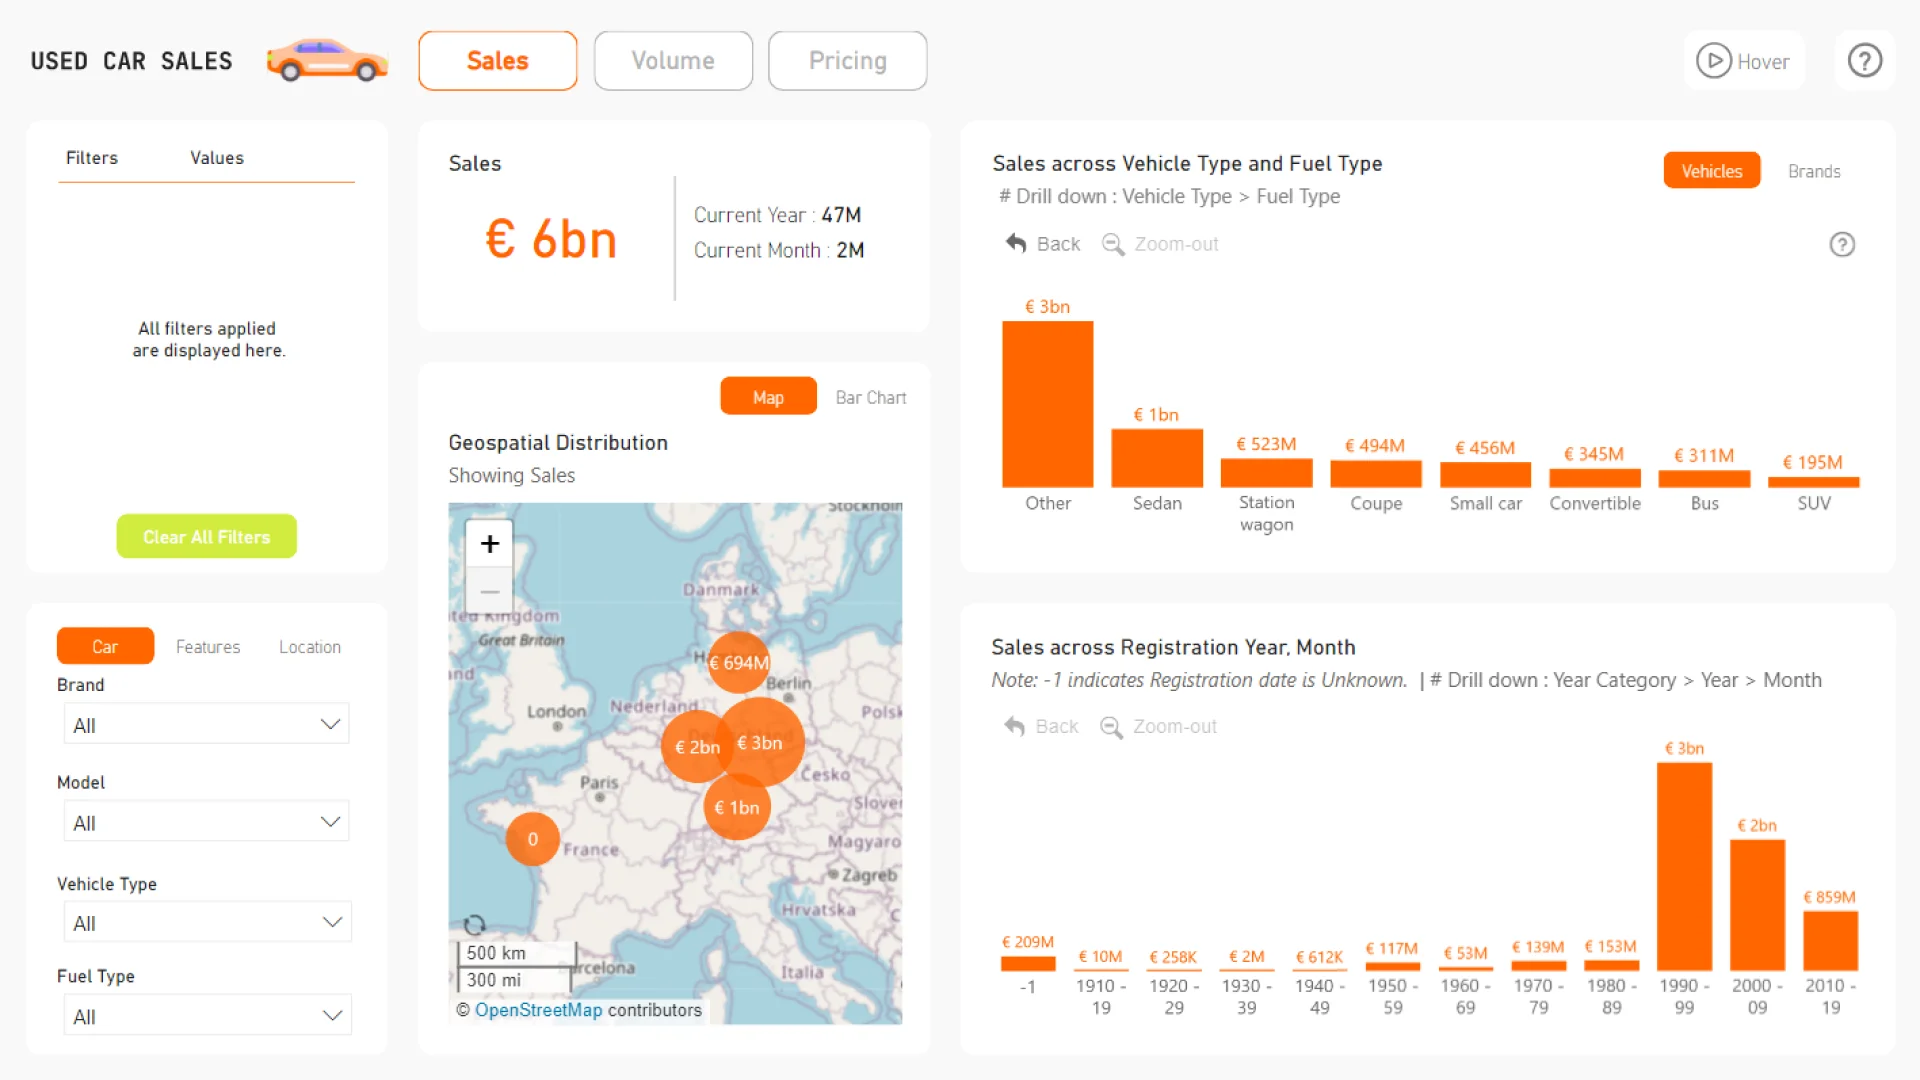
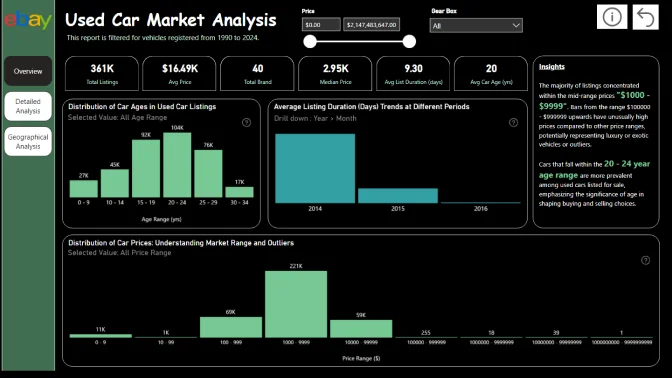
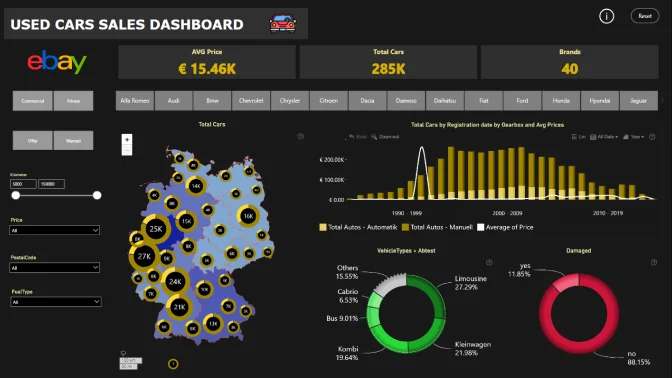
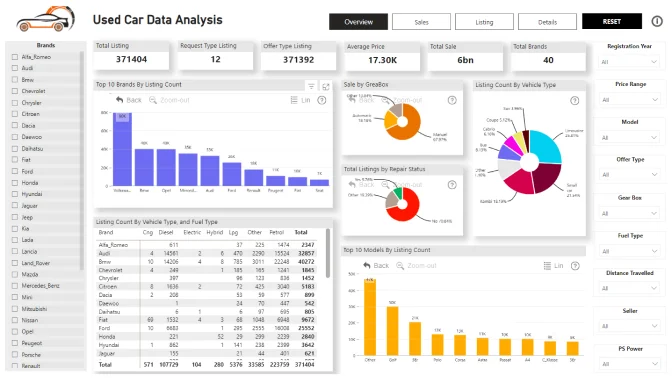
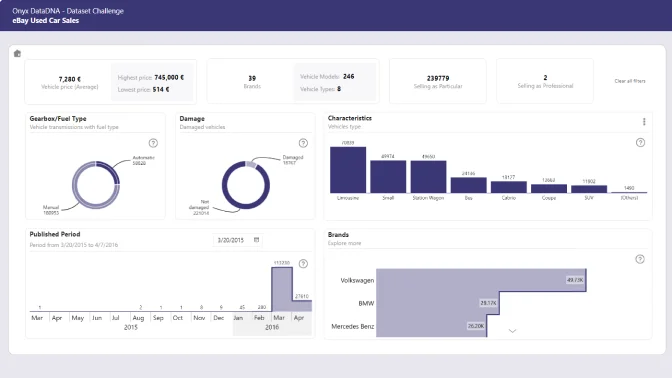
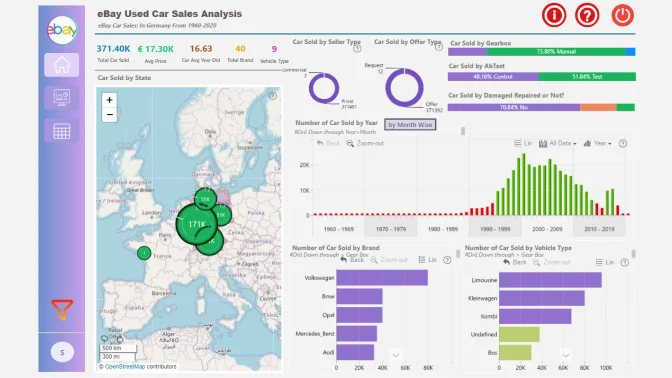
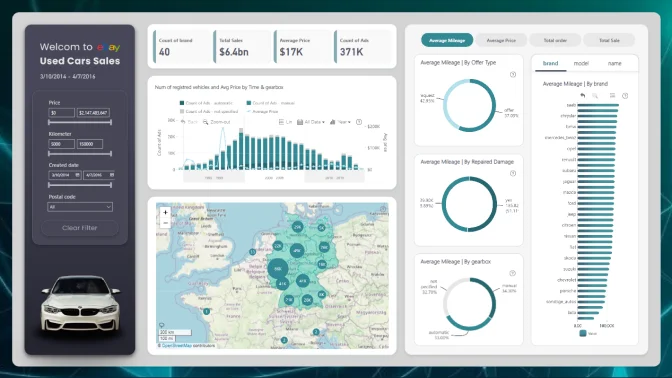
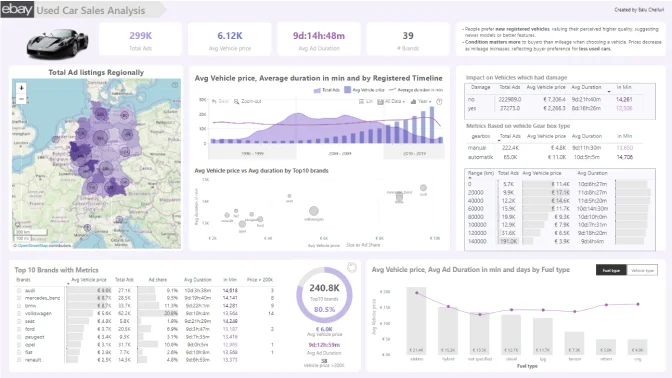
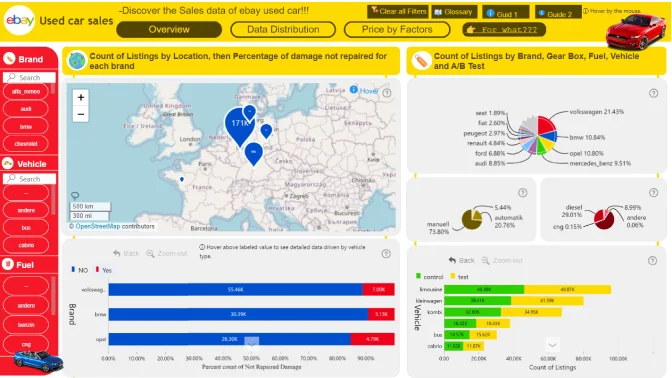
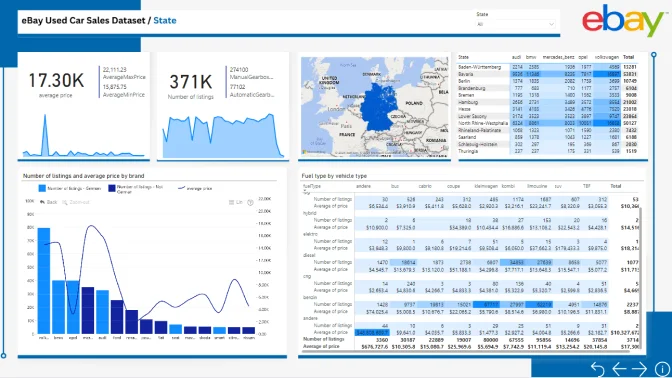
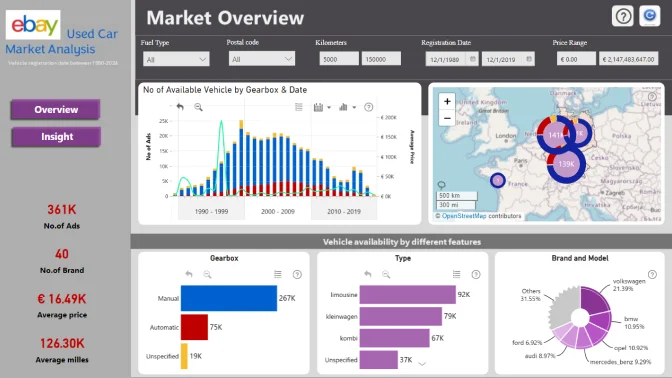
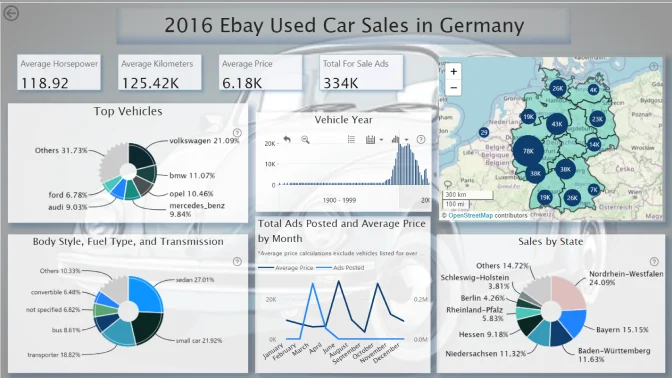
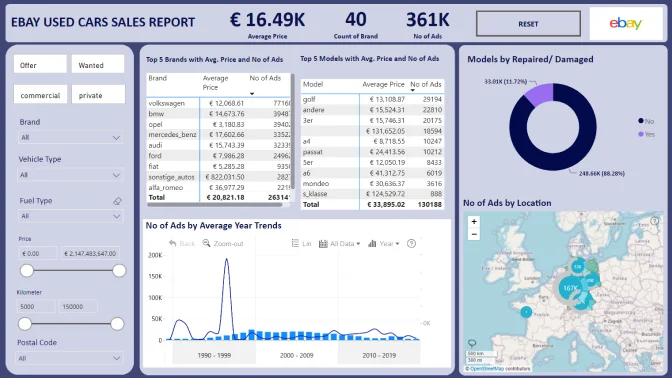
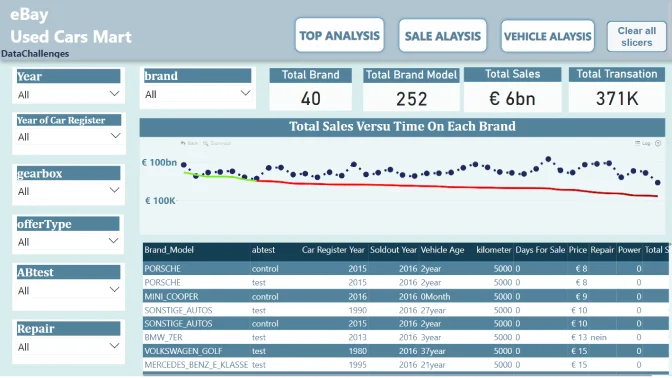
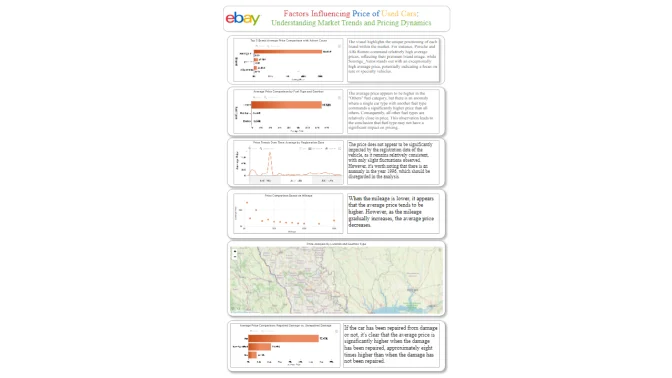
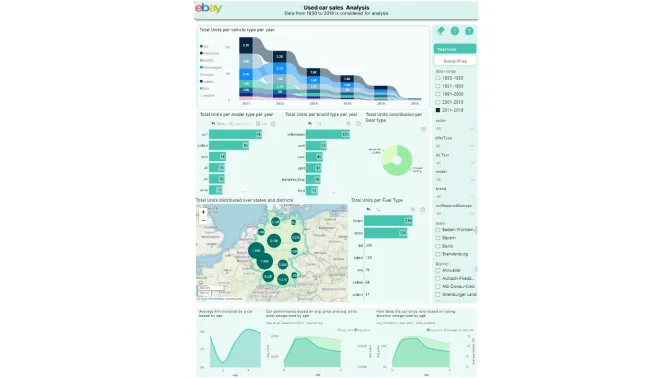
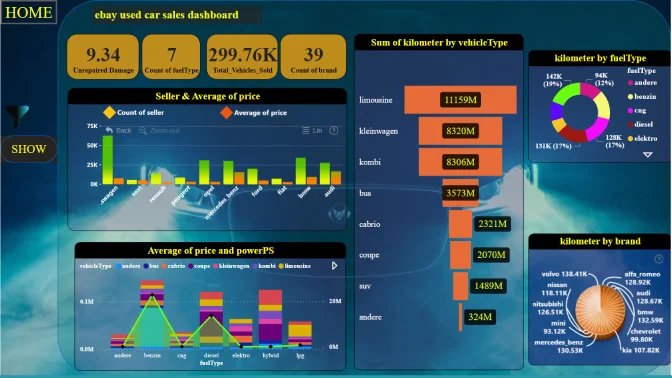
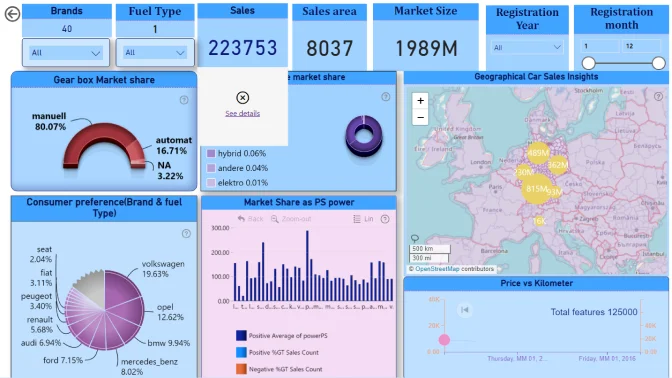
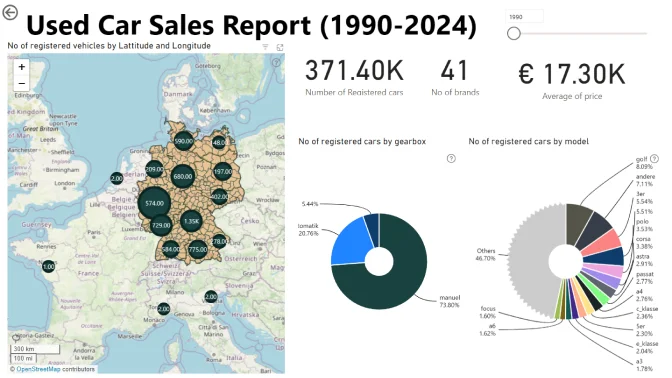
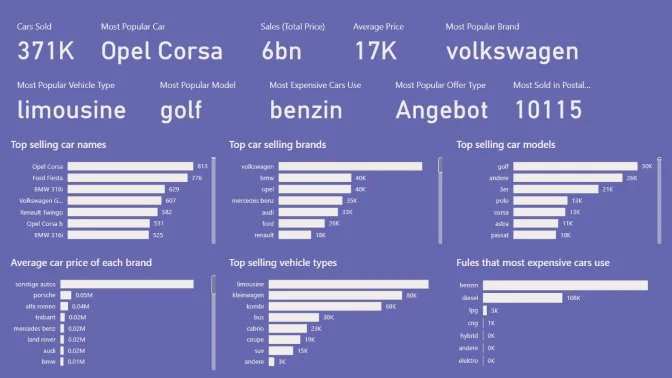
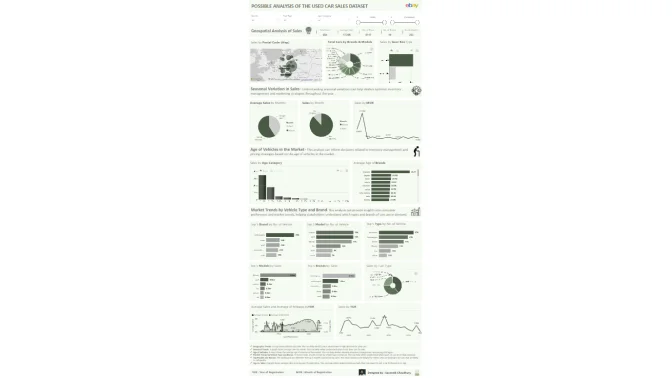
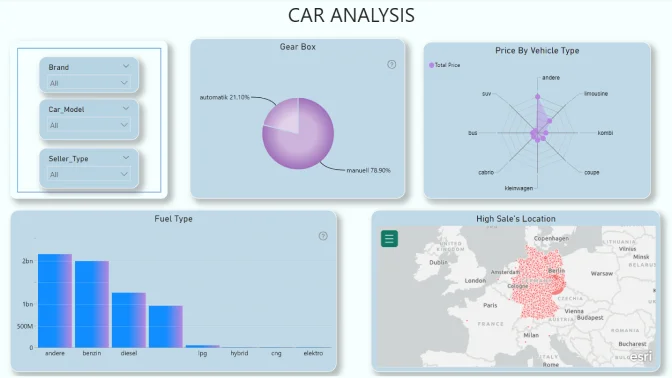
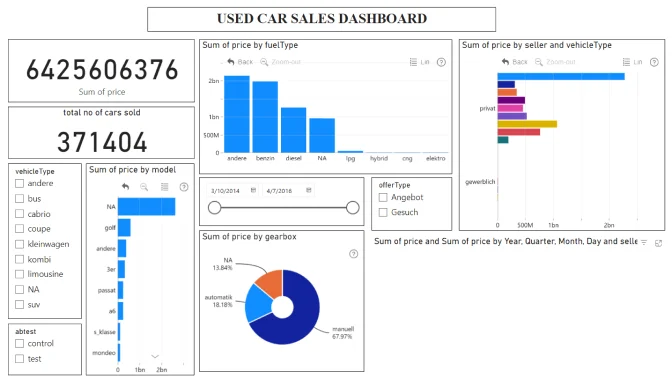
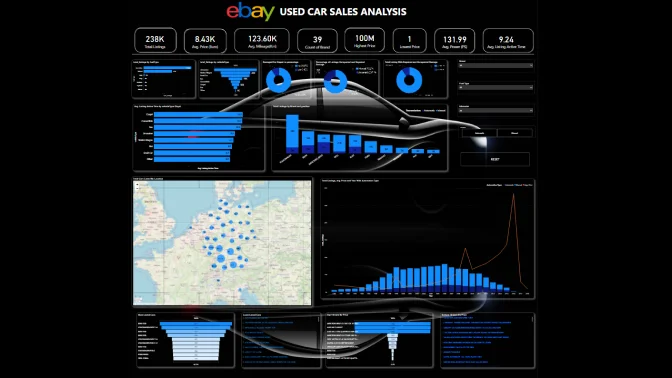
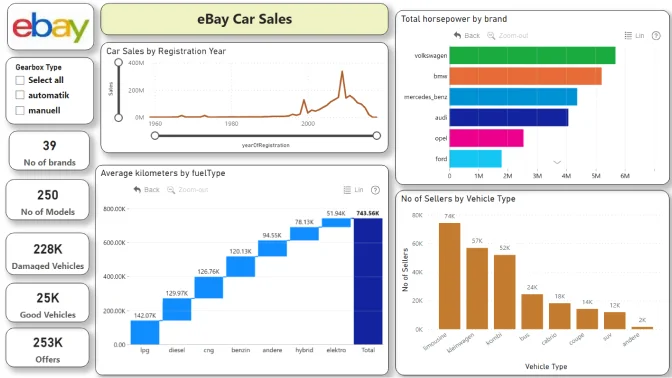
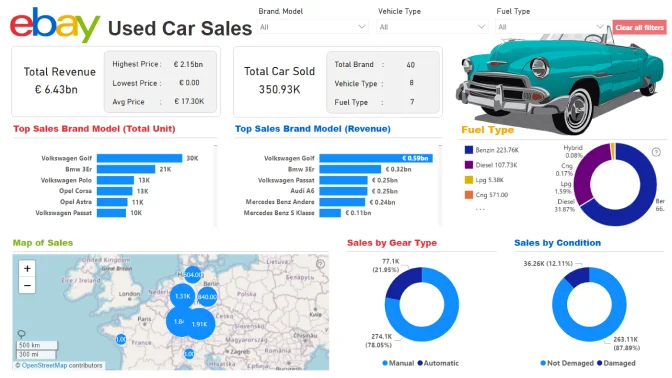
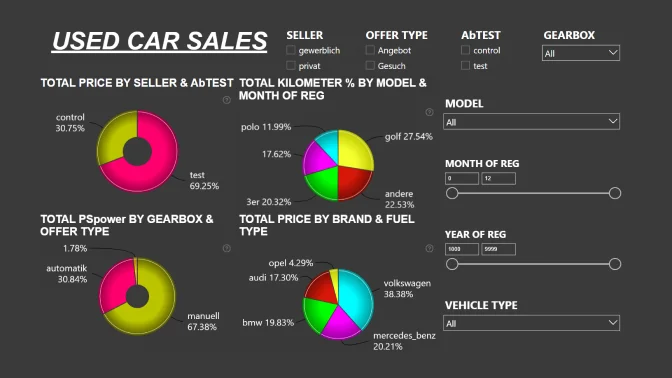
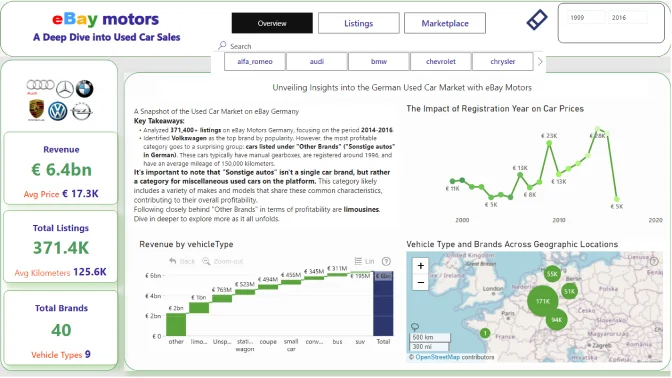
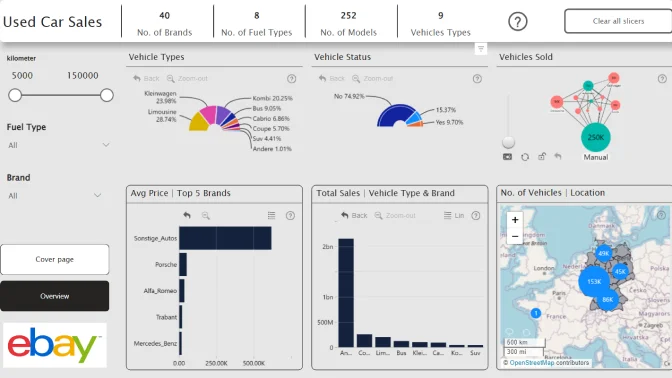
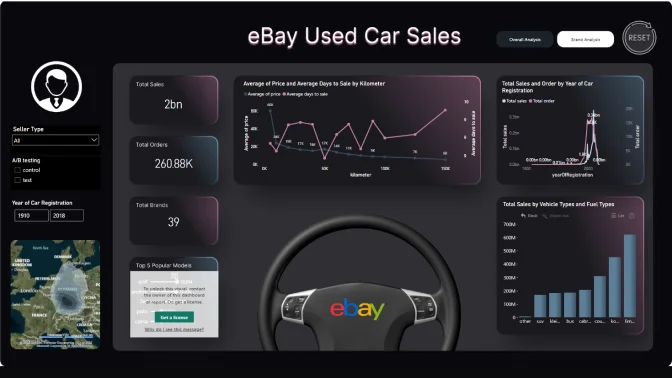
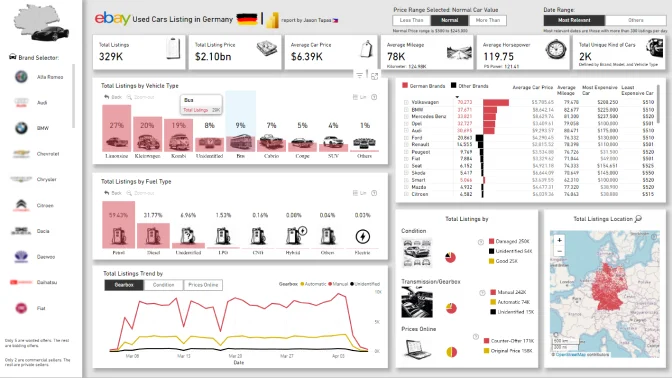
Buckle Up! For the March challenge, we're going to analyze trends in used car sales with Power BI. Ready to learn, compete, and showcase your talents? 🚗

Timeline

Registration Open

Registration Open

29 February | 19:00

-

Submissions Open

Submissions Open

29 February | 19:00

-

Workshop | Car Sales Analysis in Power BI with ZoomCharts

Workshop | Car Sales Analysis in Power BI with ZoomCharts

12 March | 10:00

-

1:1 Mentoring Sessions

1:1 Mentoring Sessions

12 March | 10:00

29 February - 24 March

Entry Submission Deadline

Entry Submission Deadline

24 March | 20:00

29 February - 24 March

Webinar | Practical Lessons from Used Car Sales Reports: ZoomCharts Top 5

Webinar | Practical Lessons from Used Car Sales Reports: ZoomCharts Top 5

28 March | 12:00

29 February - 24 March

Winner Announced

Winner Announced

28 March | 12:00

29 February - 24 March

Dataset

Get the dataset

See past Onyx Data challenges

See past challenges
Submitted Reports
About challenge
How to participate
Judging criteria
Timeline
Dataset
Past challenges

Winner of the challenge

All Submissions

About ZoomCharts Mini Challenge

ZoomCharts Mini Challenge is part of the global DataDNA – Dataset Challenge by Onyx Data, which unites 11K+ data enthusiasts worldwide, ranging from beginners to seasoned professionals, including Microsoft MVPs. Read more about the DataDNA challenge on the Onyx Data website. Join the community on LinkedIn

The ZoomCharts Mini Challenge provides a platform for a growing community to learn how to build PRO reports, aiding business users to explore data quickly and intuitively.

  1. Free License: All participants receive a free ZoomCharts Developer License that gives access to the full Drill Down PRO visuals library. License will remain active for 1 year after the challenge.
  2. Learn from Experienced Professionals: As part of the challenge, we host live workshops on report building and visualizing the challenge’s dataset in Power BI. Challenge participants can also book an individual consultation with an experienced Power BI mentor to ask questions and get personalized tips.
  3. Tailored Feedback: Every challenge submission will receive personalized feedback, giving participants the chance to hone their skills and improve their reports.

Prizes

The best report’s creator will receive a $300 Amazon gift card from ZoomCharts. The Top 5 submissions and the winner will be announced live on March 28.

Webinar recordings

How to participate?

  1. Register for ZoomCharts Mini Challenge and receive a Drill Down Visuals Developer License for Power BI.
  2. Download the March DataDNA Challenge dataset
  3. Use the data to create a Power BI report including at least 2 ZoomCharts Drill Down Visuals in one report page.
  4. To learn more about applying ZoomCharts visuals in your reports, you can participate in the challenge workshop.
  5. Submit your entry to be verified.
    (If your submission doesn’t match the challenge criteria, you will be notified by email, so make sure you will have time for revision and resubmission if needed. Feel free to resubmit your entry as many times as necessary before the deadline)
  6. Follow ZoomCharts on LinkedIn
  7. Share the final version of your submission as a LinkedIn post on your profile, including the tags @ZoomCharts and @OnyxData, as well as the hashtags #dataDNA and #builtwithzoomcharts.
  8. IMPORTANT: After posting final report version on LinkedIn, please complete this form: https://forms.office.com/r/7xjizwdXbU

All participants of ZoomCharts Mini Challenge who have filled the form are also valid to compete in the main Onyx Data DataDNA challenge for a chance to win additional prizes.

Technical requirements

  • Build your report using only Power BI
  • The number of pages in the report is not limited
  • At least one report page has to contain a minimum of 2 ZoomCharts Drill Down Visuals. See a practical guide on Drill Down Visuals here

Judging criteria

We empower participants to build PRO reports in order to create exceptional user experiences. Drill down and filter data with ease, giving your end-users the insights they need, quickly and intuitively.

  1. How easy is it to understand the data? (max 10 points)
    • Is too much text used for explanation?
    • Are the indicative colors in charts instinctually understandable?
    • Does it tell a story?
  2. How easy-to-use is the report? (max 14 points)
    • Cross-chart filtering implementation across the report. Can other visuals provide relevant data as the user explores the report?
    • Response time
    • Drill Down: multi-layer data exploration. Can the user drill down and gain additional insights within the report?
    • Use of tutorial overlays and other elements to assist new users. Can a new user start using this report straight away with just the guidance provided within the report itself?
  3. How good is the report design and is it suitable for its purpose? (max 10 points)
    • Visual design: is the overall look consistent, no empty spaces, no overcrowding?
    • Interface design: are there unnecessary visualizations/buttons/complexity in use?
    • UX design: is the produced report usable?
    • Report design: is the main challenge answered?
    • Technical: are all the fonts used the same, are the sizes readable?

You are encouraged to use various techniques at your disposal, such as tooltips, drill-throughs, drill-downs, cross-chart filtering and page navigation features, to enhance your analysis.

Timeline

Registration Open

Registration Open

29 February | 19:00

-

Submissions Open

Submissions Open

29 February | 19:00

-

Workshop | Car Sales Analysis in Power BI with ZoomCharts

Workshop | Car Sales Analysis in Power BI with ZoomCharts

12 March | 10:00

-

1:1 Mentoring Sessions

1:1 Mentoring Sessions

12 March | 10:00

29 February - 24 March

Entry Submission Deadline

Entry Submission Deadline

24 March | 20:00

29 February - 24 March

Webinar | Practical Lessons from Used Car Sales Reports: ZoomCharts Top 5

Webinar | Practical Lessons from Used Car Sales Reports: ZoomCharts Top 5

28 March | 12:00

29 February - 24 March

Winner Announced

Winner Announced

28 March | 12:00

29 February - 24 March

Dataset

Get the dataset

See past Onyx Data March 2024 challenges

See past challenges