698
eBay Used Cars Listings in Germany | Power BI Dashboard Example
eBay Used Cars Listings in Germany | Power BI Dashboard Example
Report Author: Jason Carl Martin Tupas
698
Share template with others
This Power BI used car market analysis report was submitted for the Onyx Data DataDNA ZoomCharts Mini Challenge, March 2024.
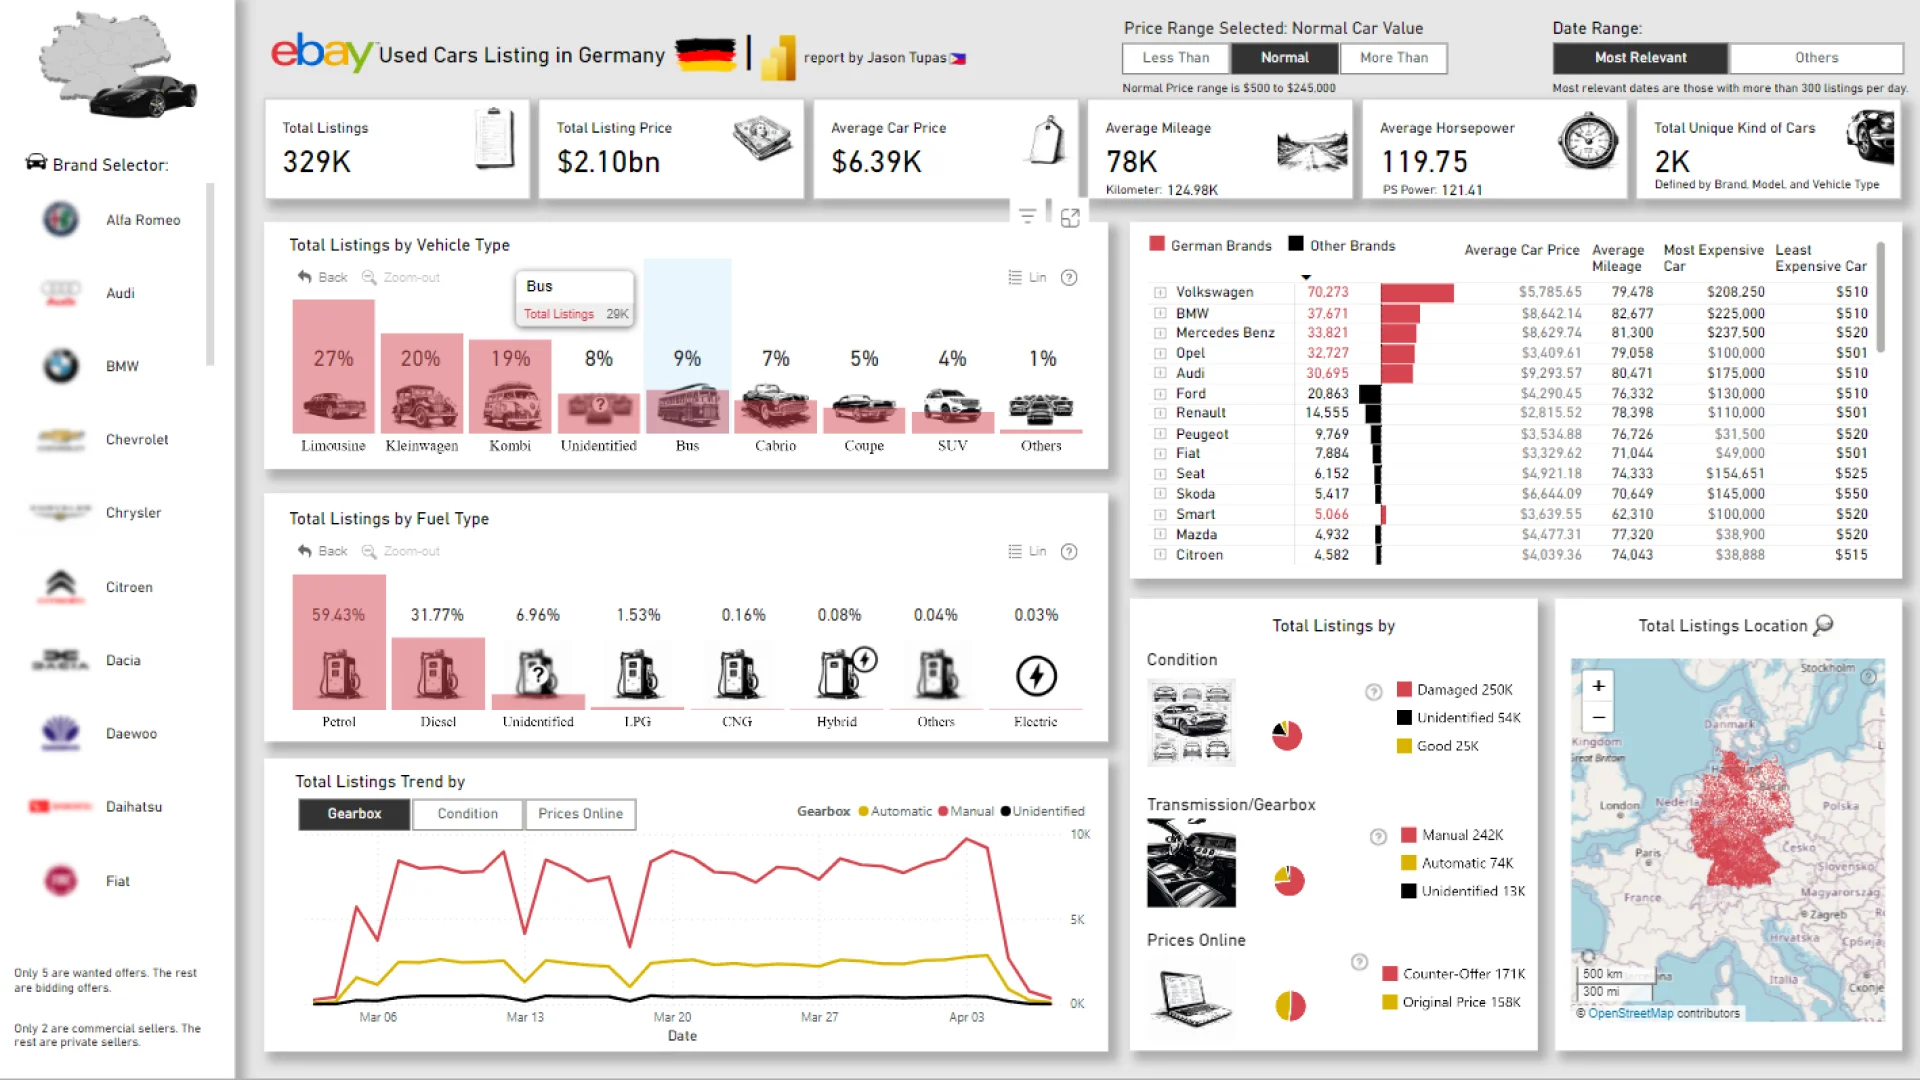
The report analyzes eBay used car listings across Germany to uncover insights into vehicle pricing, mileage, fuel preferences, transmission types, brand popularity, and regional market distribution. It combines ZoomCharts custom visuals with native Power BI visuals to create an interactive analytical experience for exploring automotive market trends.
Report was submitted for the Onyx Data DataDNA ZoomCharts Mini Challenge, March 2024.
Author's Description
"I made a concise one-page report aiming to provide a thorough overview, showcasing essential variables and trends extracted through thorough data analysis, presented with visually appealing graphics. This succinct report presents graphs depicting trends, patterns, and crucial metrics important to the topic, fostering informed decision-making and encouraging deeper exploration of the dataset.
I selected the colors Red, Yellow, and Black for my visuals to align them with the country of focus, Germany."
Key Insights of This Report
This dashboard visualizes more than 329K vehicle listings and displays various automotive market metrics, including:
-
Total listings
-
Total listing price
-
Average car price
-
Average mileage
-
Average horsepower
-
Vehicle types
-
Fuel types
-
Transmission and gearbox preferences
-
Vehicle condition
-
Brand comparison
-
Regional listing distribution across Germany
Each of these metrics can be filtered by vehicle brand, vehicle type, fuel type, condition, gearbox type, date range, and pricing category. Simply select data in the interactive visuals to cross-filter other charts and instantly reveal deeper insights into the German used car market.
The report features a combination of ZoomCharts Drill Down visuals, KPI cards, interactive trend analysis, and native Power BI map and chart visuals.
The report is based on the original challenge submission with minor refinements by the ZoomCharts team.
How To Use This Report Template
To interact with this Power BI automotive market analysis report, simply click any active elements directly on the charts.
Use filters and interactive visuals to explore vehicle pricing trends, compare brands, analyze fuel preferences, and identify regional market patterns across Germany.
Download this report to explore the settings, formulas, calculations, and visual interactions. You can also adapt the report structure for your own automotive, marketplace, or listing datasets.
4U Report Challenges
Participate in data challenges, build and submit reports to get free template downloads.
Join CommunityMobile view allows you to interact with the report. To Download the template please switch to desktop view.
Was this helpful? Thank you for your feedback!
Sorry about that.
How can we improve it?