783
Used Car Sales dataset
Used Car Sales dataset
Report Author: Malaika Ramzan
783
Share template with others
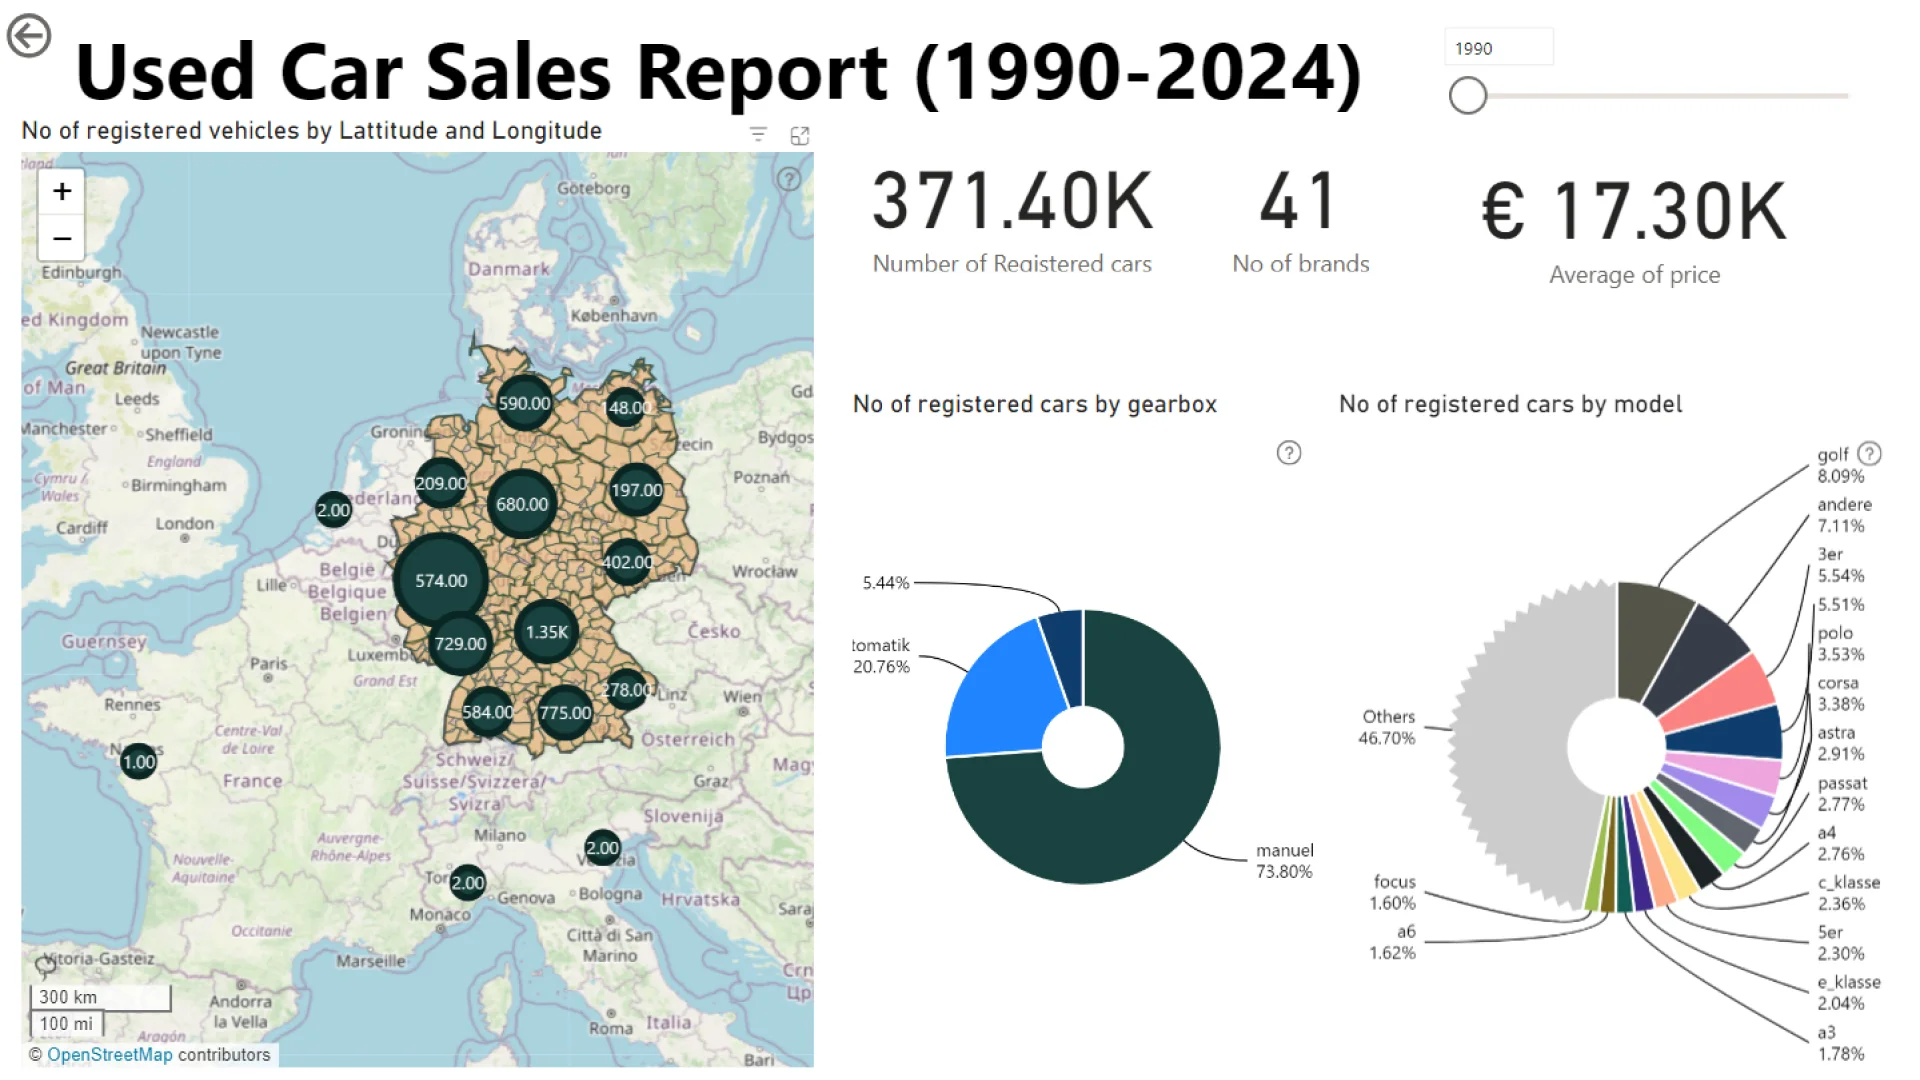
Report submitted for Onyx Data DataDNA ZoomCharts Mini Challenge, March 2024. The report was built based on eBay Used Car Sales Analysis dataset and includes ZoomCharts custom Drill Down PRO visuals for Power BI.
Author's description:
The report contains data from 1990-2024, with a ZoomCharts map indicating number of cars registered by. Also, has two donut charts indicating number of registered cars by gearbox in one and number of registered cars by models in the other. Also has cards for price average, no of total registered cars, and number of brands. All the visuals are interactive for one another.
4U Report Challenges
Participate in data challenges, build and submit reports to get free template downloads.
Join CommunityMobile view allows you to interact with the report. To Download the template please switch to desktop view.
Was this helpful? Thank you for your feedback!
Sorry about that.
How can we improve it?