Welcome to the FP20 Analytics September 2025 Challenge!
Aug 27 - Sep 30, 2025 | EDT
In this challenge, you'll step into the role of an HR data analyst working with a comprehensive dataset of over 497,000 detailed employee performance records.
Want to learn to build PRO reports? With personalized feedback and informative workshops, this is your opportunity to take your report-building skills to the next level, build your professional portfolio, and network with like-minded people.
The ZoomCharts challenge is hosted in partnership with FP20 Analytics – a group that unites passionate and inspiring data enthusiasts, and helps new data analysts improve their skills and build a competitive portfolio. Join in and sharpen your skills together with this open and friendly data community. Read more about the challenges on the FP20 Analytics website. Join the community on LinkedIn.
Why join the FP20 Analytics ZoomCharts Challenge?
Workshops & 1:1 Mentoring: Learn directly from experienced Power BI professionals through live workshops on report-building best practices, 1:1 mentoring sessions to review your report and get tailored advice.
Get Personal Feedback: Every participant receives detailed, personalized feedback on their report - a great opportunity to improve based on real input from seasoned analysts.
Free ZoomCharts PRO License: All participants get a ZoomCharts Developer License (worth hundreds of dollars) that gives full access to the Drill Down PRO visuals library.
🏆 Prize:
The best overall report using ZoomCharts visuals will win a $300 Amazon gift card. The ZoomCharts winner will be announced in a special live webinar session on September 30, where we will review the Top 5 entries from the challenge.
Read the challenge brief (see "The Brief" section)for additional info about the dataset and use-case.
2. Build your report in Power BI:
Set up an account in Power BI using the assigned license details (if you have participated in ZoomCharts Challenges in the past, you can use the same account you set up before).
Use the account to access the full library of custom ZoomCharts Drill Down visuals.
Use the dataset to build a Power BI report including at least 2 ZoomCharts Drill Down Visuals in one report page.
The recommended number of pages in the report is up to 3 pages, including drill-through pages.
Canvas size is 16:9 (Default Power BI size) or Full HD size = w:1920 - h:1080
3. Improve your report and learn new skills:
To learn more about applying ZoomCharts visuals in your reports, participate in the challenge workshop.
Check out the submissions from past challenges for inspiration.
4. Submit your challenge entry:
Log in to your account on this challenge page and submit your report in .pbix format for validation.
If your submission doesn’t match the challenge criteria, you will be notified by email indicating the reason. Don't worry if this happens! You can fix the issue and resubmit your report.
Your report will be reviewed within 1–2 business days. Once it’s validated, you’ll receive a Publish to Web link via email. You can use this link to add the report to your portfolio or share it publicly online.
All validated entries will also receive personalized feedback from the evaluation team via email within 1-2 business days. Use this feedback to revise your report and resubmit it before the deadline.
Note: Feel free to resubmit your entry as many times as necessary before the deadline.
5. Finalize your participation to compete for the ZoomCharts grand prize:
Post the final version of your submission in PDF format on your LinkedIn profile.
Use the caption "I am participating in FP20 Analytics ZoomCharts Challenge 30".
Include a summary of your report's key insights and add the ZoomCharts publish to web link (if available).
Use #FP20Analytics, #builtwithzoomcharts, tag @Federico Pastor and @Zoomcharts.
6. Attend challenge closing webinar to hear the results:
The submissions are evaluated by ZoomCharts team (see "Judging criteria" for more info). The submissions of Top 5 ZoomCharts Challenge finalists are analyzed live during the challenge closing webinar to share the best practices and learning opportunities with the community.
The author of the best report is awarded a $300 Amazon gift card.
Technical requirements
Build your report using Power BI
The recommended number of pages in the report is up to 3 pages, including drill-through pages.
Canvas size is 16:9 (Default Power BI size) or Full HD size = w:1920 - h:1080
The report should contain at least 2 ZoomCharts Drill Down visuals within a single page. See a practical guide for using Drill Down PRO visuals.
The Brief
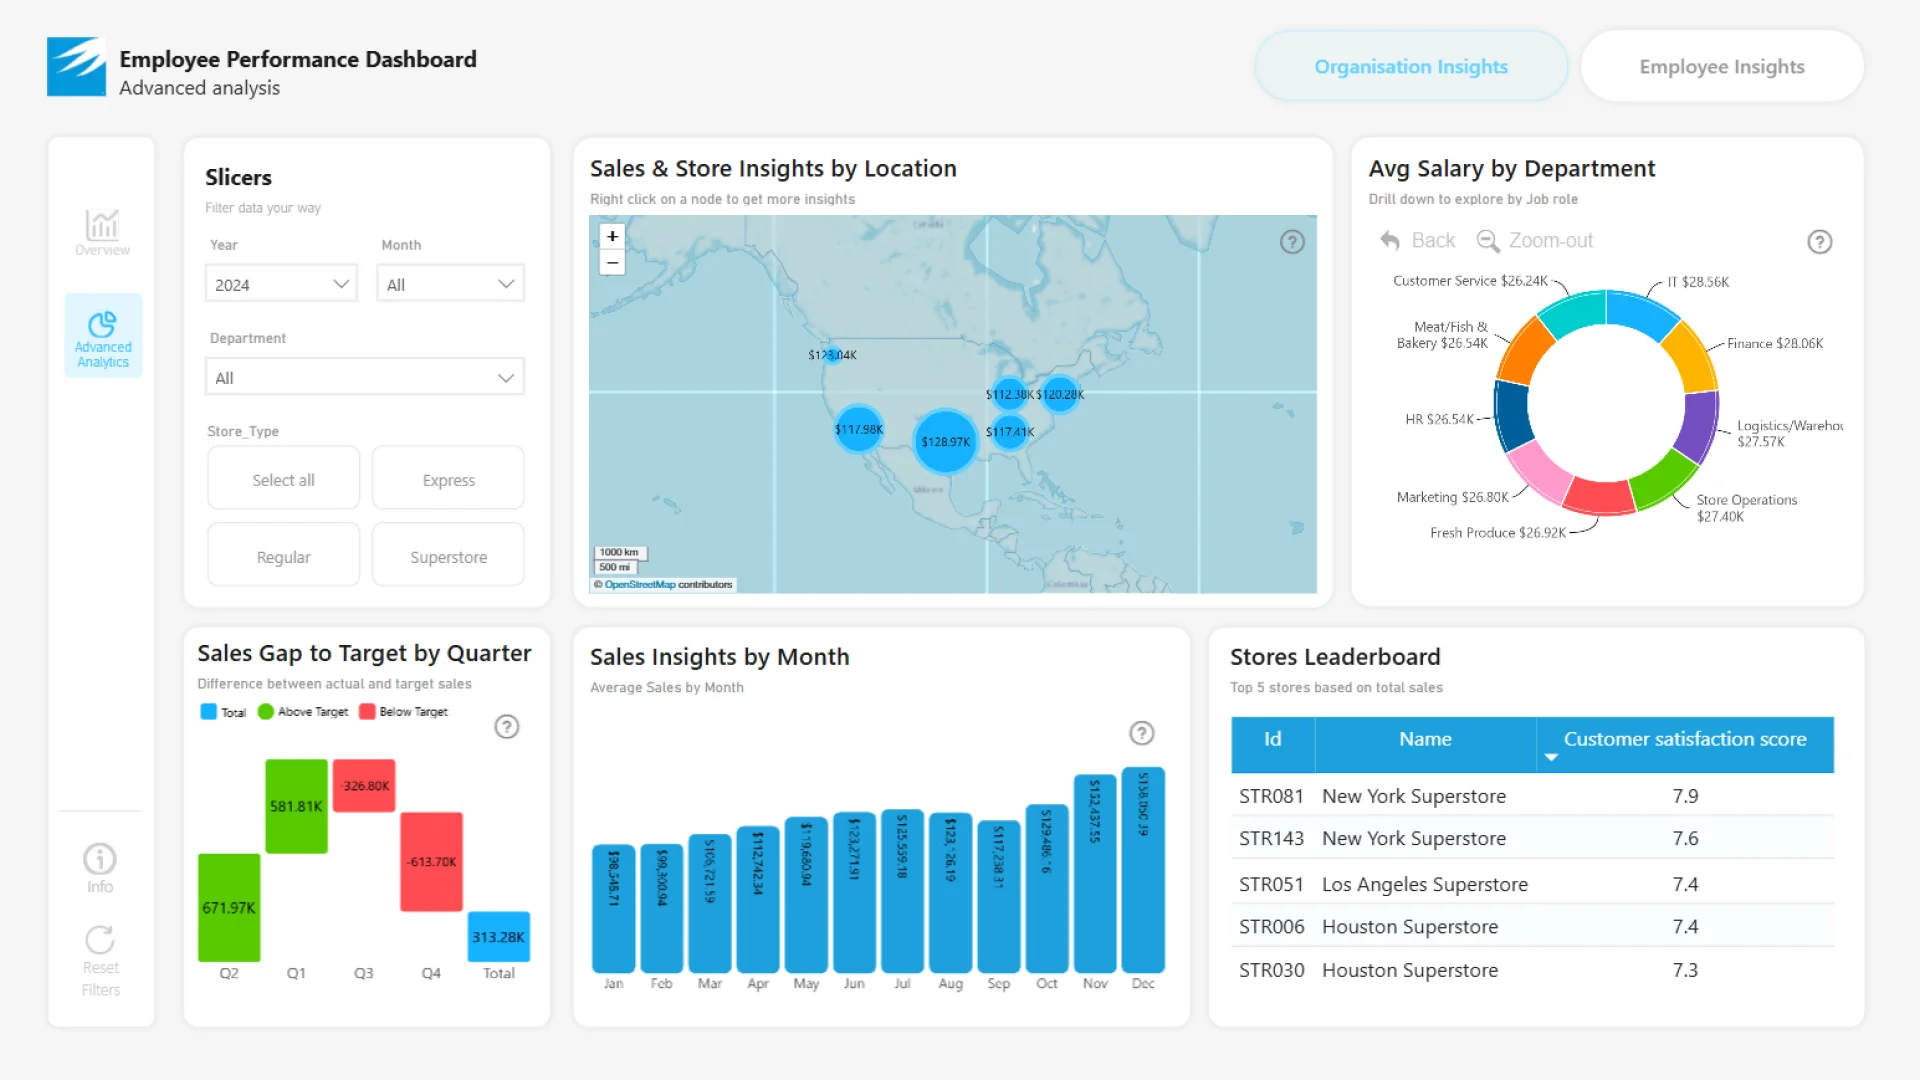
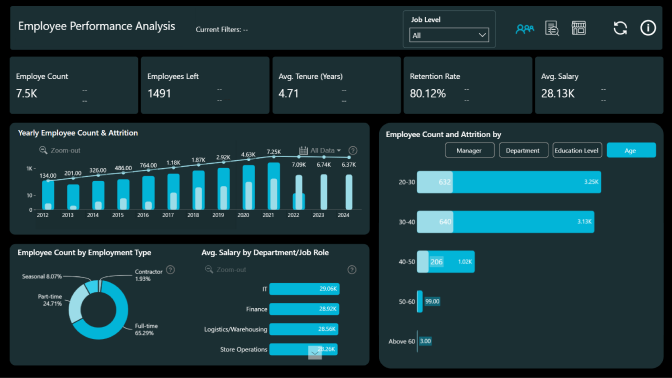
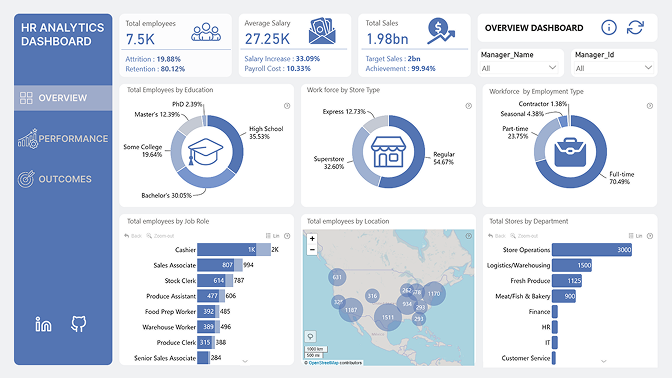
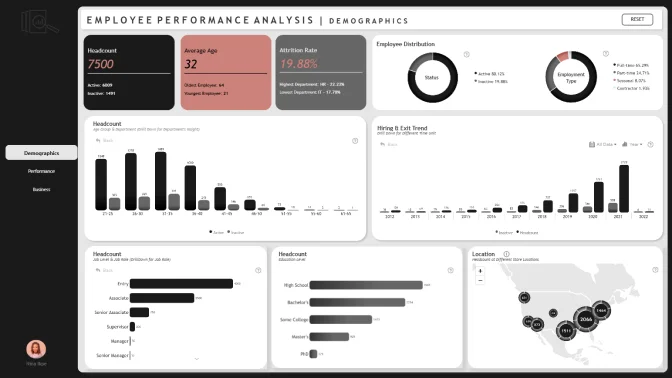
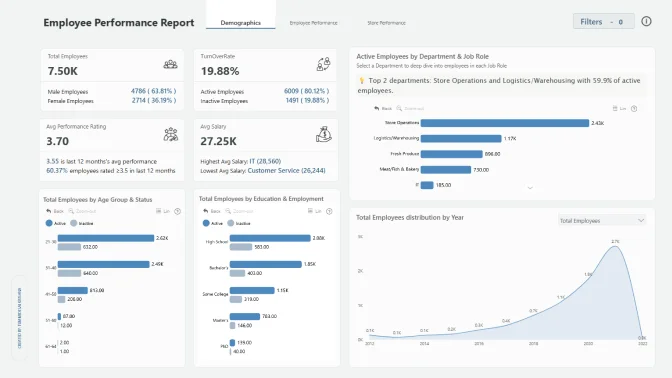
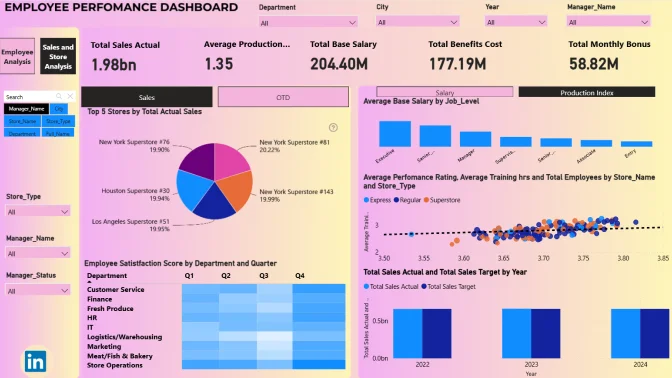
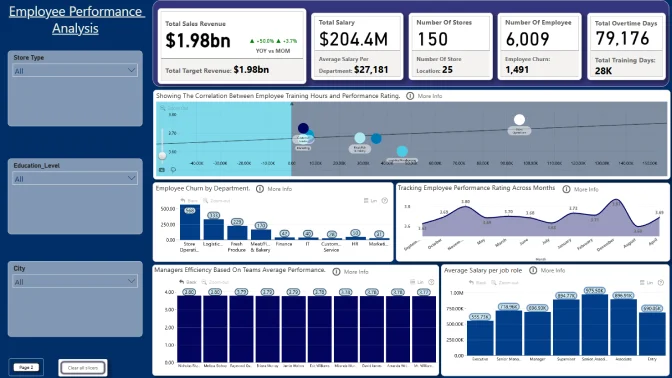
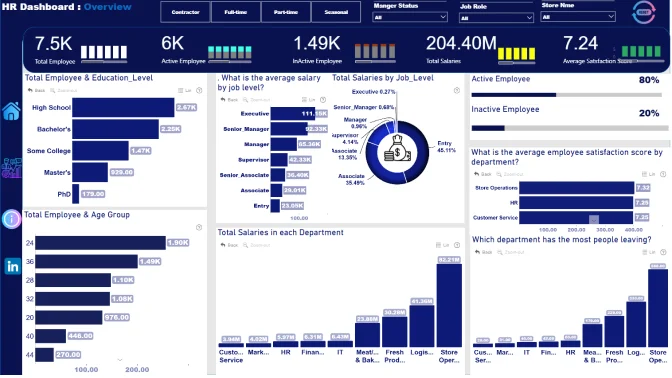
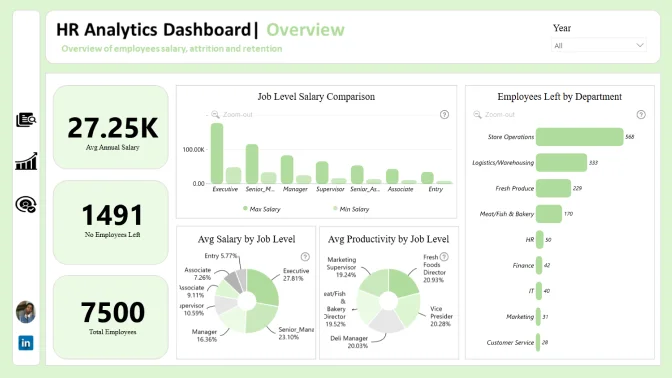
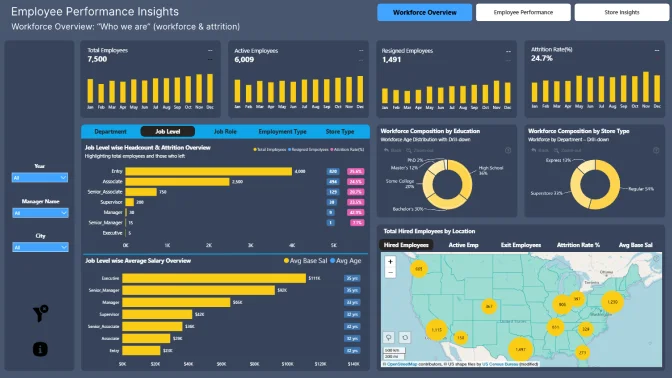
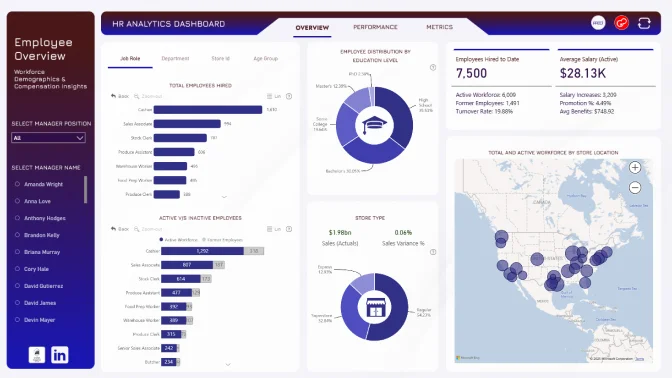
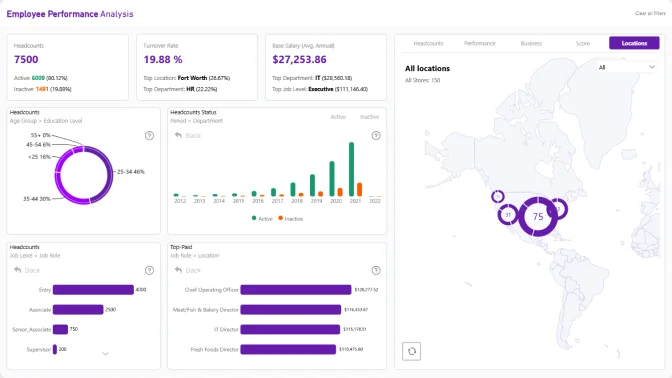
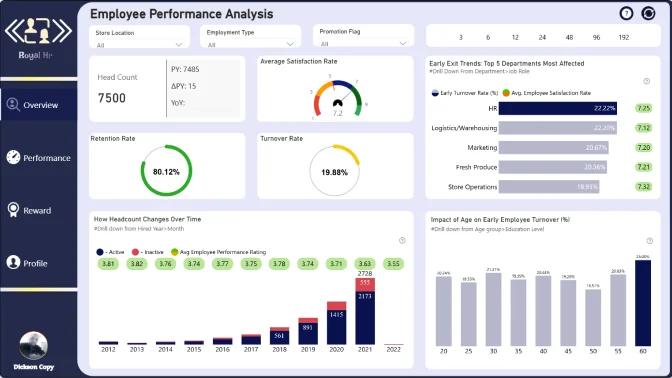
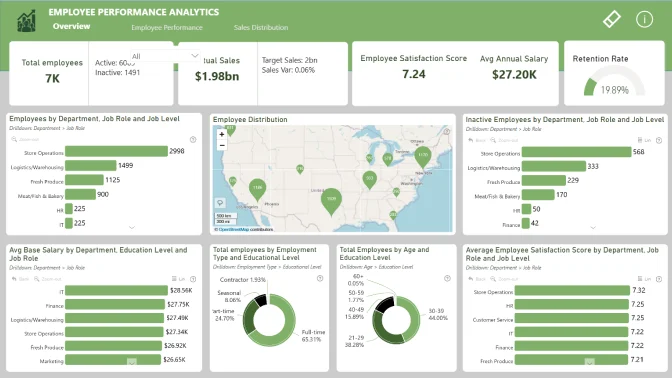
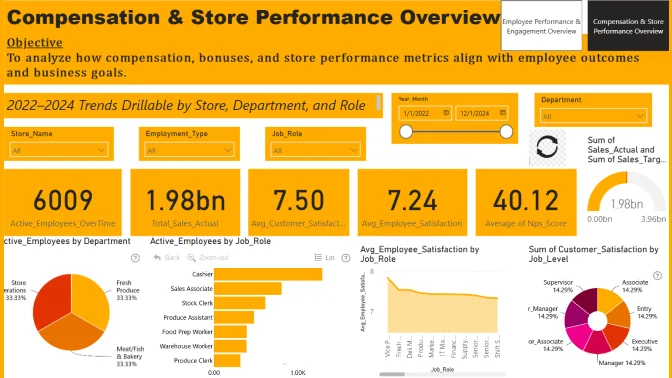
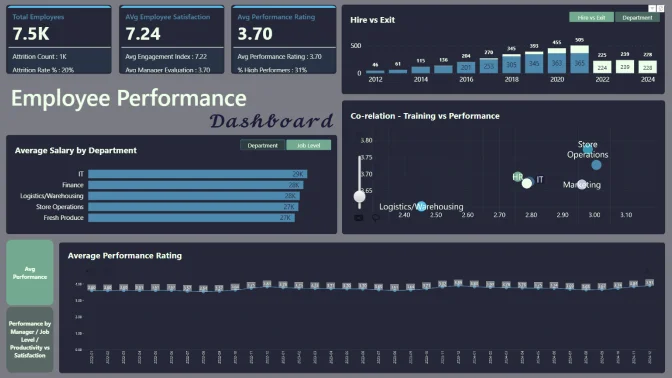
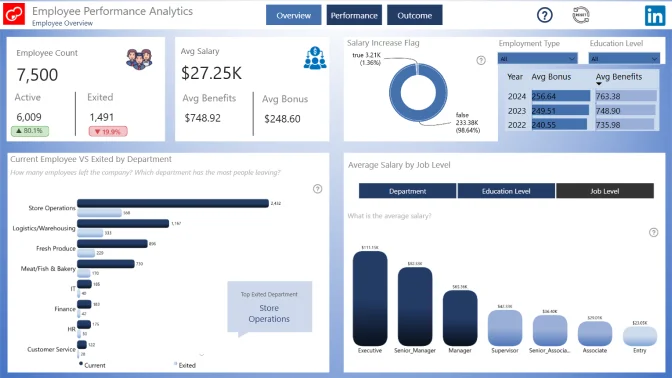
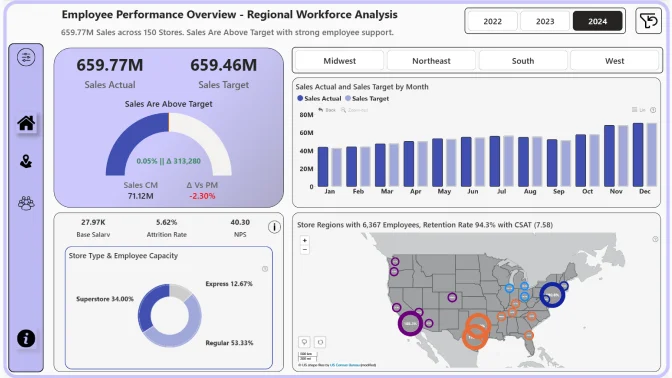
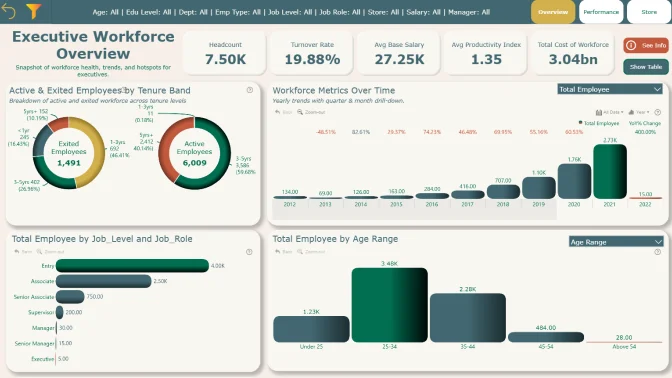
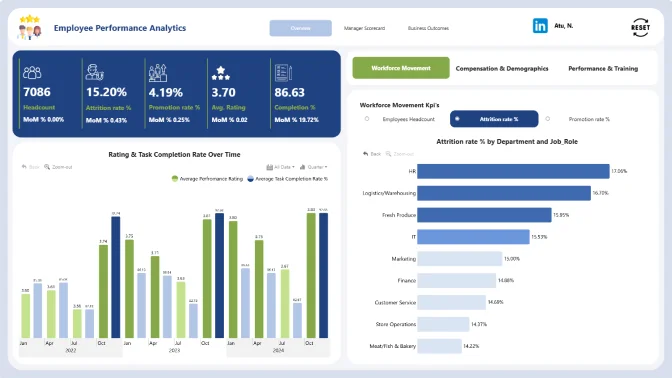
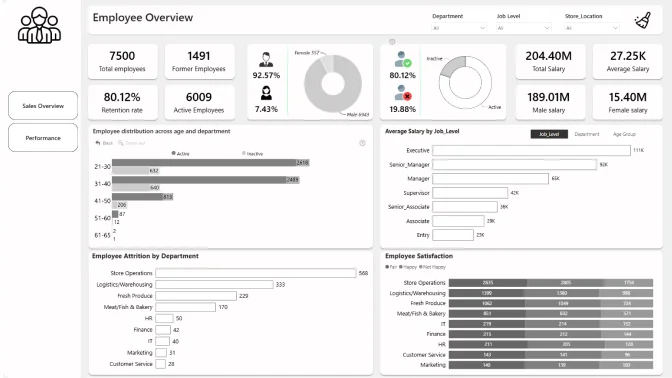
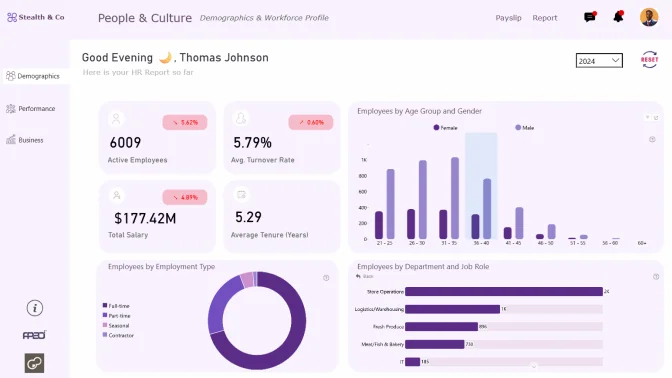
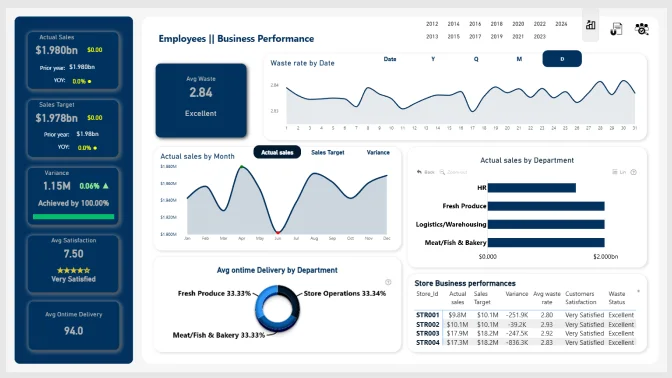
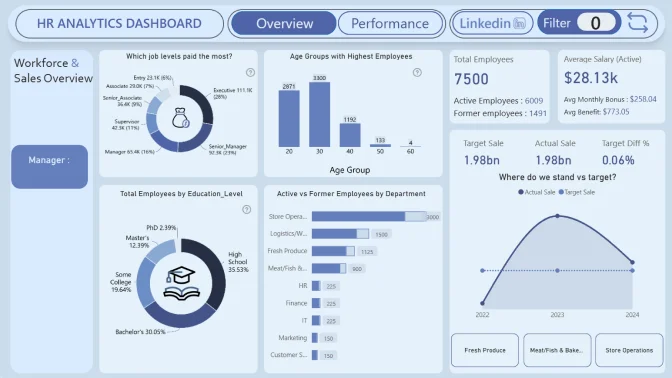
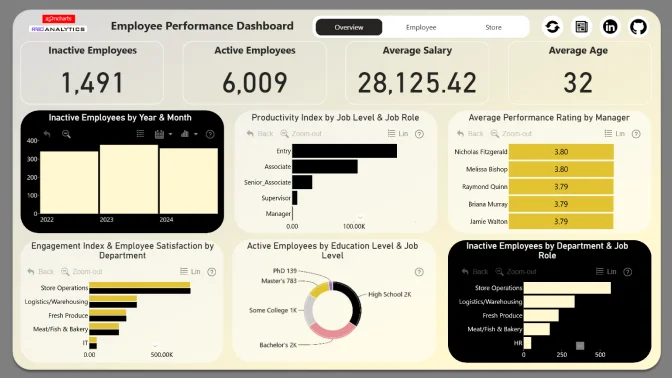
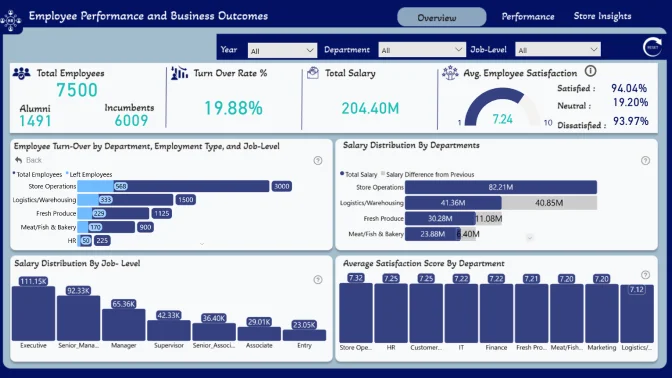
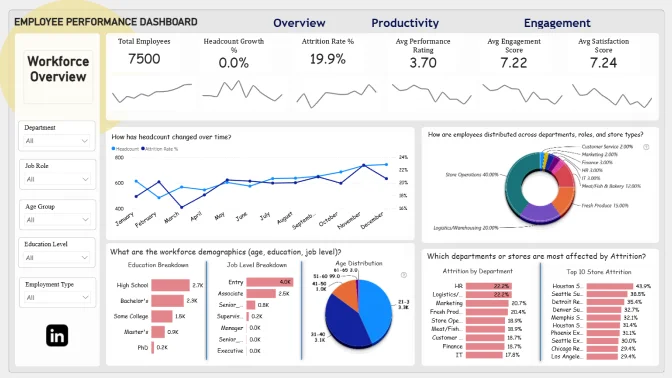
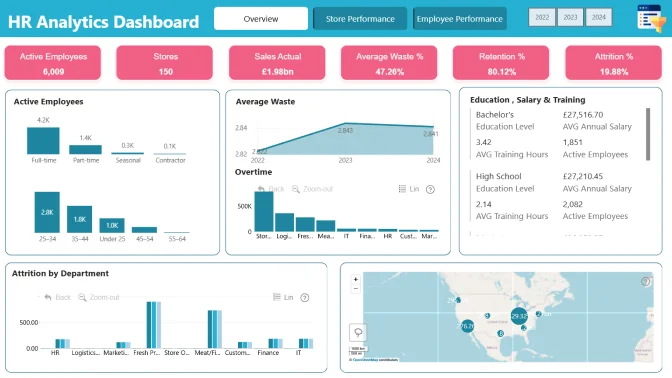
In this challenge, you'll step into the role of an HR data analyst working with a comprehensive dataset of over 497,000 detailed employee performance records. Your goal is to analyze workforce patterns and uncover actionable insights that HR teams and business leaders can use to improve employee satisfaction, optimize performance, and enhance organizational effectiveness.
The dataset you'll explore resembles a professional HR management system, and includes attributes and metrics such as:
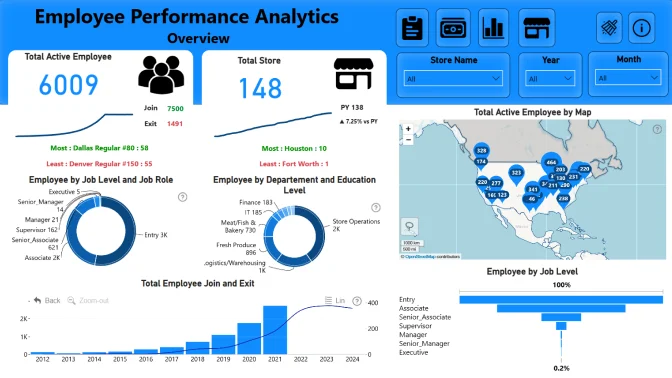
Employee demographics, education level, job roles, and organizational hierarchy
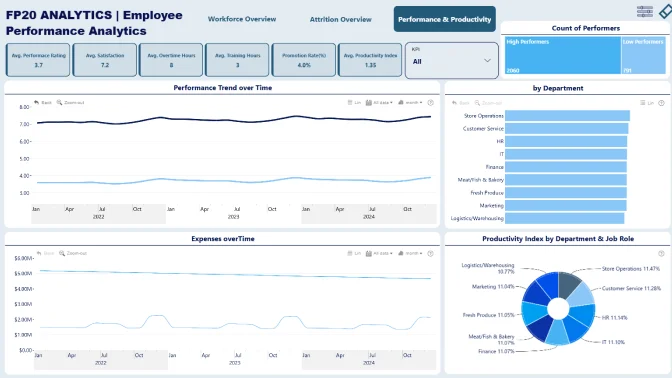
Performance ratings, training hours, overtime, absenteeism, and engagement metrics
Compensation data including salaries, bonuses, and benefits costs
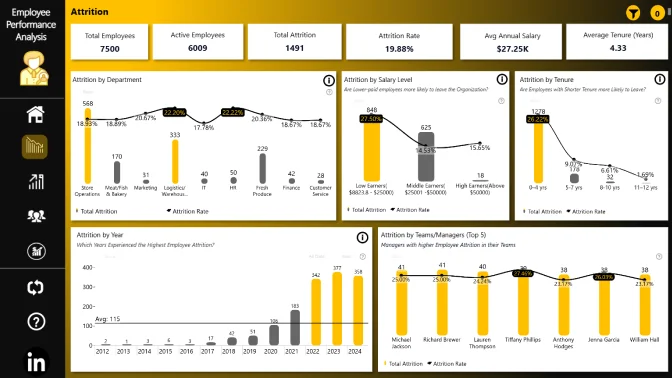
Manager relationships, promotion flags, and career progression indicators
Store locations, departments, employment types, and business outcomes
Monthly performance tracking across 3 years (2022-2024)
Role-specific KPIs, productivity indices, and customer satisfaction scores
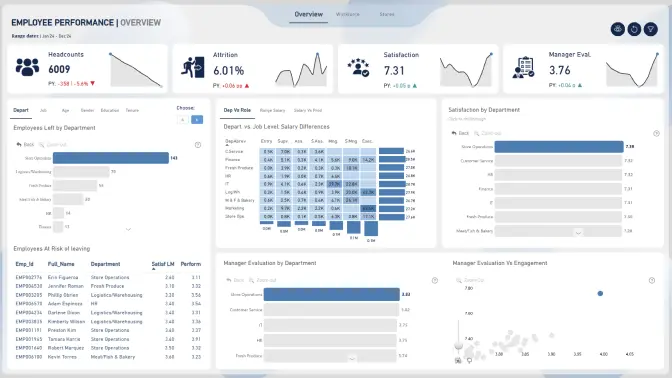
Your task is to analyze this comprehensive dataset to help organizations identify top-performing employees and departments, evaluate compensation effectiveness, assess manager performance and team dynamics, discover patterns in employee satisfaction and retention, and provide recommendations to improve workforce productivity and organizational culture.
Dig into the data, identify key insights, and help organizations prioritize employee development, optimize compensation strategies, and maintain high-performance standards.
Judging criteria
Business users use reports to make data-driven decisions. That’s why reports are called effective if they enable users to drill down and filter data quickly and intuitively to find answers to any question they might have, and analyse data in all possible directions and dimensions.
Each report is evaluated based on three main criteria: intuitiveness, insightfulness, and interactivity. These factors ensure that the reports are not only accurate and functional, but also meet the target audience's needs and are ready to be presented to the end-users.
Intuitive: How clear and easy it is to understand the report at a glance? (max 15 points)
Is the report visually appealing?
Choice of charts and visual elements
Does the report tell a story?
Is it not overwhelming to the user?
Choice of tooltips, titles, and legends
Interactive: How engaging and seamless is the report exploration and interaction with data? (max 15 points)
Clear navigation that allows user to explore the report
Use of slicers and other interactive elements
Smooth cross-chart integration
Is report optimized for touch devices?
Are tutorials and guiding elements helpful to the user?
Insightful: How accurate, complete, and meaningful is the data in driving decisions? (max 15 points)
Depth of analysis
Data cleaning and preparation
Does data show up accurately in the report?
Is report optimized for quicker loading time?
Does the report provide deeper exploration of data (drill-down)?
Use the email and password provided below to log in Power BI Desktop and access an account with a license to use all ZoomCharts Drill Down Visuals.
*This Developer License can be used to create a report for this ZoomCharts Mini Challenge or for your personal training purposes. Commercial use of this license is prohibited.
Any questions? Feel free to use chat!
Are you sure you want to delete the report?
Activate your Drill Down visuals Developer License!
You can use these credential to access ZoomCharts visuals and create your report for this ZoomCharts Mini Challenge, or for your personal training purposes.
Get ZoomCharts Developer License
Select this option if you already have a Microsoft work or school account to activate and use ZoomCharts visuals in Power BI Desktop.
Activate your free developer license to use Drill Down visuals in your challenge report.
Create a free Microsoft account
To install ZoomCharts visuals from the Power BI marketplace, you need a Microsoft account.
Don’t have a Microsoft account yet? Create a free account to build reports and join challenges.
warning
Error message
success
Success info: Done!
We noticed you're using an old OS version.
For the best experience, we recommend upgrading to ensure that all website features display correctly.
Cookie settings
We use necessary cookies for site functionality, as well as statistic, marketing, and preference cookies to enhance your experience. For more information and to manage your preferences, please visit our Cookie policy