887
Employee Performance HR Report 9
Employee Performance HR Report 9
More Report pages
Report Author: Crystal Andrea Dsouza
887
Share template with others
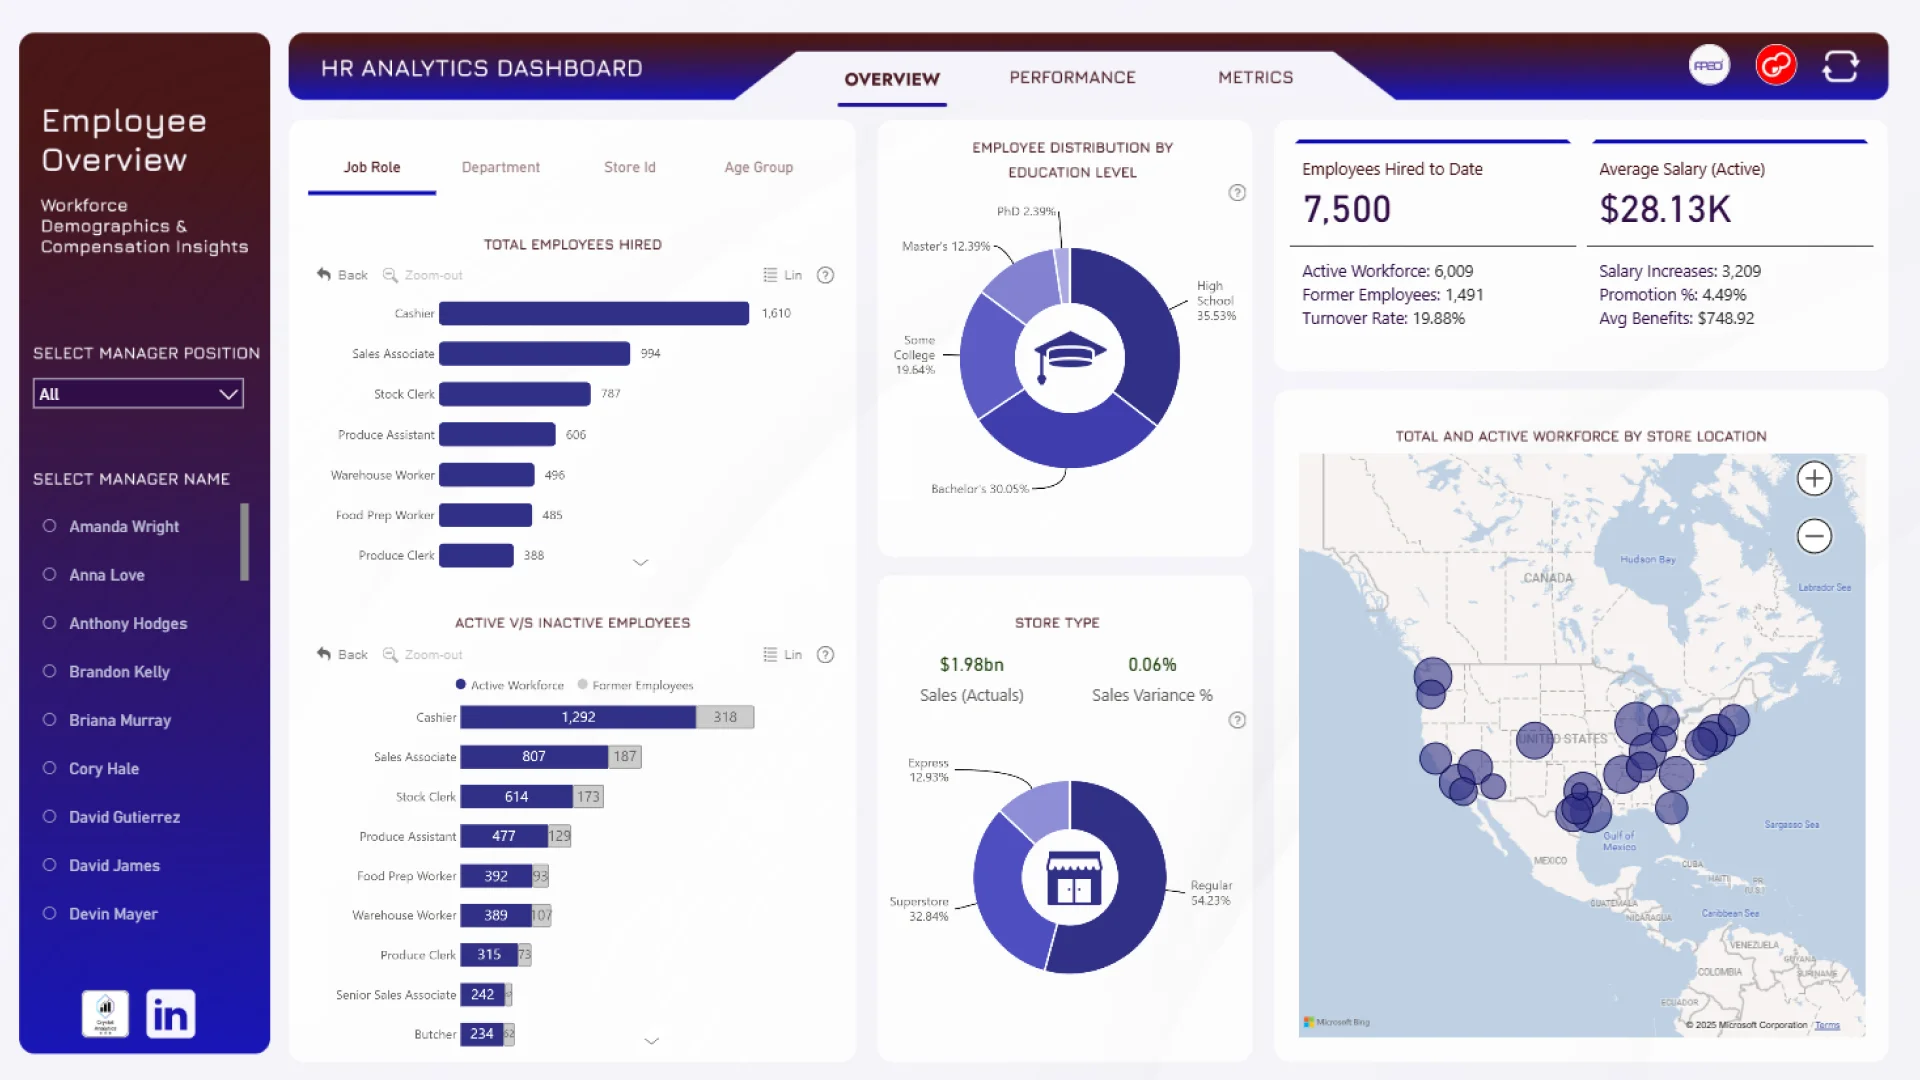
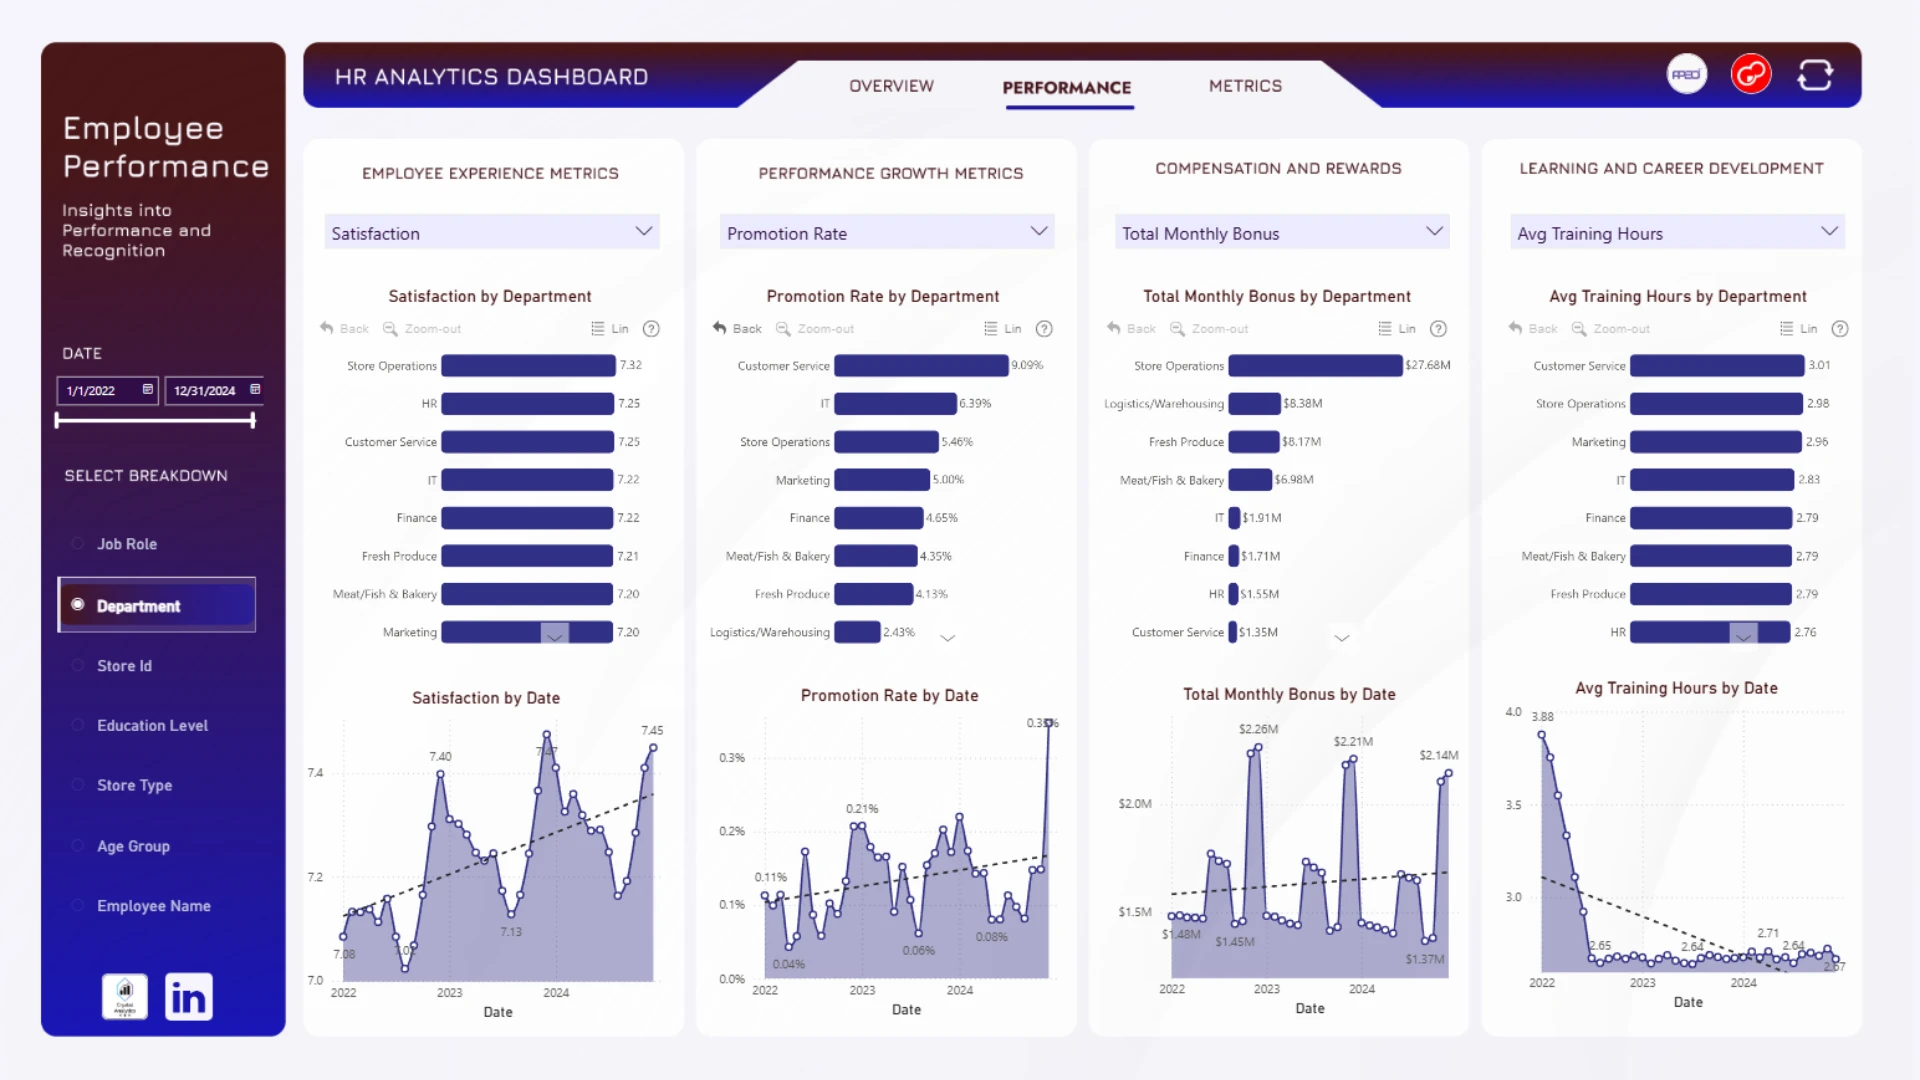
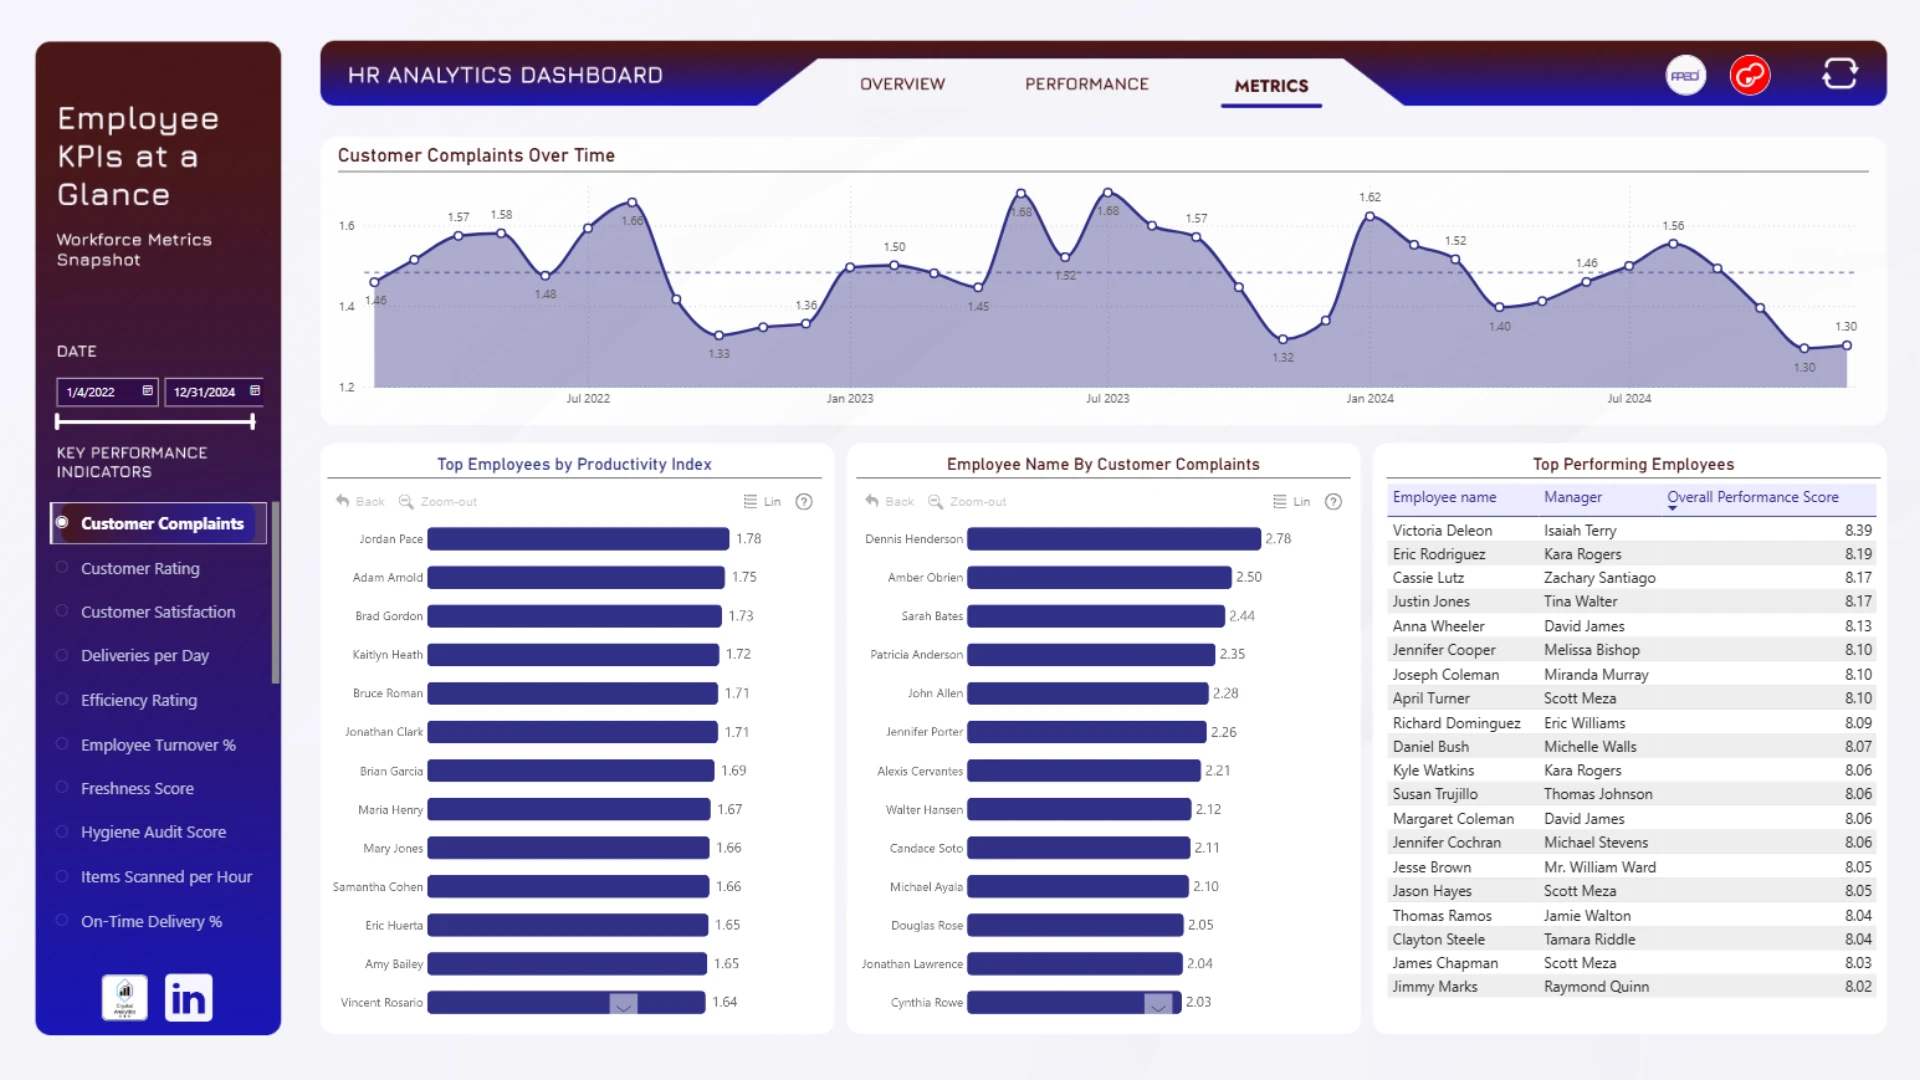
This Power BI report uses the Employee Performance HR dataset and features ZoomCharts Drill Down PRO custom visuals for Power BI. It was submitted to the FP20 Analytics ZoomCharts Data Challenge 30 in September 2025.
Author's Description:
HR Analytics dashboard is designed to uncover workforce performance and retention insights. The dashboard highlights employee trends, compensation, and recognition while also diving into KPIs like productivity, efficiency, and customer satisfaction. A key feature is the use of Field Parameters, allowing users to dynamically switch between metrics for deeper analysis. I also integrated ZoomCharts for advanced visual interactivity, making the insights more intuitive and user-friendly for HR teams.


4U Report Challenges
Participate in data challenges, build and submit reports to get free template downloads.
Join CommunityMobile view allows you to interact with the report. To Download the template please switch to desktop view.

How to use a PBIX template
Preview the interactive report, download the PBIX file, open it in Power BI Desktop, and replace the same data connection with your own dataset.
Preview and download
Explore the report online and download the PBIX template file.
Open in Power BI Desktop
Open the downloaded PBIX file in Power BI Desktop.
Connect your data
Replace the sample data source with your own dataset.
Refresh and adjust
Refresh the model and update fields or visual were needed.
Save and share
Save your report and publish it for your audience.


