3814
Employee Performance Dashboard
Employee Performance Dashboard
More Report pages
Report Author: Arunkumar D
3814
Share template with others
This Power BI report uses the Employee Performance HR dataset and features ZoomCharts Drill Down PRO custom visuals for Power BI. It was submitted to the FP20 Analytics ZoomCharts Data Challenge 30 in September 2025.
Author's Description:
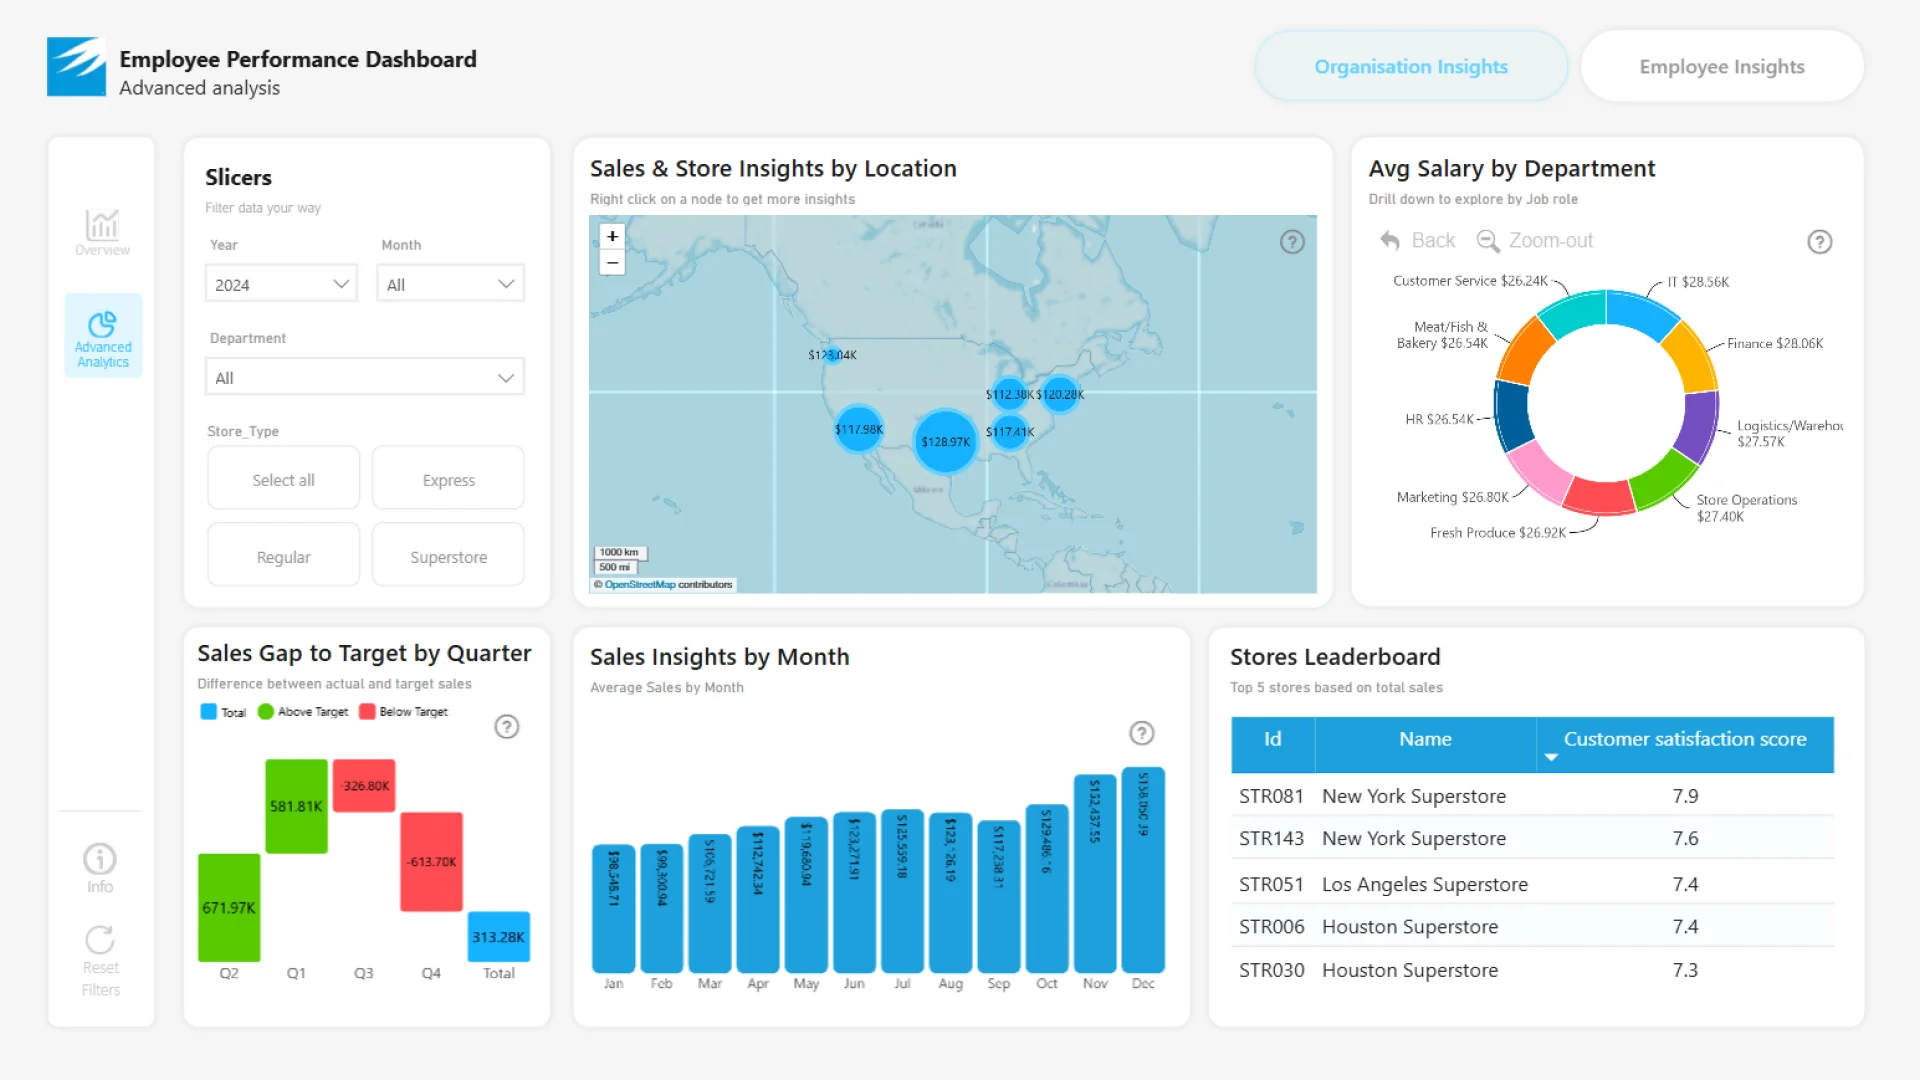
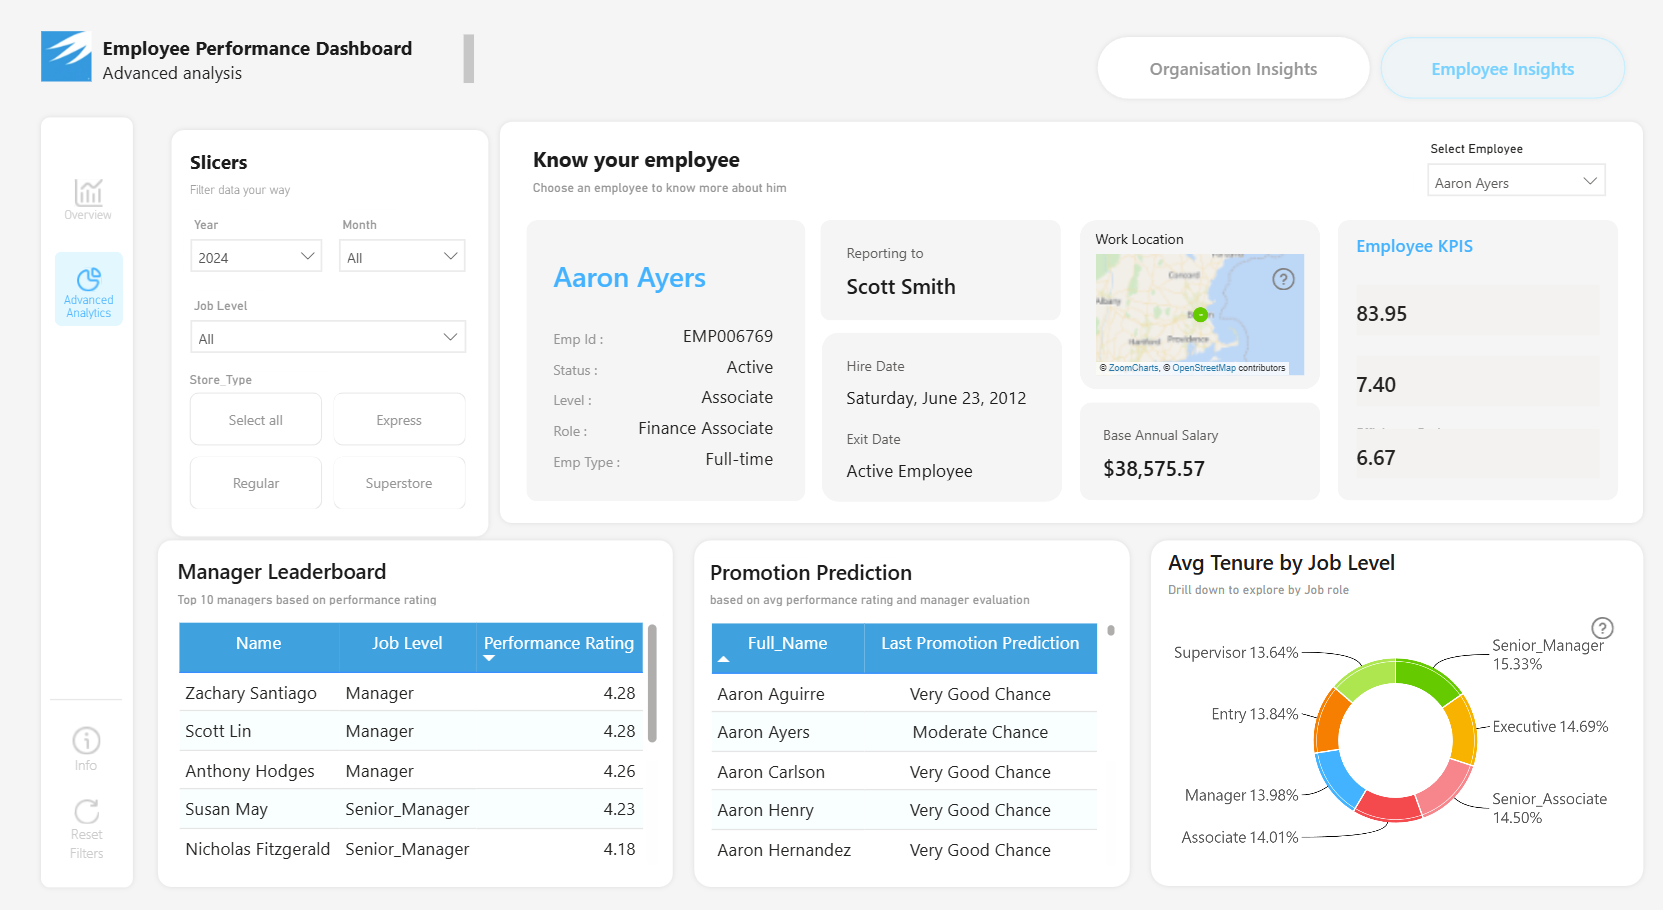
This dashboard was created for the FP20 Analytics September 2025 Challenge, using a rich dataset of over 497,000 employee records. It provides a comprehensive view of workforce performance, training impact, compensation effectiveness, and organizational health. The report is structured into two main pages: Page 1: Overview Offers high-level KPIs and visual insights into employee performance, training, salary trends, and health metrics. Page 2: Advanced Analysis Includes two interactive bookmarks: Organisation Insights: Focuses on sales performance, departmental salary distribution, and store-level metrics. Employee Insights: Provides detailed employee profiles and performance breakdowns. Interactive filters and navigation buttons allow users to explore the data dynamically.
ZoomCharts visuals used
4U Report Challenges
Participate in data challenges, build and submit reports to get free template downloads.
Join CommunityMobile view allows you to interact with the report. To Download the template please switch to desktop view.


Was this helpful? Thank you for your feedback!
Sorry about that.
How can we improve it?