logo
For Power BI
  • Products
    • Custom Visuals for Power BI
    • Report Templates
  • Resources

      Resources

    • Documentation
    • Report Examples
    • Blog
    • Webinars
    • Video Tutorials
    • Visuals Gallery

    Support

    • ZoomCharts Assistance
    • Contact Sales
    • Contact Support
    • FAQ

    Challenges

    Challenges

    Improve your report creation skills by participating in free challenges for report creators.

    Learn more
    Get Developer License
  • Services
    • Power BI Report Development
    • Custom Visual Development
  • Challenges
  • Pricing
    • Custom Visuals for Power BI
    • Report Templates
Request a quote Get Developer License Sign in
Request a quote Book a Demo Get Developer License Sign in
Get it now
Go back

Contents

Reset your password

We'll email you instructions on how to reset your password

Go back

Share

Logo

Welcome to the FP20 Analytics December 2025 Challenge!

Dec 10 - Jan 09, 2025 | EST

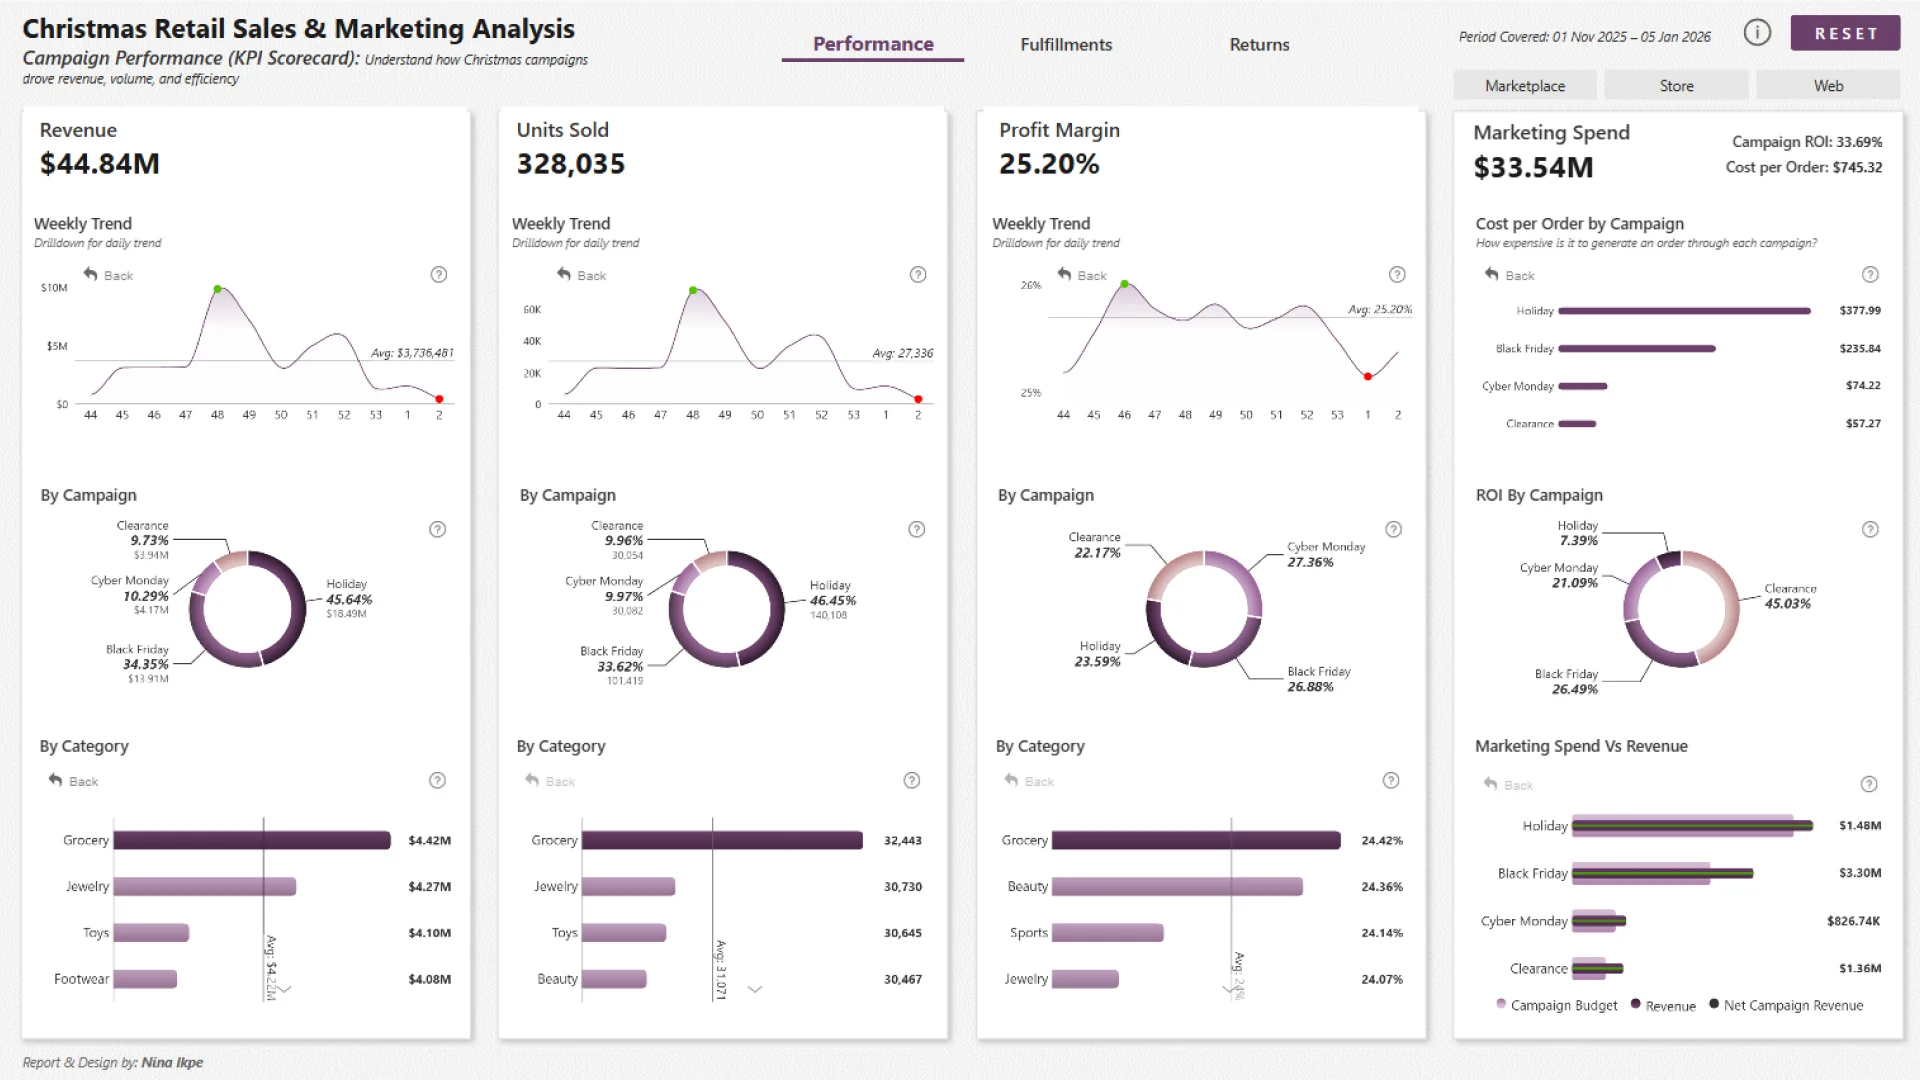
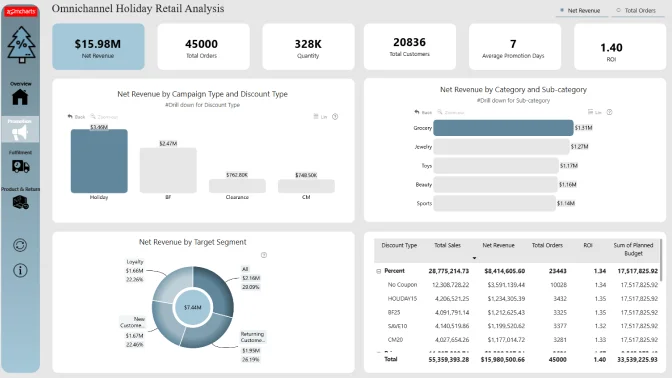
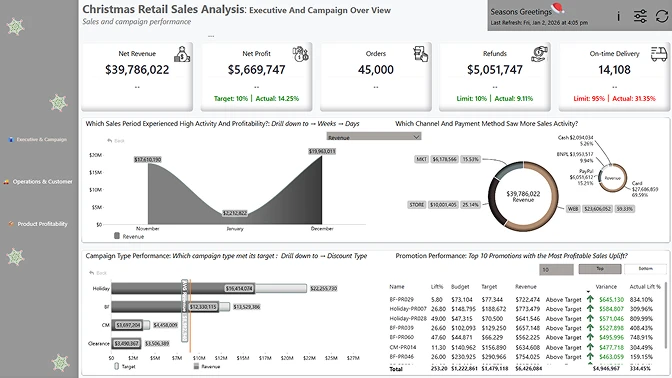
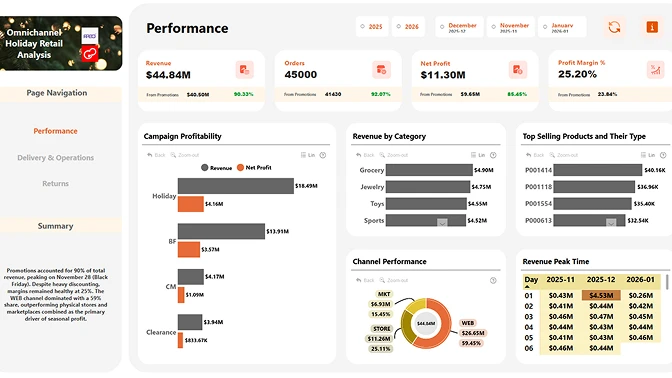
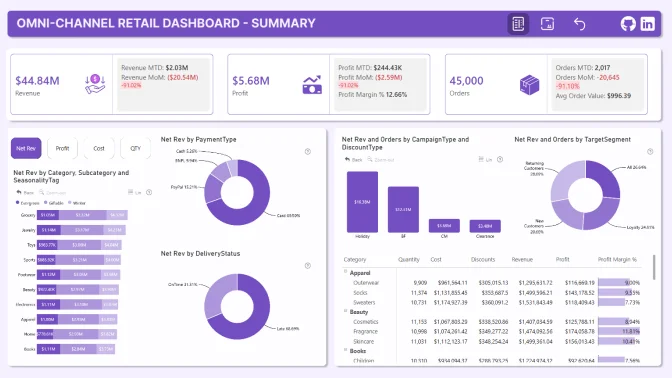
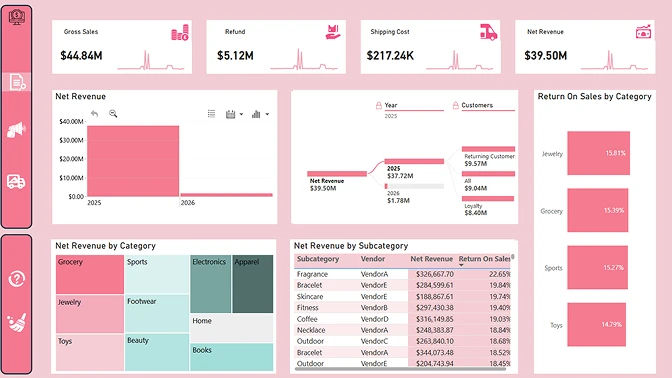
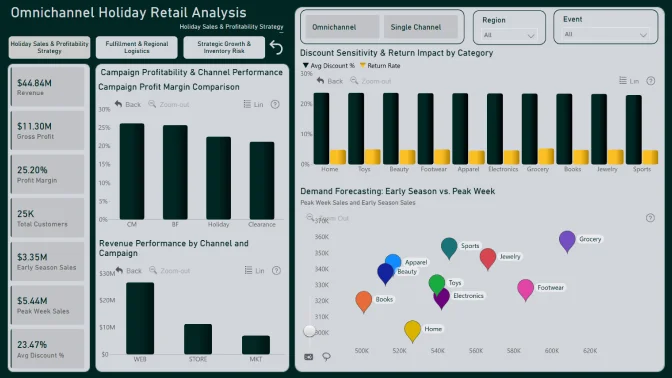
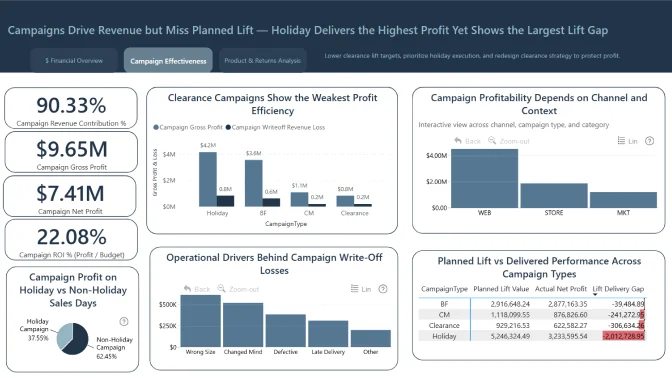
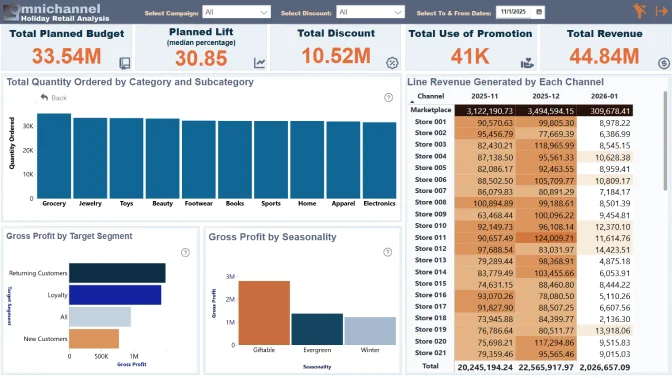
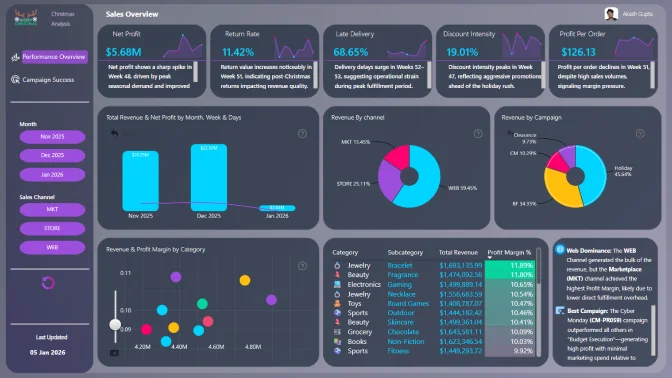
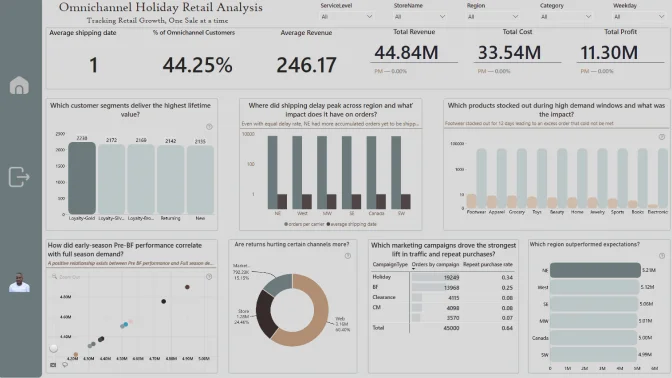
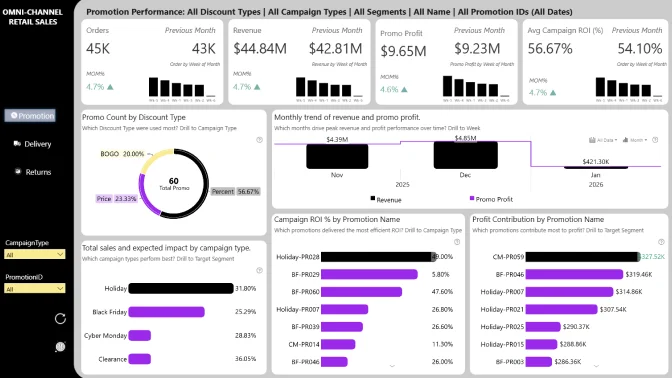
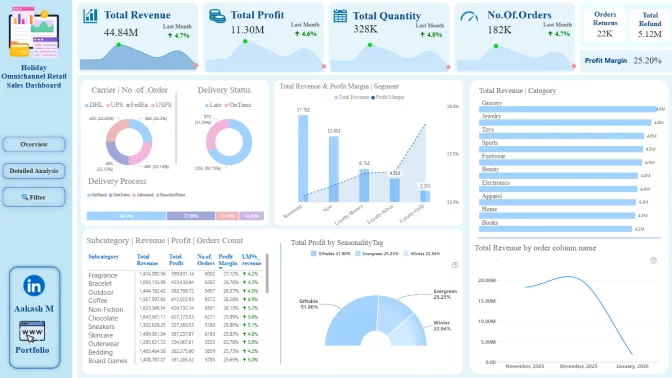
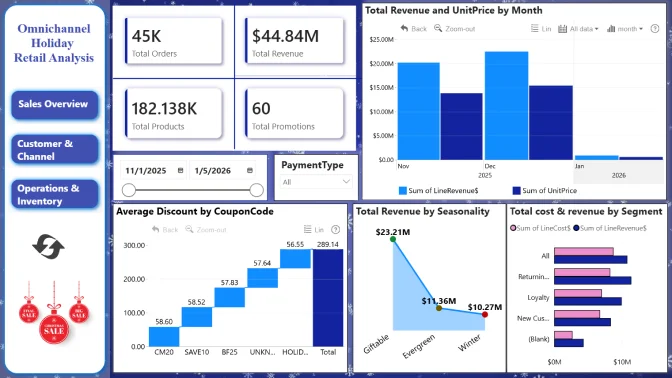
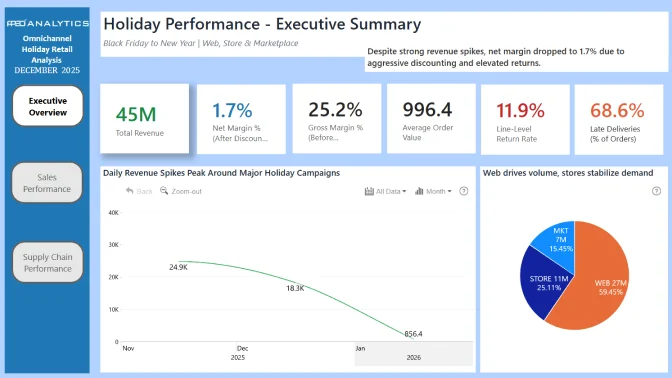
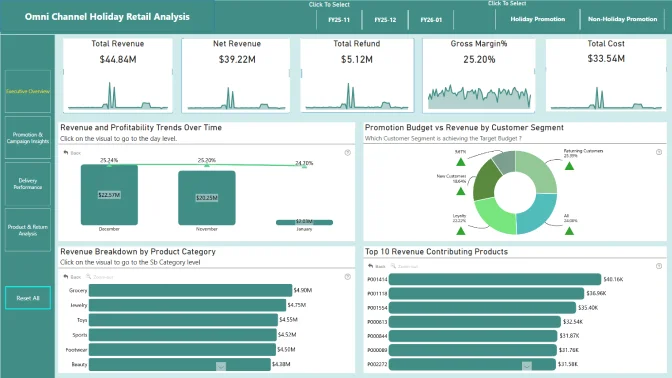
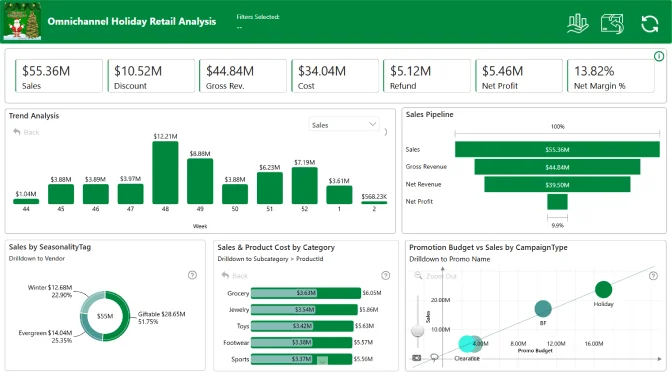
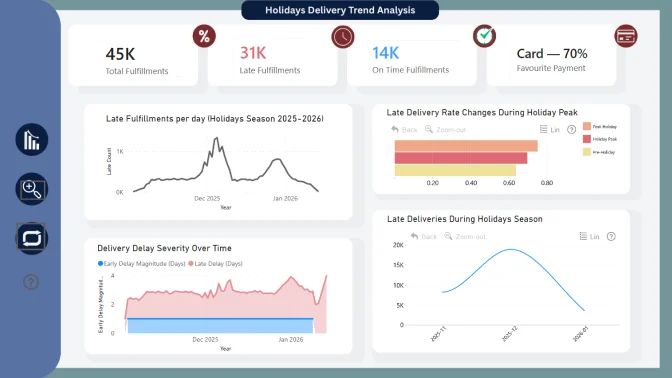
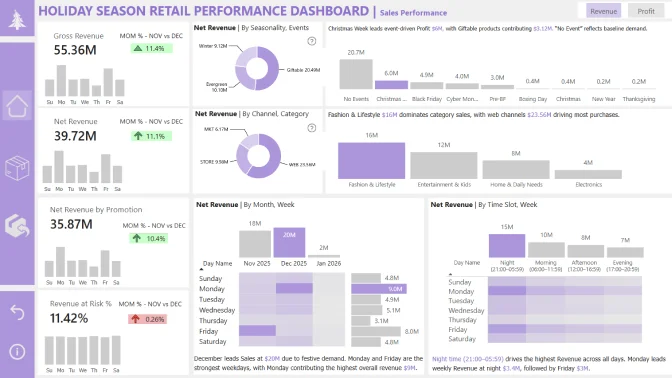
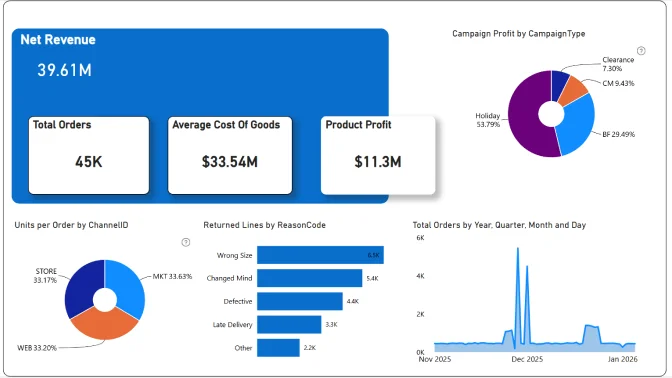
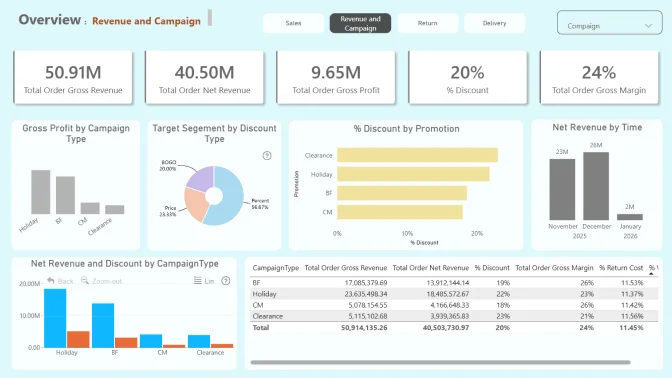
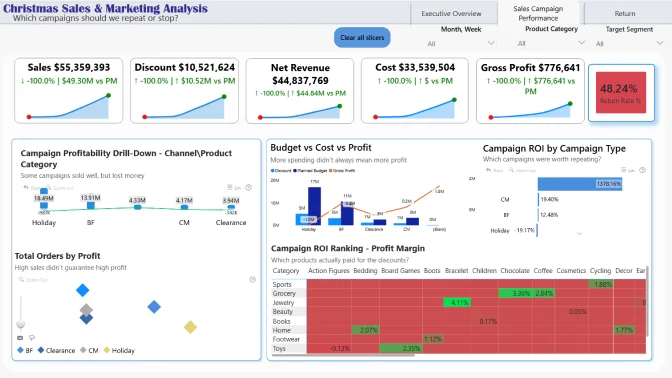
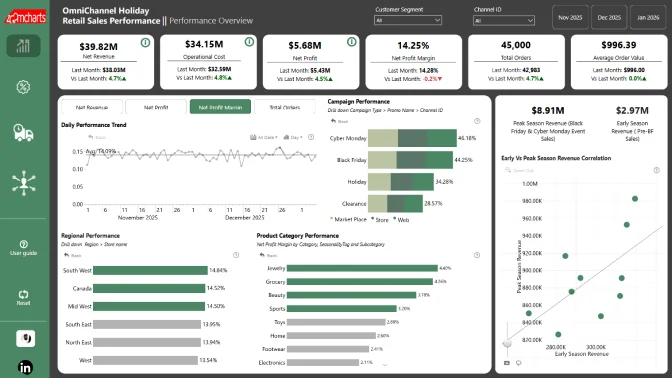
Take on the challenge of analyzing a festive season retail dataset covering sales across Web, Stores, and Marketplaces, including Christmas and holiday campaigns from Black Friday to New Year.

Submission deadline

00

DAYS

00

HOURS

00

MINUTES

00

SECONDS

Sign in or sign up to continue

Make sure you provide an email address that you check regularly.


Already have an account? Sign in!

Login options
Forgot password?

Register for the FP20 Analytics Challenge with ZoomCharts!


Activate your ZoomCharts Drill Down visuals Free Developer License!

Go to your dashboard to download your free ZoomCharts Developer License and see how to apply it in Power BI Desktop here 👇


Ready to submit your report for review?

Thank you! Your report has been submitted!

View report

Submitted:

Your report will undergo validation. Once the validation of your report is complete, we will send you a Power BI Publish to Web link that you can share publicly.

Confirmed your submission fits the criteria:

Reviewed:

Rejection reason:

Sorry, we are no longer accepting entries for this competition. Stay tuned for future events!

Something went wrong, please contact support!

Timeline

Registration Open

Registration Open

10 December | 03:00

-

Submissions Open

Submissions Open

10 December | 03:00

-

Workshop | Designing Interactive Christmas Retail Reports with Power BI

Workshop | Designing Interactive Christmas Retail Reports with Power BI

16 December | 08:00

-

1:1 Mentoring Sessions

1:1 Mentoring Sessions

16 December | 08:00

10 December - 06 January

Entry Submission Deadline

Entry Submission Deadline

06 January | 16:59

10 December - 06 January

Webinar | Reviewing the Top 5 Power BI Reports for Christmas Retail and Marketing

Webinar | Reviewing the Top 5 Power BI Reports for Christmas Retail and Marketing

09 January | 08:00

10 December - 06 January

Winner Announced

Winner Announced

09 January | 08:00

10 December - 06 January

Dataset

Get the dataset

Share the challenge

About challenge
How to participate
The Brief
Judging criteria
Timeline
Dataset
My license
Mentoring

About the FP20 Analytics ZoomCharts Data Challenge

🏆 Main Prize: $300 Amazon Gift Card

Want to build professional Power BI reports and grow your portfolio?

This challenge helps you level up with expert feedback, hands-on workshops, webinars with MVPs, and visibility in our public results showcase. It’s a great way to learn, gain recognition, and connect with a supportive data community.

The challenge is hosted in partnership with FP20 Analytics - a LinkedIn community that brings together 20k+ passionate data professionals and helps new analysts improve their craft. It’s a welcoming space where you can practice, learn, and share your work with others. Learn more about the FP20 Analytics challenge on their website.


Benefits of joining FP20 Analytics ZoomCharts Challenge

Live Workshops & 1:1 Mentoring

Learn directly from experienced Power BI professionals. Enjoy practical workshops on report-building techniques and book a one-on-one mentoring session to receive tailored advice on your submission.

Personalized Feedback

Every participant receives detailed, constructive feedback on their report. It’s a valuable opportunity to improve your skills with real insights from seasoned analysts.

Free ZoomCharts Custom Visuals License

All participants receive a ZoomCharts Developer License, giving you full access to the Drill Down PRO visuals library.

Free Report Downloads

Each challenge participant with a validated report will receive 5 free downloads from the Power BI Report Gallery.

Prizes 🏆

  • The best report using ZoomCharts visuals will receive a $300 Amazon Gift Card.
  • Being selected in the Top 5 will grant you +10 free downloads from the Power BI Report Gallery.

The winners will be announced during a special live webinar on January 9: "Reviewing the Top 5 Power BI Reports for Christmas Retail and Marketing".


Guest Judge of the Challenge

Erik Svensen, Innovation Lead & Microsoft MVP


Webinars

Learn more about ZoomCharts visuals & gain a knowledge advantage in the contest by joining the upcoming webinars! You'll also get the chance to your ask questions and get expert answers in the Q&A section.

Upcoming webinars

Recording thumbnail

Designing Interactive Christmas Retail Reports with Power BI

16th December, 2025

08:00 AM - EST

Join this hands-on Power BI workshop to explore the Christmas Retail Sales & Marketing dataset and learn how to build interactive, insight-driven reports using Power BI.

Learn more
Recording thumbnail

Reviewing the Top 5 Power BI Reports for Christmas Retail and Marketing

9th January, 2026

08:00 AM - EST

Discover the best visualization, storytelling, and interactivity practices as our experts walk through the top Power BI reports built on the Christmas Retail data.

Learn more

How to Participate in the FP20 Analytics & ZoomCharts Challenge

1. Register for the Challenge

  • Register using the form above on this page.

  • Download the dataset using the Get the Dataset button on the left side of the page.

  • Read the challenge brief in the The Brief section to understand the data and requirements.

  • Activate your free Drill Down Visuals Developer License for Power BI. (watch the setup video or follow the step-by-step instructions).


2. Build Your Report in Power BI

  • Add your ZoomCharts license to Power BI Desktop.

  • Add ZoomCharts visuals from the Power BI visuals library or Microsoft Marketplace.

  • Build your report using the challenge dataset.
    Your report must include at least two ZoomCharts Drill Down Visuals on the same page.

  • Recommended report format:

    • Up to 3 pages (including any drill-through pages)

    • Canvas size: 16:9 (default) or 1920 × 1080 (Full HD)


3. Improve Your Report and Learn New Skills

  • Join the challenge workshop to learn how to use ZoomCharts visuals effectively.

  • If you need help, book a free 1-on-1 consultation with the ZoomCharts team.

  • Look at previous challenge submissions for ideas and inspiration.


4. Submit Your Challenge Entry

  • Log in to your account on this page and upload your report in .pbix format for validation.

If your report does not meet all requirements:
You will receive an email explaining what needs to be fixed.
You can update your report and submit it again.

Validation timeline:

  • Your report will be reviewed within 1–2 business days.

  • Once validated, you will receive a Publish to Web link that you can use in your portfolio or share online.

  • You will also receive personalized feedback within 1–2 business days to help you improve your report before the deadline.

Note:
You may resubmit your entry as many times as needed before the challenge deadline.


5. Finalize Your Participation to Compete for the ZoomCharts Grand Prize

To be eligible for prizes, complete these steps:

  1. Post the final version of your report (PDF) on your LinkedIn profile.

  2. Use this caption:
    "I am participating in FP20 Analytics ZoomCharts Challenge 33"

  3. Include a short summary of your key insights and the Publish to Web link (if you have one).

  4. Use the hashtags #FP20Analytics and #builtwithzoomcharts and tag @Federico Pastor and @ZoomCharts.

  5. Obligatory! Share your report also in the FP20 Analytics LinkedIn Community group.

  6. Follow ZoomCharts on LinkedIn.

  7. Rate ZoomCharts visuals at Microsoft Marketplace.

6. Attend the Live Closing Webinar

  • The ZoomCharts team reviews and analyzes the Top 5 challenge submissions during live webinar.

  • You will learn best practices, visualization tips, and new Power BI skills.

  • The winner of the best report receives a $300 Amazon gift card from ZoomCharts.

Technical requirements

  • Build your report using Power BI
  • The recommended number of pages in the report is up to 3 pages, including drill-through pages.
  • Canvas size is 16:9 (Default Power BI size) or Full HD size = w:1920 - h:1080 
  • The report should contain at least 2 ZoomCharts Drill Down visuals within a single page. See a practical guide for using Drill Down PRO visuals.

The Brief

Christmas Retail Sales and Marketing Analysis

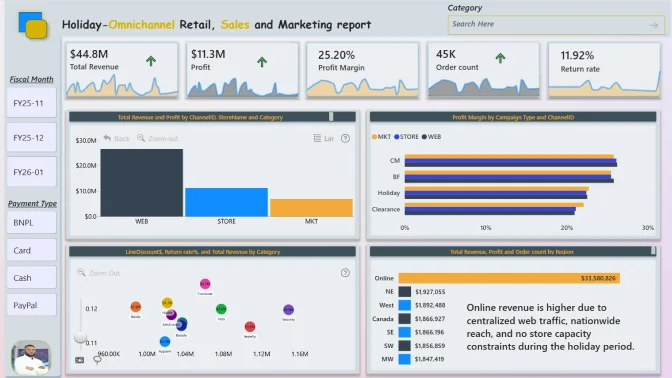
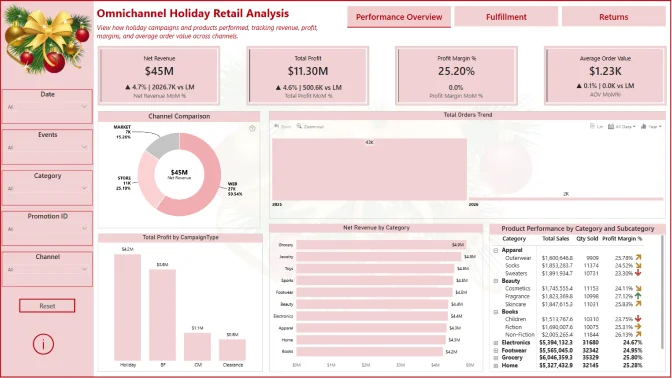
In this challenge, you will take on the role of a data analyst exploring a complete festive season retail dataset. The company operates sales across Web, Stores, and Marketplaces and runs a series of Christmas and holiday marketing campaigns from Black Friday through New Year. 

The dataset captures everything that happens during this period: promotions, customer orders, deliveries, inventory levels, and returns. Your mission is to uncover insights that help improve holiday campaign performance, customer experience, and operational efficiency.

Use Case and Main Goal

The holiday season is busy, competitive, and full of rapid decision making. This dataset gives you a chance to understand how different parts of the business worked during this peak time. By analyzing it, you will: 

  • Evaluate which holiday campaigns created the most profitable sales uplift. 
  • Explore delivery performance to see which carriers and shipping methods met their promised dates. 
  • Understand what caused returns and how they affected overall revenue. 
  • Support future planning by highlighting what worked well and what should be improved for next year.

Your Mission

Use Power BI and ZoomCharts visuals to:

  • Build data models connecting data tables.
  • Create performance metrics and KPIs.
  • Design a complete Power BI report.

Questions to Explore (Optional)

Here are some ideas to inspire your analysis. You can explore these or follow your own curiosity: 

  • Which holiday promotions performed best in terms of budget execution and overall profit, not just sales volume? 
  • What are the main reasons for returns. 
  • How much $ are we losing from disposed products (include all associated costs) 
  • Where did late deliveries peak during the season and which carriers have the highest delayed shipment rate 
  • Which warehouses have highest delivery delays 
  • Which products generate the highest profit margins in each category? 

✨ Note: These questions are only starting points. You are encouraged to explore the data in your own way and share any interesting or unexpected findings. Your insights can help highlight how search behavior, advertising, and website performance shape the customer experience during the holiday season.

Judging criteria

Business users use reports to make data-driven decisions. That’s why reports are called effective if they enable users to drill down and filter data quickly and intuitively to find answers to any question they might have, and analyse data in all possible directions and dimensions.

Each report is evaluated based on three main criteria: intuitiveness, insightfulness, and interactivity. These factors ensure that the reports are not only accurate and functional, but also meet the target audience's needs and are ready to be presented to the end-users. 


  1. Intuitive: How clear and easy it is to understand the report at a glance? (max 15 points)
    • Is the report visually appealing?
    • Choice of charts and visual elements
    • Does the report tell a story?
    • Is it not overwhelming to the user?
    • Choice of tooltips, titles, and legends

  2. Interactive: How engaging and seamless is the report exploration and interaction with data? (max 15 points)
    • Clear navigation that allows user to explore the report
    • Use of slicers and other interactive elements
    • Smooth cross-chart integration
    • Is report optimized for touch devices?
    • Are tutorials and guiding elements helpful to the user?

  3. Insightful: How accurate, complete, and meaningful is the data in driving decisions? (max 15 points)
    • Depth of analysis
    • Data cleaning and preparation
    • Does data show up accurately in the report?
    • Is report optimized for quicker loading time?
    • Does the report provide deeper exploration of data (drill-down)?

Timeline

Registration Open

Registration Open

10 December | 03:00

-

Submissions Open

Submissions Open

10 December | 03:00

-

Workshop | Designing Interactive Christmas Retail Reports with Power BI

Workshop | Designing Interactive Christmas Retail Reports with Power BI

16 December | 08:00

-

1:1 Mentoring Sessions

1:1 Mentoring Sessions

16 December | 08:00

10 December - 06 January

Entry Submission Deadline

Entry Submission Deadline

06 January | 16:59

10 December - 06 January

Webinar | Reviewing the Top 5 Power BI Reports for Christmas Retail and Marketing

Webinar | Reviewing the Top 5 Power BI Reports for Christmas Retail and Marketing

09 January | 08:00

10 December - 06 January

Winner Announced

Winner Announced

09 January | 08:00

10 December - 06 January

Dataset

Get the dataset

My license

1:1 mentoring sessions

You can book a personal session with Senior Product Expert at ZoomCharts, Aivis Pavlovs, to gain practical knowledge about Drill Down Visuals and how they can be used to enhance data storytelling in a report.

Book a meeting

Your Drill Down Visuals Developers License

Use the email and password provided below to log in Power BI Desktop and access an account with a license to use all ZoomCharts Drill Down Visuals.

Upon logging in, you will need to change your password and enable two-factor authentication. If you encounter any problems, feel free to reach out to us via chat. For more information click here.

*This Developer License can be used to create a report for this ZoomCharts Mini Challenge or for your personal training purposes. Commercial use of this license is prohibited.

Submit your report to the FP20 Analytics ZoomCharts Challenge!

Enter your submission by attaching the Power BI report file. Your report will be published on the web, and we will e-mail you a link to your report that you can share publicly.

Upload failed
Attach file
File requirements: 16MB
warning If you are experiencing trouble with uploading your report, please send it in .pbix format along with all required information to [email protected]


Any questions? Reach out to us at [email protected]!

Are you sure you want to delete the report?

Activate your Drill Down visuals Developer License!

You can use these credential to access ZoomCharts visuals and create your report for this ZoomCharts Mini Challenge, or for your personal training purposes.


Invalid email address

Unfortunately, we couldn't reach the email address linked to this profile "". If you wish to receive news, feedback, and the Publish to Web link for your contest submissions, you'll need to create a new ZoomCharts account with a valid email address, or log into an existing account.

Switch account
logo
[email protected]
+44 204 577 3993
logo

Products

Drill Down Network PRO Drill Down Waterfall PRO Drill Down Graph PRO Drill Down Combo PRO Drill Down Combo Bar PRO Drill Down Donut PRO Drill Down Pie PRO Drill Down TimeSeries PRO Drill Down Timeline PRO Drill Down Map PRO Drill Down Scatter PRO All Visuals

Resources

Report Examples Webinars Blog ZoomCharts Academy Visuals Gallery Documentation Custom Visual Development Subscribe to News

Solutions

Custom Visual Development

Company

Pricing About Us Partners Leave feedback Join PowerGroup EU Funding

Help

ZoomCharts Assistance Contact Sales Contact Support FAQ

Drill Down Network PRO Drill Down Waterfall PRO Drill Down Graph PRO Drill Down Combo PRO Drill Down Combo Bar PRO Drill Down Donut PRO Drill Down Pie PRO Drill Down TimeSeries PRO Drill Down Timeline PRO Drill Down Map PRO Drill Down Scatter PRO All Visuals

Report Examples Webinars Blog ZoomCharts Academy Visuals Gallery Documentation Custom Visual Development Subscribe to News

Custom Visual Development

Pricing About Us Partners Leave feedback Join PowerGroup EU Funding

ZoomCharts Assistance Contact Sales Contact Support FAQ
+44 204 577 3993
[email protected]

Ready to get in touch?

Contact our experts with any question about Power BI and ZoomCharts for Free!

Contact us

© 2025, Data Visualization Software Lab

U.S. Patents No. 11,645,343; 11,921,804; 12,346,389

Cookies
Privacy Policy
Global
Legal
Patent
warning

Error message

success

Success info: Done!

ZoomCharts AI Assistant

We noticed you're using an old OS version.

For the best experience, we recommend upgrading to ensure that all website features display correctly.

Cookie settings

We use necessary cookies for site functionality, as well as statistic, marketing, and preference cookies to enhance your experience. For more information and to manage your preferences, please visit our Cookie policy