Feel free to leave your vote:
25
Share template with others
Summary
This Power BI report is built using the Omnichannel Holiday Retail Sales dataset and features ZoomCharts Drill Down PRO custom visuals for Power BI. It was submitted to the FP20 Analytics ZoomCharts Data Challenge #33 (December 2025 – January 2026).
Author's Description:
What really made the holiday sales successful—the campaigns, the deliveries, or what happened after the sale? This report looks at retail performance during the holiday period (November–January), combining sales, marketing, fulfilment, and returns data to understand what drove results during the festive season.
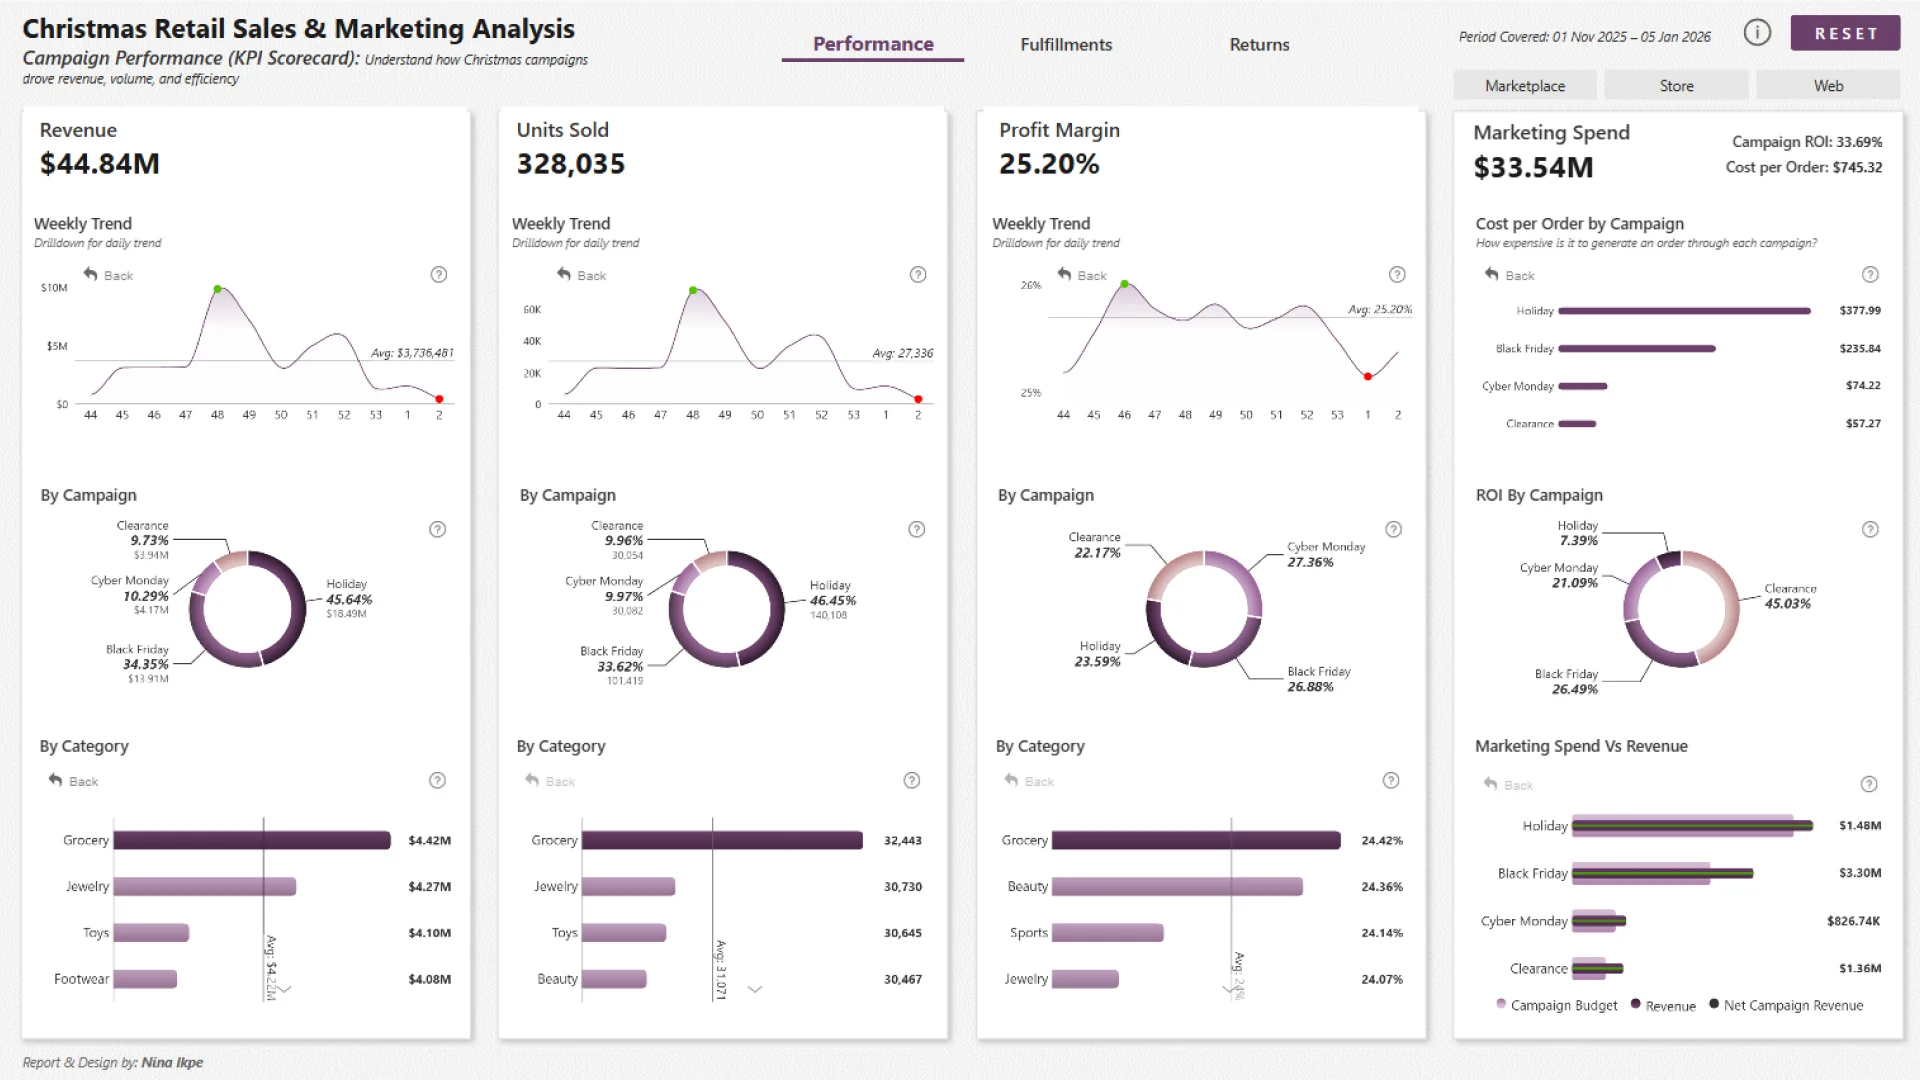
Page 1 – Sales & Campaign Performance provides a KPI snapshot of revenue, quantity sold, profit margin, and campaign ROI, highlighting which promotions and products performed best during the holidays.
Page 2 – Delivery & Fulfilment Performance focuses on on-time delivery, late shipments, delay severity, warehouse bottlenecks, and shipping method performance to uncover where fulfilment challenges occurred during peak demand.
Page 3 – Returns & Loss Analysis explores return rates, reasons for returns, product condition, and write-offs to show how returns impacted revenue and where improvements can be made.
Overall, the report is designed to help decision-makers understand what worked well during the holiday season, where value was lost, and what actions can improve campaign effectiveness, delivery performance, and profitability in future peak periods.
Mobile view allows you to interact with the report. To Download the template please switch to desktop view.