Feel free to leave your vote:
0
Share template with others
Summary
This Power BI report is built using the Omnichannel Holiday Retail Sales dataset and features ZoomCharts Drill Down PRO custom visuals for Power BI. It was submitted to the FP20 Analytics ZoomCharts Data Challenge #33 (December 2025 – January 2026).
Author's Description:
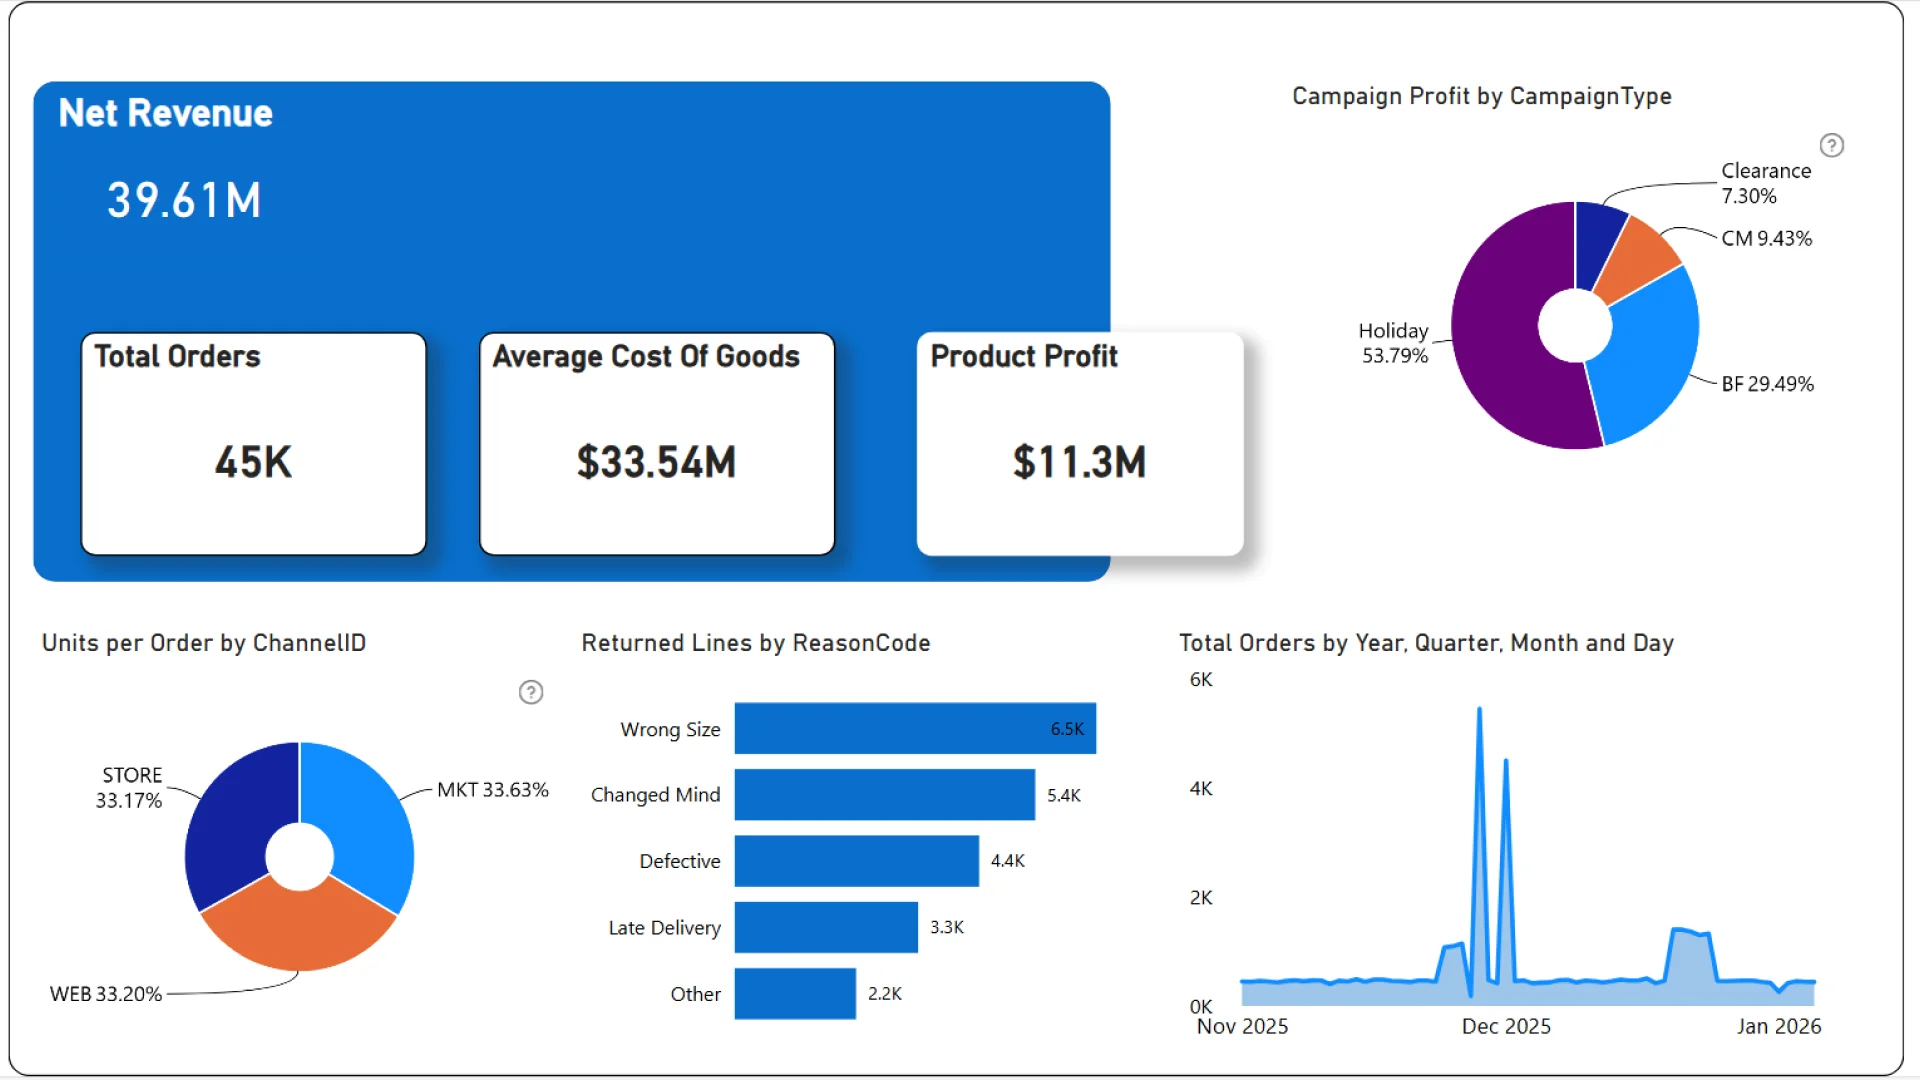
Holiday Performance & Operations Dashboard (Power BI). Developed an interactive Power BI dashboard to analyze e-commerce revenue, profitability, refunds, and delivery performance. The dashboard provides end-to-end visibility into sales trends, refund drivers, campaign profitability, and logistics efficiency, enabling stakeholders to identify revenue leakage, seasonal delivery risks, and underperforming campaigns for data-driven decision-making.
Mobile view allows you to interact with the report. To Download the template please switch to desktop view.