Sep 29, 2025
NEW: Free Developer License for ZoomCharts Power BI Visuals
ZoomCharts has just introduced Developer License, which provides free access to all our Power BI custom visuals – for an entire year. If you want to try out all ZoomCharts visuals, experiment with all their features, and see how they work in your Power BI reports, this license is made for you.

ZoomCharts has just introduced Developer License, which provides free access to all our Power BI custom visuals – for an entire year. If you want to try out all ZoomCharts visuals, experiment with all their features, and see how they work in your Power BI reports, this license is made for you.
What is the Developer License?
With the Developer License, you can use ZoomCharts visuals for free in Power BI Desktop and access all their paid features. It will be valid for one year after signing up. During this period, you can license our visuals for as many reports as you want.
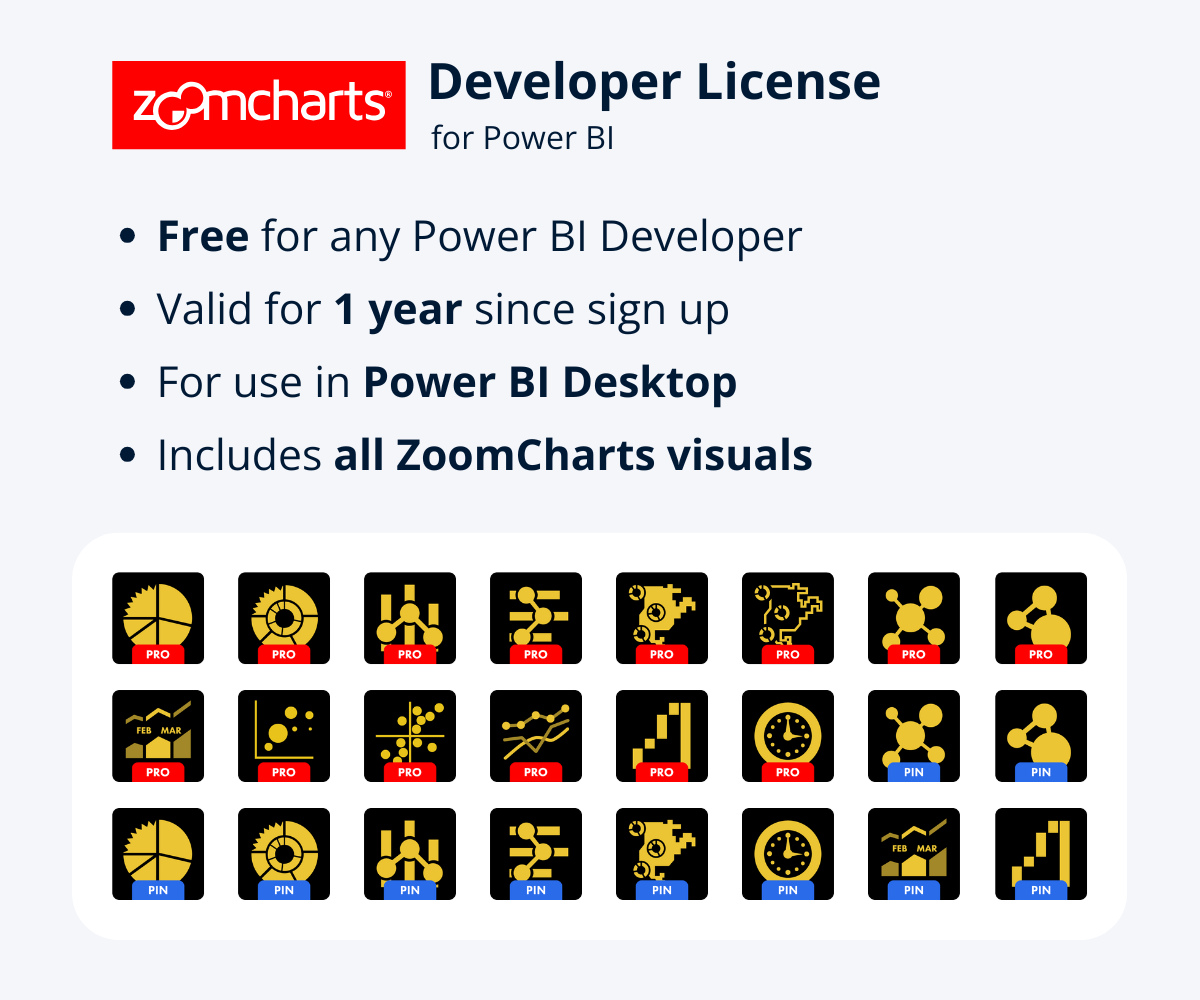
We made it for report developers who want to fully explore the capabilities of Power BI + ZoomCharts at their own pace. Experiment with every field, toggle and setting. Try out different combinations of our visuals to see how they interact together. Build beautiful and interactive reports for different use cases.
With the Developer License, you can use ZoomCharts visuals within Power BI Desktop – this means that you can try it in your designs and get familiar with them in your own development environment, but it is not intended for use with other Power BI tiers, or in reports that have been shared or published.
Once you are ready to publish and share your reports with your team, you can sign up for the 30-day trial (valid for all Power BI tiers). This way, you can fully experience the value provided by ZoomCharts visuals and make an informed decision before upgrading to a full license.
| Preview Mode | Developer License | Trial | |
|---|---|---|---|
| Duration | 12 hours | 365 days | 30 days |
| Activation | Activated automatically within Power BI | Sign up: Developer License | Start in your Account Dashboard |
| Supported PBI tiers | All | Power BI Desktop only | All |
| Publishing | ✅ Supported | ❌ Not Supported | ✅ Supported |
| Use case | Your first impression of ZoomCharts visuals after downloading them | Getting familiar with the full capabilities and trying them out in your environment | Testing ZoomCharts effect on team workflow while considering purchase |
How To Get ZoomCharts Developer License
You can get your free Developer License and start creating incredible Power BI reports with ZoomCharts visuals in just four simple steps. Whether you added your visuals from Power BI’s built-in store or downloaded them manually, the steps will remain the same.
Step 1: Sign Up for Developer License
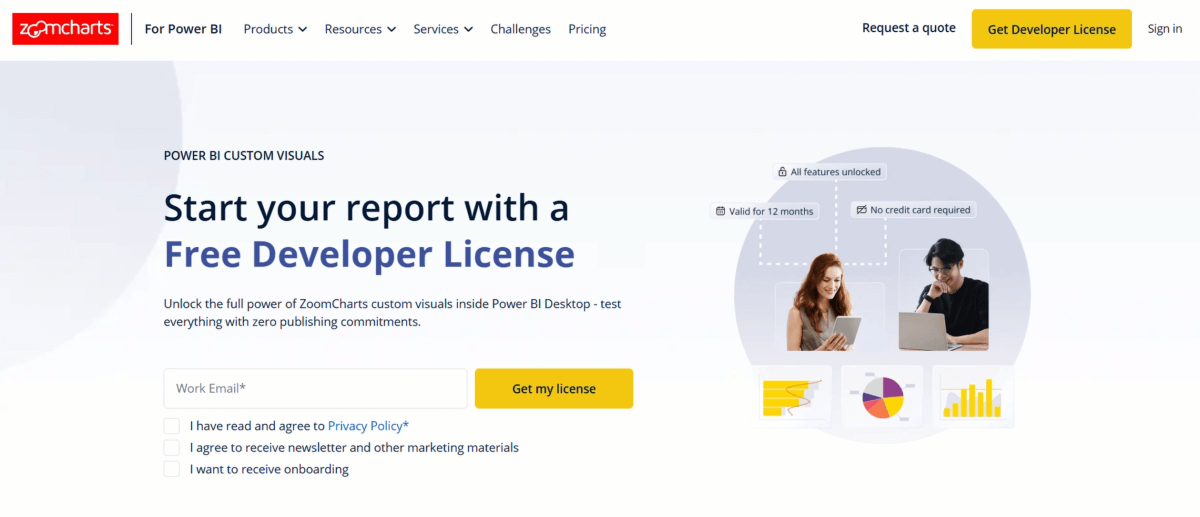
Head to the Developer License page on our website and sign up with your work email. If you didn’t already have an existing ZoomCharts account, signing up will create one. The Developer License will be added to your account, and you will be able to use it for 365 days, starting from the sign-up date.
We made this process as simple and straightforward as possible – you do not need to provide any payment details or other info to get your license; simply sign up using an email with an organization domain, and you’re good to go!
Step 2: Access Your License
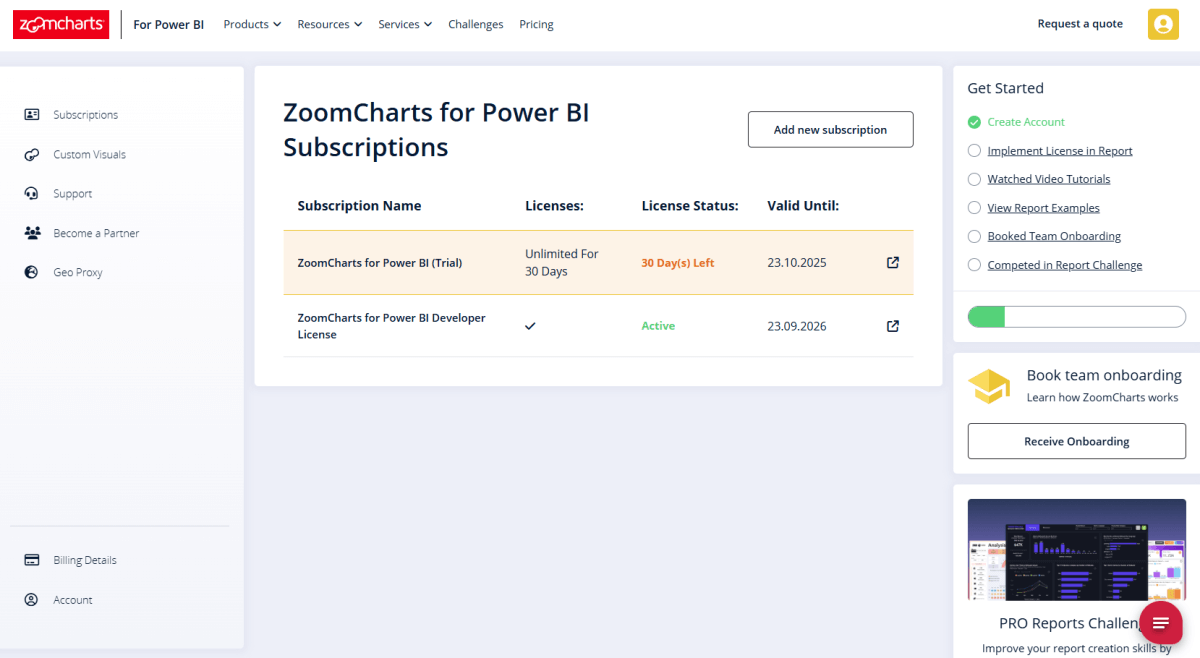
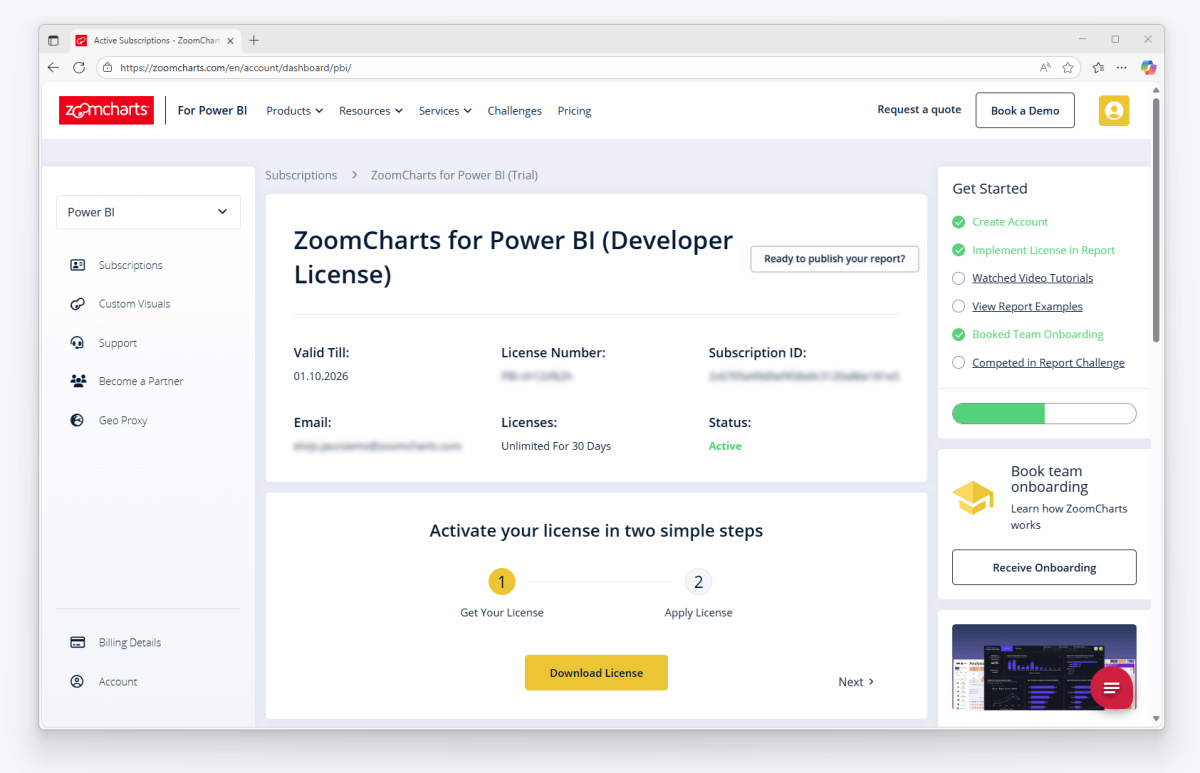 Once you’ve signed up and created a ZoomCharts account, your license will be available in your account dashboard. Here, you can see all the active licenses linked to your account, their status, and remaining time. Click on it to access your license details that you can use to validate ZoomCharts visuals in your reports.
Step 3: License Your Visuals
The process of getting the visuals is no different than before; you can download them from AppSource and add them to your report. What this process does is validate your Developer License so you can use the paid features for the entirety of the license period.
With our theme file, you can automatically validate all ZoomCharts visuals within the report so you don’t have to do it manually for each visual. Download the .json theme file that contains the license details (it does not contain any style properties).
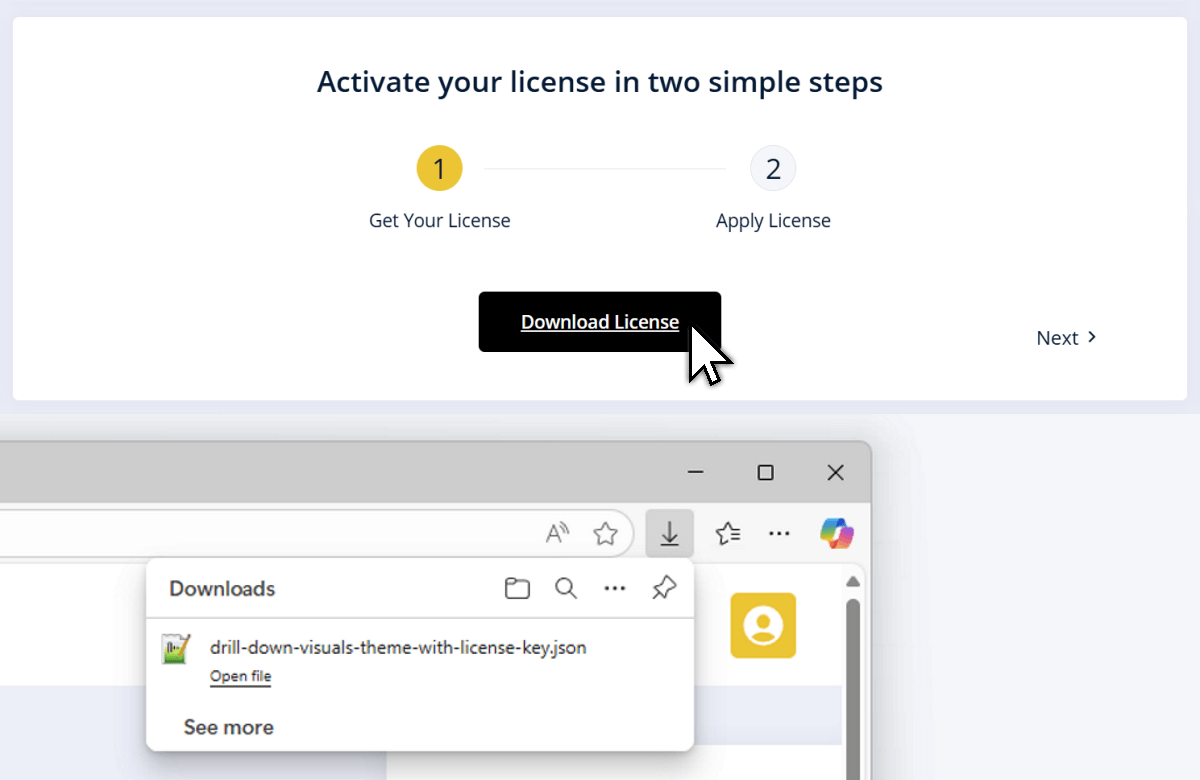
Apply the theme to your report (in PBI Desktop, it can be done under View tab of the top ribbon in Themes panel – click on “Browse for themes…” and locate the downloaded file).
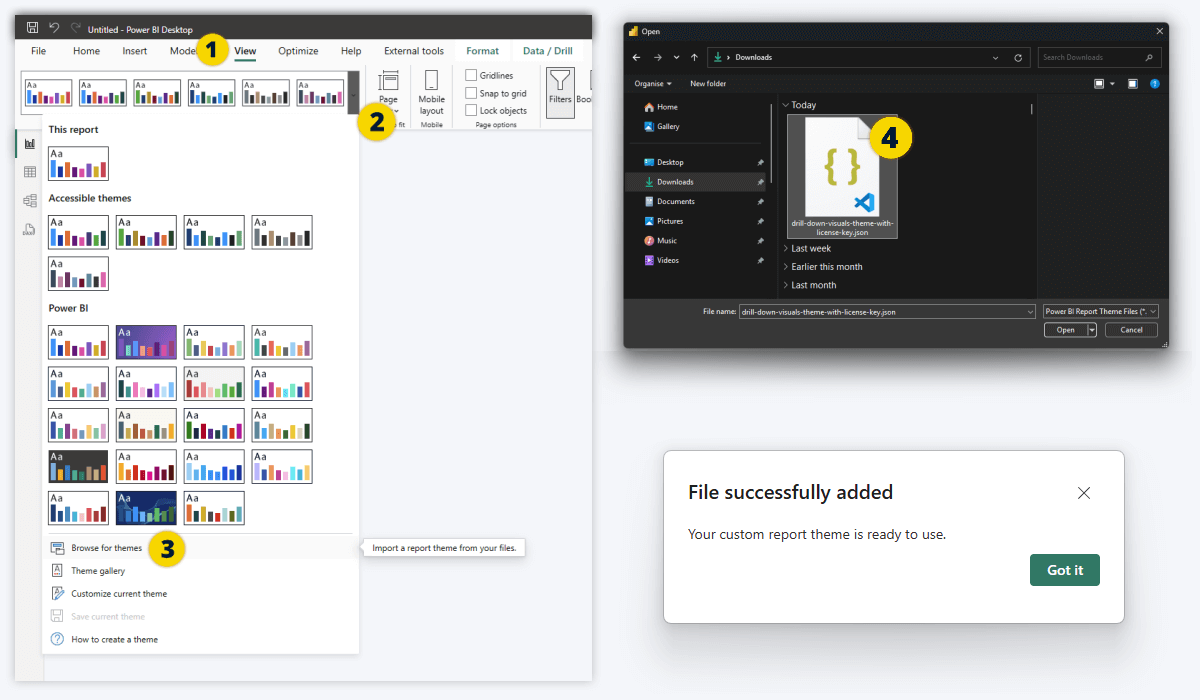
Doing so will apply your Developer License to all ZoomCharts visuals, and if done correctly, you should be able to use all paid features. Whenever you create a new report, simply repeat this process.
Step 4: Ready To Publish?
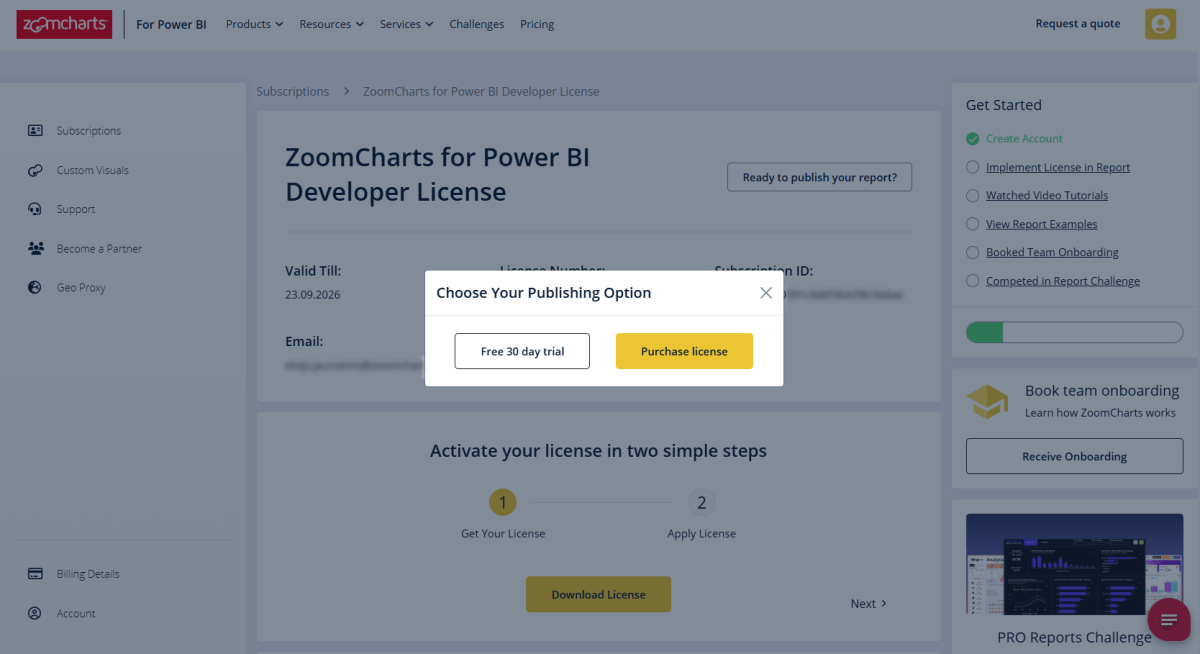
Congratulations – you have validated ZoomCharts visuals with your new Developer License! You can now enjoy all our visuals and all their features for an entire year, and create as many reports as you want.
The Developer License will allow you to design reports locally in Power BI Desktop. But if you want to share your reports with your colleagues or publish them in your workspace, a free 30-day trial license is also available. It will work with all Power BI capacities, not just Desktop – so they too can experience your reports and see the value of ZoomCharts visuals in action.
Don’t worry, activating the free 30-day trial will not remove your currently active Developer License. It will be a separate license in your ZoomCharts dashboard, so even after the 30-day trial period ends, you can keep on using your Developer License within Power BI Desktop.
Summary
Developer License gives you free access to all ZoomCharts visuals within Power BI Desktop. It is active for a year since sign up. It's a great way to get familiar with the visuals, explore all their settings, interactions, and features.
Useful Resources for ZoomCharts Visuals
With the Developer License, you now have access to 20+ visuals, each with powerful drill-down and filtering interactions, various optional data fields, and 150+ different customization options. Where to start? Here’s a collection of useful resources so you can explore the full power of our visuals and how to use them.
- Report Gallery: Library of free Power BI report templates created with ZoomCharts, each with live demo and a downloadable .pbix file.
- Documentation: Knowledge base that explains the setup process, fields and settings for each visual.
- Blog: Useful articles about ZoomCharts visuals, Power BI, and data visualization. Check out the Product updates section for latest features and changes, and Guides for deep-dive tutorials.
- Video Tutorials: Series of easy-to-follow video tutorials that explain the setup and configuration of each visual.
- Report Challenges: Test your report design skills against community members, or simply get inspiration for your next report and learn useful tips by following live webinars.

Want more info like this?
Subscribe to our newsletter and be the first to read our latest articles and expert data visualization tips!