logo
For Power BI
  • Products
    • Drill Down Donut Pro Drill Down Donut PRO
    • Drill Down Pie Pro Drill Down Pie PRO
    • Drill TimeSeries Pro Drill Down TimeSeries PRO
    • Drill Combo Pro Drill Down Combo PRO
    • Drill Map Pro Drill Down Map PRO
    • Drill Scatter Pro Drill Down Scatter PRO
    • Drill Down Network Pro Drill Down Network PRO
    • Drill Down Waterfall Pro Drill Down Waterfall PRO
    • Drill Down Graph Pro Drill Down Graph PRO
    • Drill Down Timeline Pro Drill Down Timeline PRO
    • Drill Down Combo Bar PRO Drill Down Combo Bar PRO

    Video tutorials

    Watch Now

    More than 90 videos on how to enhance Power BI with ZoomCharts

    Learn more
    All visuals
  • Resources

      Resources

    • Documentation
    • Report Examples
    • Blog
    • Webinars
    • Video Tutorials
    • Visuals Gallery

    Support

    • ZoomCharts Assistance
    • Contact Sales
    • Contact Support
    • FAQ

    Challenges

    Challenges

    Improve your report creation skills by participating in free challenges for report creators.

    Learn more
    Start trial
  • Services
    • Power BI Report Development
    • Custom Visual Development
  • Challenges
  • Pricing
Request a quote Start Free Book a Demo Sign in
Get it now
Go back

Contents

Go back

May 07, 2024

What’s New in Drill Down Visuals: May 2024

We have released updates to our TimeSeries, Map, Pie, Donut and Graph visuals that have added various useful features and quality-of-life improvements.
Title image
Title image

We have released updates to our TimeSeries, Map, Pie, Donut and Graph visuals that have added various useful features and quality-of-life improvements.

Contents

Share this article

Make sure that you have updated your visuals to the latest version! You can check your current version by pressing the “?” (Info) button at the top right corner of the visual, or by right-clicking the visual’s icon in the Visualizations pane and opening the About screen.

TimeSeries PRO: Now Supports Up To 25 Series

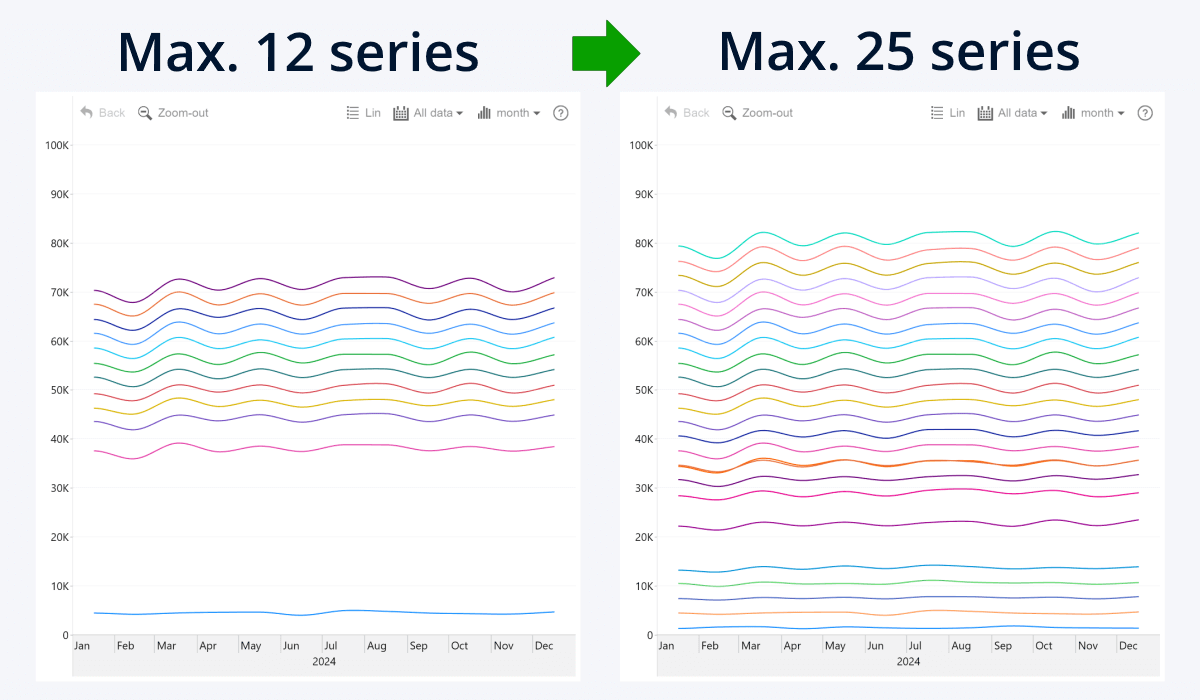
With the v1.11.7.0 update for Drill Down TimeSeries PRO, we have significantly increased the maximum number of series that you can display in the same visual, raising it from 12 to 25. You can now compare more data in the same visual and have more flexibility. This update brings TimeSeries PRO in line with our Combo, Combo Bar, and Timeline visuals.

The Build Visual tab of the Visualizations pane contains separate fields for each series (Series 1-25), and you can add a numeric column to each field to visualize it as a separate series. You can configure the appearance of each series separately in its own Series Configuration section of the Format Visual tab.
25 series in Drill Down TimeSeries

Map PRO: Hide Latitude and Longitude from Tooltips

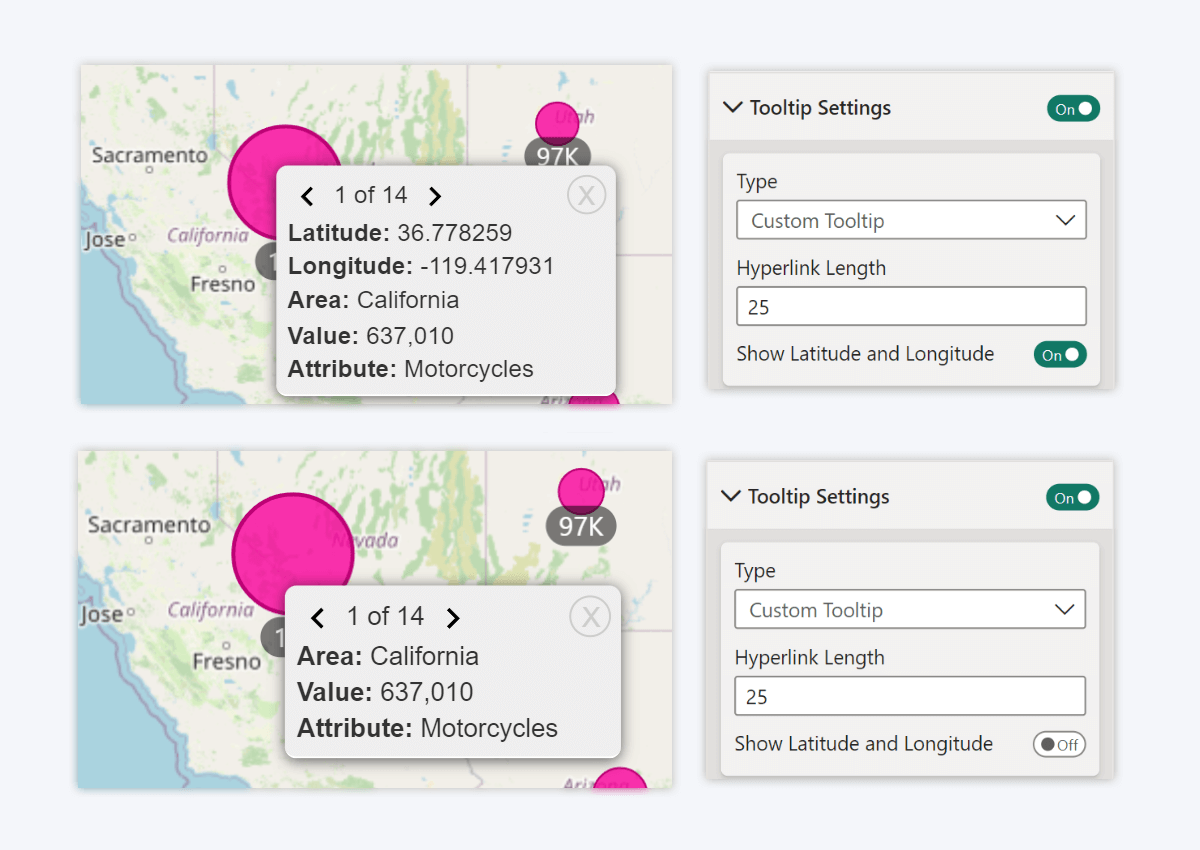
Tooltips in Drill Down Map PRO are a convenient way to display useful information related to each node. By default, tooltips will show the latitude and longitude values for each node, in addition to columns that you have added to Tooltip Fields. The v1.11.13.0 update for Drill Down Map PRO introduces an option to hide the Latitude and Longitude values from the tooltip.

Head to the Tooltip Settings section of the Format visual tab where you will find the “Show Latitude and Longitude” toggle. By disabling this toggle, you hide the node coordinates and show only Tooltip Fields content in the tooltip. This way, you can simplify your chart and remove data that’s irrelevant to the end user.
Drill Down Map PRO - Latitude and Longitude in Tooltip

Graph PRO: Separate Tooltip Fields for Source and Target Nodes

As of v1.11.13.0 version of Drill Down Graph PRO, the Tooltip Content field is now replaced by two different fields – Source Tooltip Field and Target Tooltip Field.

Previously, the tooltip content was always applied to the source node. Now, you can choose if the tooltip content is applied to the source node or target node of the data point. You can also use both fields at the same time.  

Note: If you are using both fields, and a data point is a source and target node at the same time, then Source Tooltip Field will take priority over Target Tooltip Field.
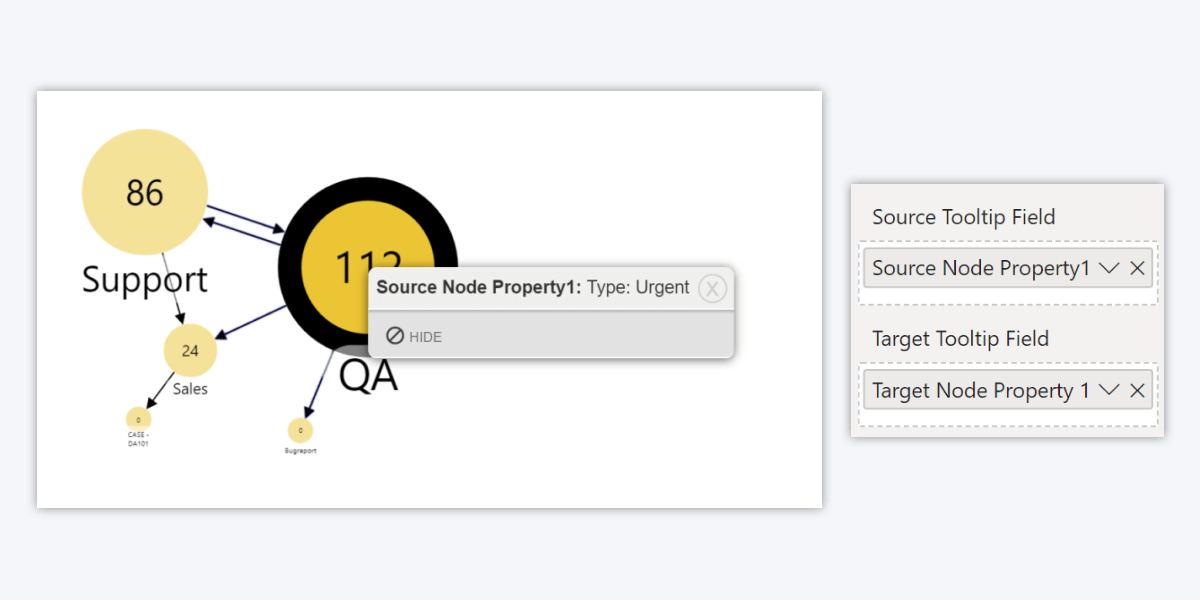
Drill Down Graph Pro - Source and Target tooltip field

Donut PRO & Pie PRO: Location of the Toolbar

Drill Down Donut PRO v1.11.15.0 and Drill Down Pie PRO v1.11.13.0 introduces a new setting – “Location of the toolbar”. It can be found in the Toolbar section of the Format visual tab and with this setting, you can choose how the toolbar is displayed within the visual’s viewport in relation to the chart.

If you select Inside, the toolbar buttons will overlay the chart, and the chart will use all available space within the viewport. Choosing Outside will create a “safe zone” for the toolbar to ensure that it never overlaps with the chart or other elements, and the chart will be resized to accommodate the toolbar.
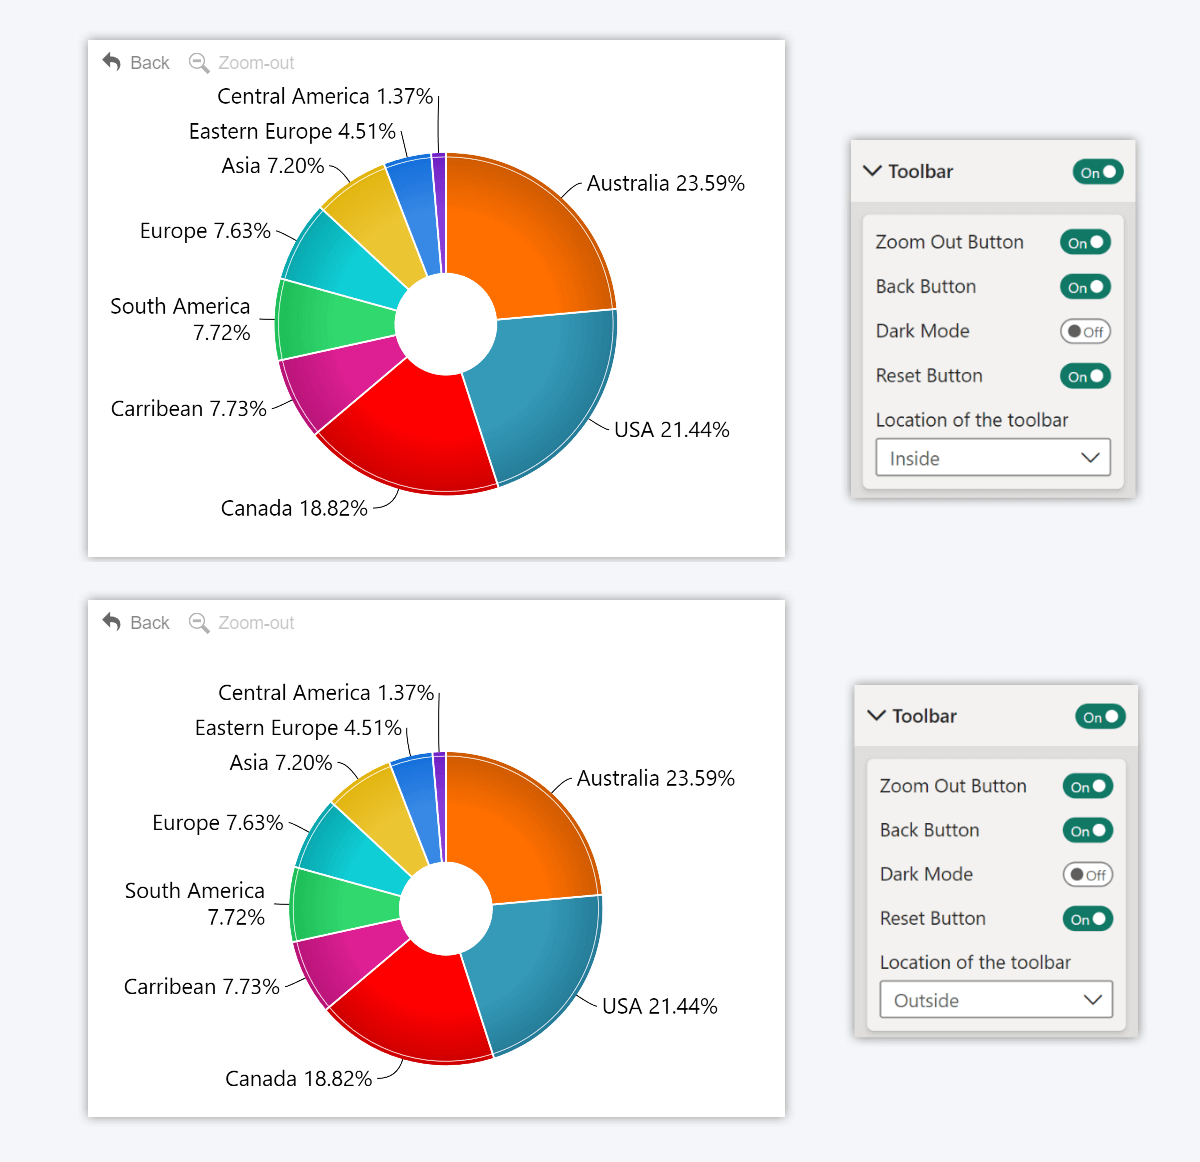
Donut and Pie PRO - Location of the toolbar setting

Donut PRO & Pie PRO: Detail Label Placement Mode

The same update also introduces an additional way to customize the detail labels. If your selected detail label placement is Outside, you will now see an additional setting called “Placement Mode”. It affects how the visual determines the location of each label.

The default setting, Align, will align all labels in two vertical columns, just like before. What’s new is the Wrap option, which will spread out the detail labels around the entire chart so that they are closer to their respective slices. This way, you can use the visual’s space more efficiently.
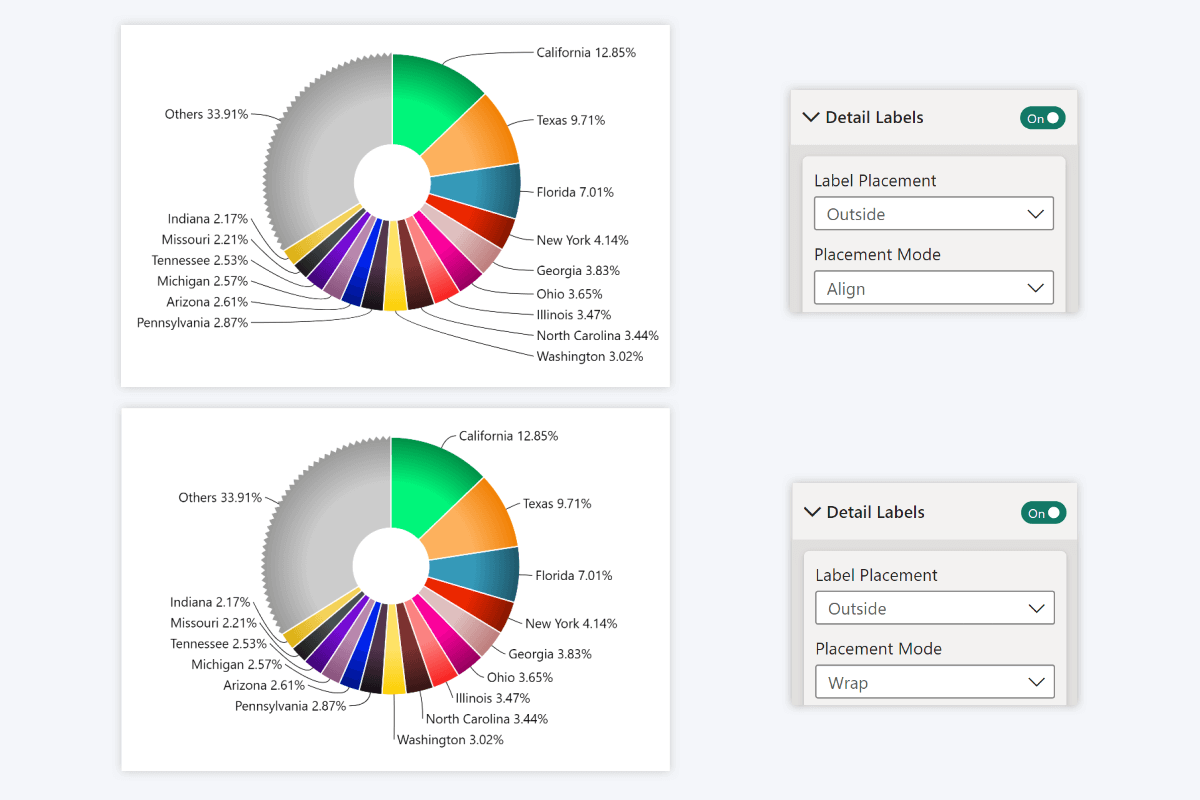
Drill Down Donut and Pie - Placement Mode for Outside Labels

All Visuals: High Resolution Toolbar Icons

Lastly, we want to mention a little quality-of-life improvement that has been added to all our visuals. The toolbar icons have been upgraded from PNG raster images to SVG vectors, which means that they will remain sharp and crystal-clear at any scale.
Get Started with Drill Down Visuals

Be sure to download the latest version of Drill Down Visuals to enjoy these new additions, along with hundreds of other features! With a free trial available, you can see for yourself how these powerful visuals can take your Power BI reports to the next level.

  • Get Drill Down TimeSeries PRO
  • Get Drill Down Map PRO
  • Get Drill Down Graph PRO
  • Get Drill Down Donut PRO
  • Get Drill Down Pie PRO
envelope icon

Want more info like this?

Subscribe to our newsletter and be the first to read our latest articles and expert data visualization tips!

Find out more

May 08, 2025

Blog Thumbnail
Guides

Data Literacy: What It Is and Why Every Modern Professional Needs It

Data literacy is no longer optional - it’s essential for success in today’s data-driven world. From marketers to HR professionals, everyone is expected to analyze data, spot trends, and make smart decisions. This article explores what data literacy really means, why it matters, and how to build it across your team and organization.

Apr 30, 2025

Blog Thumbnail
Product updates

April 2025 Update: Multiple Links in Graph PRO & Total Labels for Stacks

Create multiple links between nodes in Graph, enable and customize value labels for stack totals in Combo & Timeline, and more – read about what’s new in ZoomCharts visuals in April!

Mar 28, 2025

Blog Thumbnail
Product updates

March 2025 Update: Show Difference Between Two Values

This month brings multiple new features for better data visualization: change indicator for comparison between two values; on-chart annotations for Waterfall; layout modes for Network, and other improvements. 

Feb 26, 2025

Blog Thumbnail
Product updates

February 2025: What’s New in ZoomCharts Visuals for Power BI

You can now enable extended axis labels in Combo, Combo Bar and Waterfall, assign lasso shapes to specific shape layers in Map, and enter custom display names for link categories in Graph. Read more about the latest update in this article!

Jan 31, 2025

Blog Thumbnail
Guides

Top 12 Key SaaS Business Metrics You Must Track in 2025

ARR, CLV, NRR, churn, and more – learn about the most important SaaS business metrics, their formulas, how to read and interpret them, and how to best visualize them. 

Jan 15, 2025

Blog Thumbnail
Product updates

January 2025: New Customization Options

We have added outline conditional formatting, color customization for selection and highlight areas, comma-separated source nodes for Graph, and a setting to hide empty values in the tooltip.
  • 1
  • 2
  • 3
  • 4
  • 5
  • ...
  • 11
  • »

Contents

Share this article

Want more info like this?

Subscribe to our newsletter and be the first to read our latest articles and expert data visualization tips!

Thank you!

Check your inbox to verify your email address.

logo
[email protected]
+44 204 577 3993
logo

Products

Drill Down Network PRO Drill Down Waterfall PRO Drill Down Graph PRO Drill Down Combo PRO Drill Down Combo Bar PRO Drill Down Donut PRO Drill Down Pie PRO Drill Down TimeSeries PRO Drill Down Timeline PRO Drill Down Map PRO Drill Down Scatter PRO All Visuals

Resources

Report Examples Webinars Blog ZoomCharts Academy Visuals Gallery Documentation Custom Visual Development Subscribe to News

Solutions

Custom Visual Development

Company

Pricing About Us Partners Leave feedback Join PowerGroup EU Funding

Help

ZoomCharts Assistance Contact Sales Contact Support FAQ

Drill Down Network PRO Drill Down Waterfall PRO Drill Down Graph PRO Drill Down Combo PRO Drill Down Combo Bar PRO Drill Down Donut PRO Drill Down Pie PRO Drill Down TimeSeries PRO Drill Down Timeline PRO Drill Down Map PRO Drill Down Scatter PRO All Visuals

Report Examples Webinars Blog ZoomCharts Academy Visuals Gallery Documentation Custom Visual Development Subscribe to News

Custom Visual Development

Pricing About Us Partners Leave feedback Join PowerGroup EU Funding

ZoomCharts Assistance Contact Sales Contact Support FAQ
+44 204 577 3993
[email protected]

Ready to get in touch?

Contact our experts with any question about Power BI and ZoomCharts for Free!

Contact us

© 2025, Data Visualization Software Lab

U.S. Patents No. 11,645,343; 11,921,804

Cookies Policy
Manage cookies
Privacy Policy
Global
EULA
Patent
warning

Error message

success

Success info: Done!

ZoomCharts AI Assistant

We noticed you're using an old OS version.

For the best experience, we recommend upgrading to ensure that all website features display correctly.

Cookie settings

We use necessary cookies for site functionality, as well as statistic, marketing, and preference cookies to enhance your experience. For more information and to manage your preferences, please visit our Cookie policy