May 08, 2025
Data Literacy: What It Is and Why Every Modern Professional Needs It
Data literacy is no longer optional - it’s essential for success in today’s data-driven world. From marketers to HR professionals, everyone is expected to analyze data, spot trends, and make smart decisions. This article explores what data literacy really means, why it matters, and how to build it across your team and organization.

Data literacy is no longer optional - it’s essential for success in today’s data-driven world. From marketers to HR professionals, everyone is expected to analyze data, spot trends, and make smart decisions. This article explores what data literacy really means, why it matters, and how to build it across your team and organization.
What is Data Literacy?
Simply put, data literacy is the ability to correctly analyze and interpret data. It involves the following skills:
- Knowing how and where to find the necessary data for the task.
- Accurately interpreting different visualization types, exploring dashboards and reports.
- Recognizing patterns, trends, and correlations.
- Correctly extrapolating insights, using data to make informed decisions.
Here’s an example of data literacy in action: a digital marketing manager is reviewing campaign performance and notices an exceptionally high conversion rate in a specific customer segment. Then, they analyze what worked for that segment, and use it as a template to tailor the messaging for other segments. They quickly gained actionable insights on their own.
How To Measure Data Literacy
Data literacy is not just one skill that can be measured in binary terms – it’s a collection of skills. This concept involves not just practical skills, like knowing how to use data analysis tools, but also intangible factors like a person’s confidence in their ability to interpret data and understand whether the insights are accurate or misleading.
That’s why, in addition to skill-based assessments such exams or real-world tasks (i.e. creating a report from sample data), data literacy is often gauged using surveys and questionnaires. They are helpful to understand the person’s current proficiency and confidence with data, and identify areas of improvement. Some examples of self-assessment quizzes include:
- The Data Literacy Project: How Data Literate Are You? A brief quiz that will assign you one of four Data Personas: Avoider, Newcomer, Apprentice, Guru, and lists courses for further learning based on your result.
- BC Public Service: Data Literacy Self-Assessment Tool: A comprehensive questionnaire to assess your data literacy. Developed by the government of British Colombia, Canada, this example shows what a data literacy assessment effort would look like within an organization.
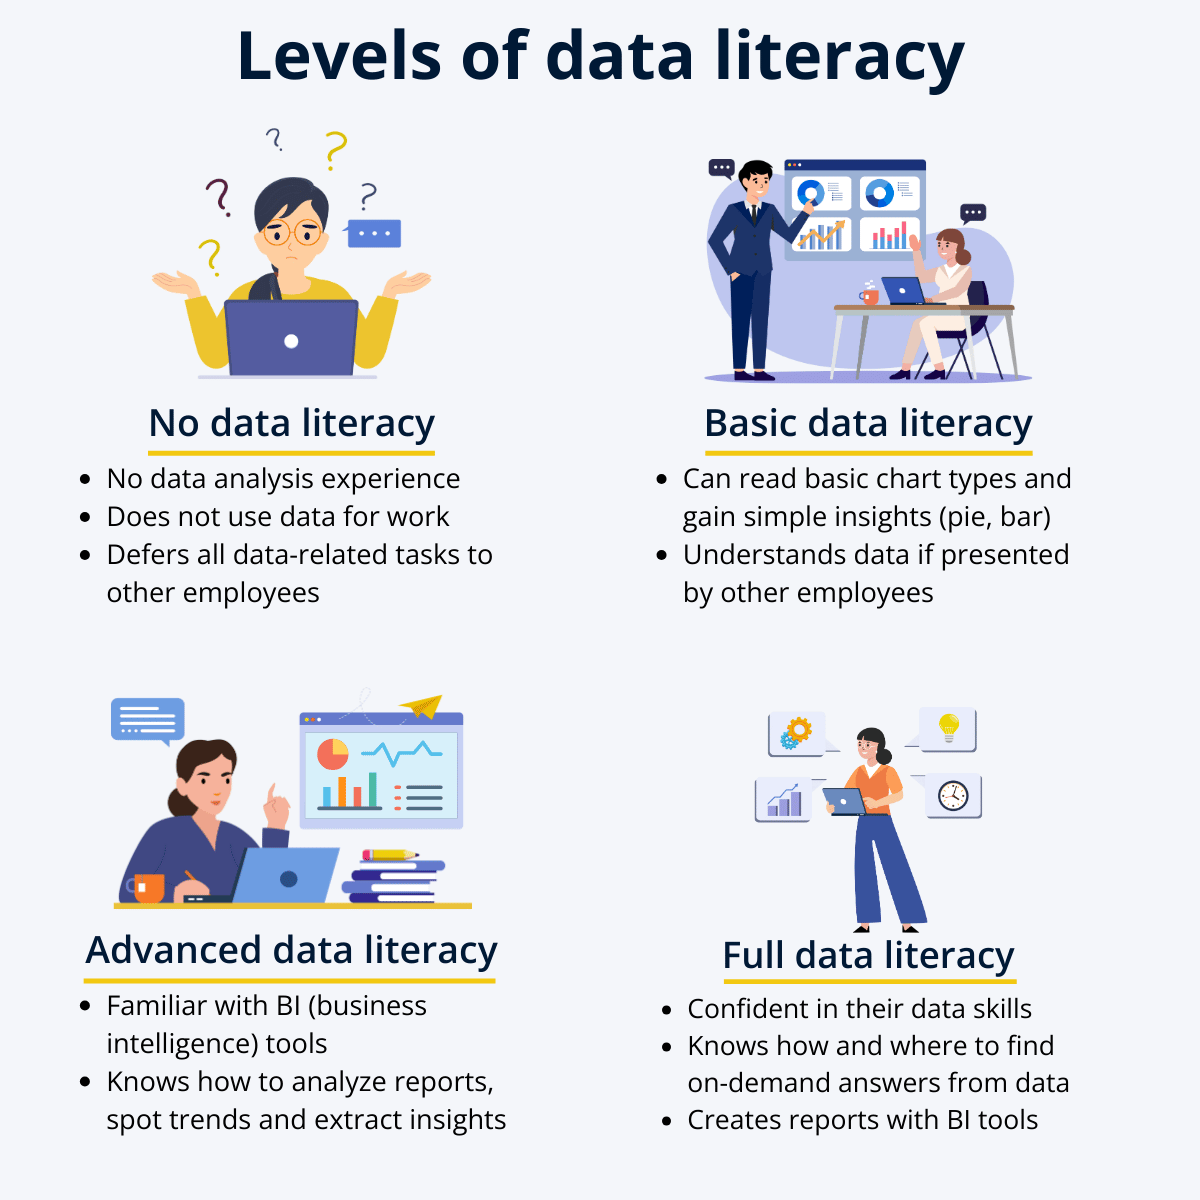
We created an infographic that explains levels for data literacy – none at all, basic, advanced, and full data literacy. With each tier, the employee becomes more confident in their ability to seek out answers for themselves using data, instead of relying just on insights produced by others.
Why is Data Literacy Important?
In our article Data-Driven Decision-Making: Full Guide, we discussed the importance of data-driven decision-making and how it is crucial to stay competitive. It results in faster and more efficient operations, helps avoid biased or erroneous decisions, and allows to identify new opportunities.
However, becoming a truly data-driven organization means involving more and more employees in the data analysis process. That’s why data literacy is incredibly important in the in the modern business landscape – for companies, it results in a stronger data culture, and for employees, it provides a significant boost to their career growth.
86% of leaders believe data literacy is important for their teams’ day-to-day tasks.
There are multiple tangible benefits that a stronger data literacy can provide – both on an individual level and across the entire company.
1. Better Decision-Making
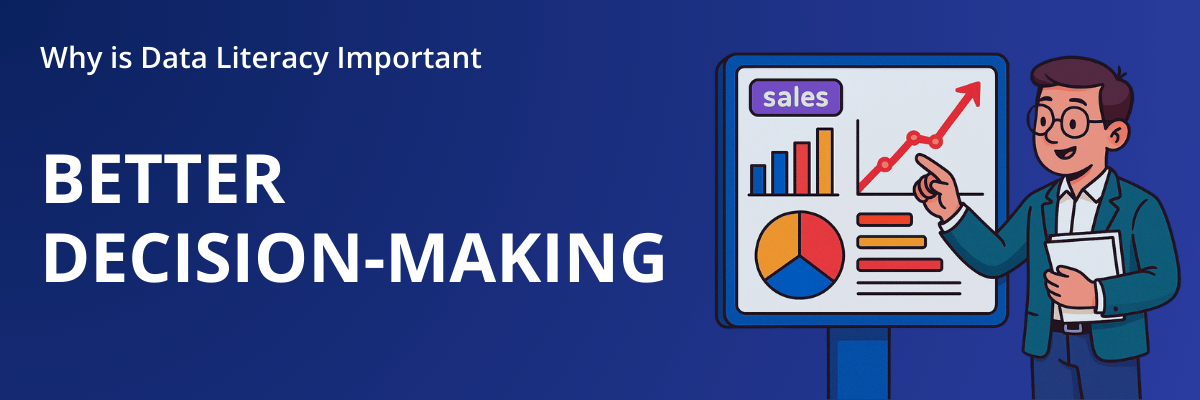
A data-literate employee will benefit more from BI tools and use data every day to make accurate, fully informed decisions. They will be able to better understand the data and take away actionable insights more easily. Furthermore, data literacy is crucial for spotting trends and correlations, allowing them to see the entire picture and how one factor affects another.
A data-literate employee knows how to spot errors and how to avoid misinterpreting data; and they can be confident that their conclusions are accurate and reliable. This will, in turn, allow them to make better decisions that combine the employee’s know-how in their respective field with the pure objectivity of data.
Every aspect of a modern business produces data, be it retail, production, finances, marketing, or HR. This means that data literacy is an incredible addition to any specialist’s arsenal of skills, because it will allow them to directly analyze data related to their tasks on their own and use these insights for their day-to-day business decisions.
It’s hard to imagine a single position that wouldn’t benefit from data literacy skills - whether you’re a sales manager analyzing the conversion rate, an accountant making a finance report, a marketing manager performing keyword research for their digital content, or a retail manager who’s doing stockkeeping.
2. Faster & More Efficient Operations
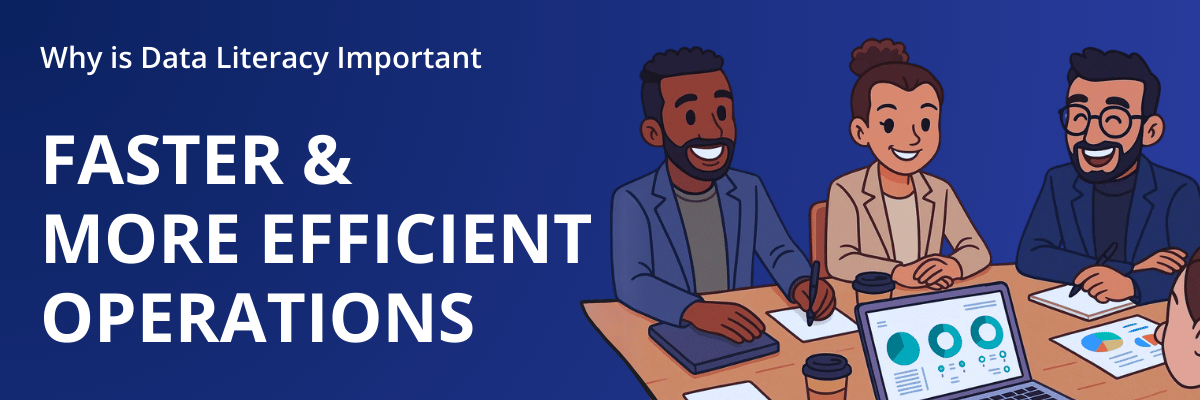
Modern businesses are all about speed and agility; always looking for ways to spend their time and resources more efficiently and react more swiftly to various internal and external factors. So, how can data literacy contribute to that goal?
1) A data literate employee will spend less time gathering and analyzing data to gain the necessary information. When there’s a business question that needs an answer, they will immediately know where to look for it and how to find it. Any time that’s not spent frantically searching for data and trying to understand it is time they can use to do more productive tasks – and that will not only improve the employee’s efficiency but also save company resources.
2) If an employee has the necessary data skills to access, analyze, and interpret data on their own, they will not require help from their colleagues to perform data-related tasks. This will save time for all employees involved and minimize downtime. Whenever there’s a question that needs a data-driven answer, they can quickly seek on-demand insights themselves, instead of writing an email to the company’s “data guy” and hoping that they are free to assist them.
3) As any corporate employee can attest, business meetings have a tendency to derail into intense debates where personal opinions clash. However, when an idea or viewpoint is backed by data, it leaves less room for subjective opinion or bias. This way, less time will be spent trying to justify each idea to other stakeholders, allowing for a more productive and efficient decision-making process.
3. Improved Collaboration
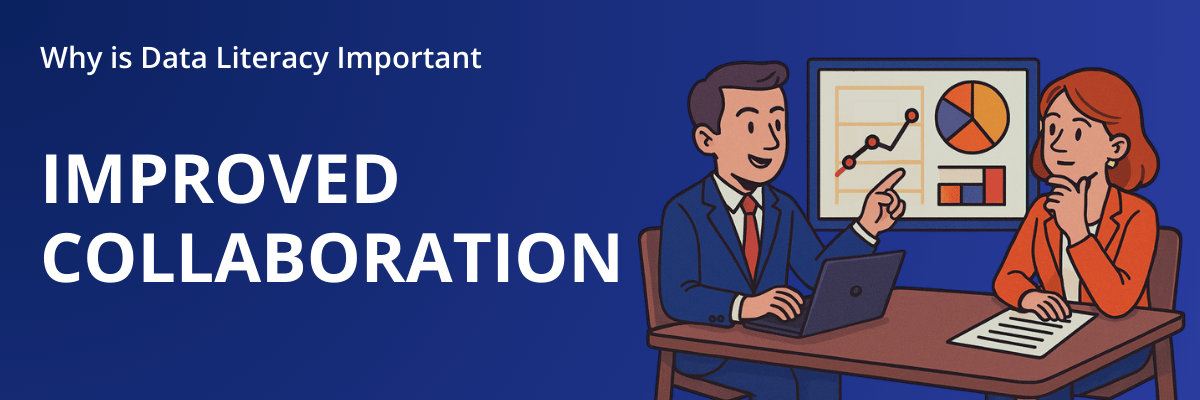
A strong data culture is the ultimate goal for any data-driven business, and achieving that requires good data literacy across the entire company. As more and more employees improve their data analysis skills and use data every day, the business will get more value from their investment in business intelligence infrastructure.
In addition to increased use of BI tools and a tighter integration of data analysis into the decision-making process, a high level of data literacy across the company will ensure better communication between employees, teams, and departments.
Here’s an example: Two employees work on the same project; Employee A is experienced with data analysis, but Employee B other is not. In this scenario, all data-related tasks will have to be done by Employee A, and, whenever Employee B has a question that needs to be answered with data, they will have to ask for A’s help instead of finding the necessary insights themselves.
However, if both employees are data-literate, they can easily access the relevant data and quickly find the necessary insights whenever needed. They use data to plan their next steps and make decisions. In 1:1 meetings, they discuss insights and actions, instead of explaining the data itself and how to read it. And, if they must report their findings to Employee C, they can confidently explain the relevant insights and put them in context.
How to Improve Data Literacy
Improving data literacy across the organization isn’t just about offering a few online courses or encouraging employees to “look at the numbers.” It’s about creating a culture where data becomes a shared language - understood, valued, and actively used in everyday work. That starts with strong leadership, continues with structured learning, and succeeds when data becomes easy to access and apply. Here’s how you can make that happen.
1. Lead By Example
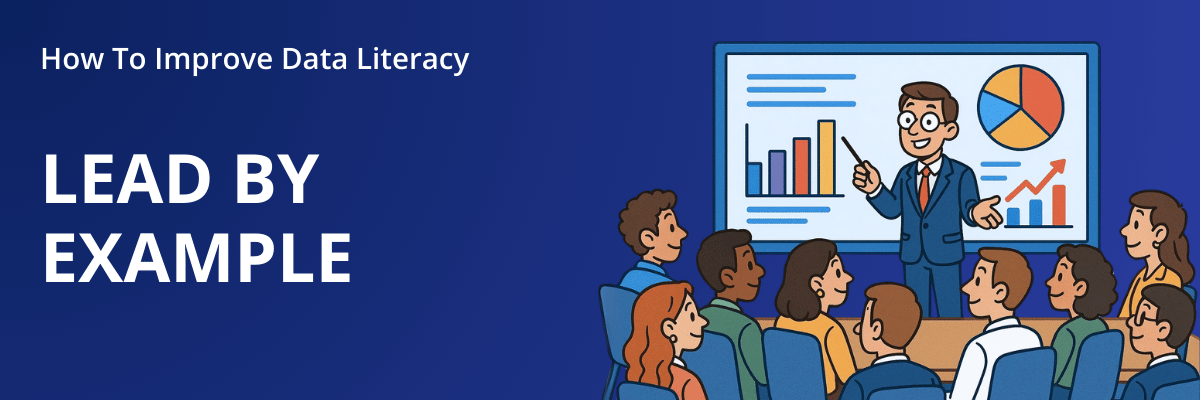
Data literacy, like any other skill, requires time and effort to learn. And why should an employee spend time learning about this “data thing”, if they have survived long enough without these skills and nobody in the company asks for them, right? You need to provide motivation for employees to engage with data and actively improve their data literacy.
There are various methods to do that, like organizing company-wide activities or providing incentives, but one of the simplest and most effective methods is simply leading by example.
If you start actively improving your data literacy skills, analyzing and presenting data to others, and making data-driven decisions, it will quickly motivate coworkers to start doing that as well – especially if you are a team lead or department manager. This way, you will demonstrate the value of having these skills, show how it improves the processes and decision-making, and inspire others to learn more about data.
Of course, there’s a bit of peer pressure involved as well – nobody wants to feel left behind, so if more and more people improve their data literacy, then it will start to feel like a crucial skill that needs to be learned to keep up with other coworkers.
2. Training & Onboarding
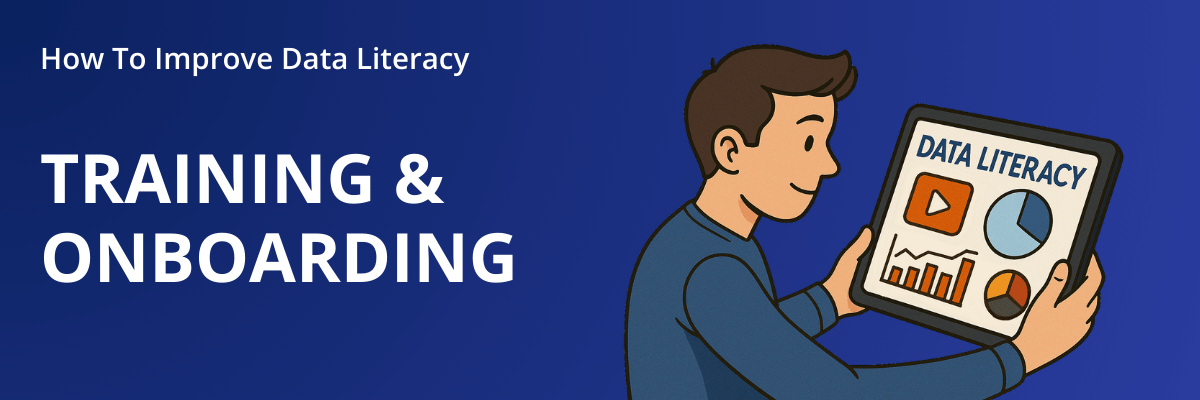
There are a vast number of courses, knowledge bases, tutorials and other resources available, both free and paid. For example, here’s an article where we compiled 27 best training resources for Power BI. And that’s just for one BI platform – there are so many resources on data literacy itself, various parts of the data analysis process, or training guides for using specific tools.
However, simply telling the employees to “Google it and learn data literacy” will not be enough. The employees must feel that the necessary resources are easily accessible, that they are focused and relevant to their work, and they provide the necessary skills. In addition, everyone should be on the same page as their peers.
That’s why the best approach is developing a data literacy framework – a structured plan that outlines the goals the organization wants to achieve, and lists the necessary skills they want to provide for their employees. Identifying these steps can then be used to plan the necessary activities and disseminate the required learning materials to employees.
Here’s an example of a data literacy framework by DALI, an European Union project to improve the data literacy of citizens. It outlines the goals of the framework, explains in detail what skills will be gained and how they can be used in real life, and how to assess the learning progress.
Another great example of a data literacy framework can be found in DataCamp’s State of Data Literacy 2025 report, which includes a downloadable slideshow that you can use a template for your own organization.
The main factor that decides how successful the data literacy efforts will be is employee engagement. If they are motivated to seek out new knowledge, gain new skills and put them in practice, the organization as a whole will quickly feel a profound effect. To do that, the necessary resources should be easily accessible, and the employees themselves should feel that the skills are worth the time investment.
3. Make Data Accessible and User-Friendly
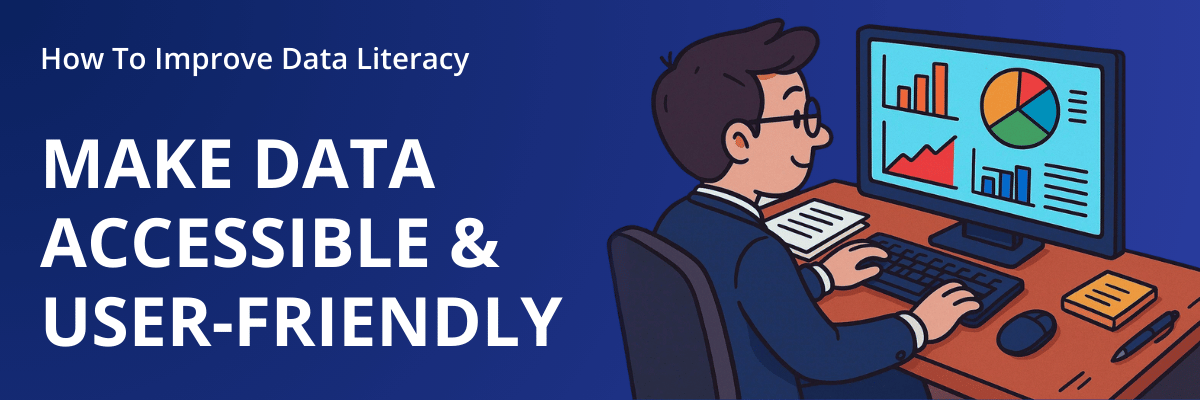
You’ve developed and implemented a data literacy framework. Employees have acquired the necessary skills and are ready to start analyzing data in their work. What’s next? How to apply data literacy skills in practice?
By actively getting involved in data analysis and reporting themselves. In addition to the necessary learning resources, another thing that the organization needs to make easily accessible and ready to use is data itself and tools to analyze it.
Self-Service BI Platform
The majority of data-driven organizations of today use business intelligence (BI) tools that integrate multiple data sources in one place and allow visualizing them as dashboards or reports. Some examples of BI platforms include Tableau, Qlik, Looker Studio and others, but the market leader is Power BI by Microsoft (read more in our article Top 9 Benefits of Power BI).
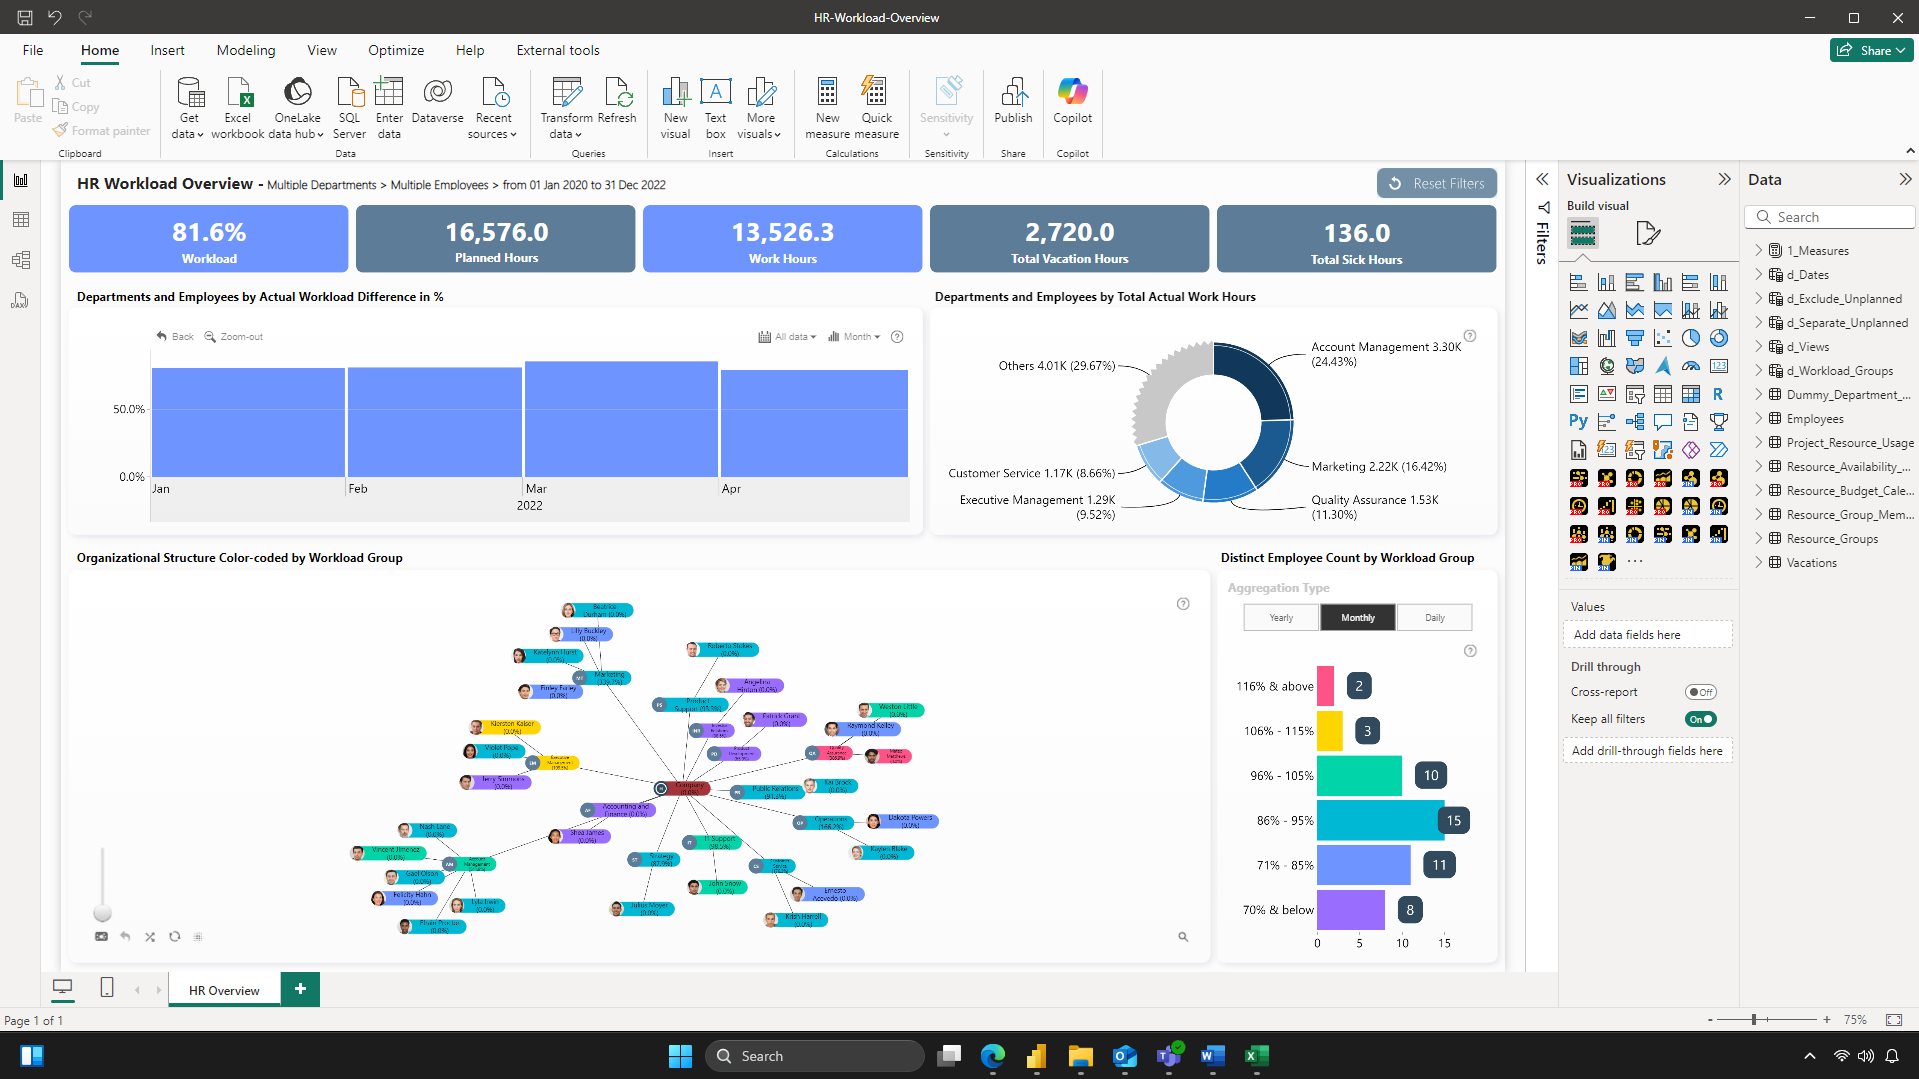
One of the biggest ways they have transformed the data analysis process and made it more involved for more employees is via self-service reporting. Beyond simply exploring ready-made reports, employees can also easily create and share their own interactive reports to quickly analyze data relevant to them and find data-driven answers to their questions.
Here’s an example: let’s imagine a marketing manager who wants to quickly explore the results of an A/B test for an email campaign. They can quickly connect data from the email platform and the customer management platform, visualize it in a report and see which email variation resulted in better open rate, button clicks and actual sales. They can also gain even deeper insights by filtering data by country, time or other dimensions.
With a solid data literacy foundation, an onboarding with the BI platform of choice, and easy access to the necessary tools, our imaginary marketing manager turned into a data analyst who can seek data-driven answers on their own, present insights to others, and make confident decisions backed by data.
Data Visualization
In addition to the platform itself, another crucial factor in making data more accessible and engaging to employees is data visualization. As we discussed in our article 5 Reasons Why Data Visualization is Important in Business, visualization plays an important role in ensuring that users understand the data correctly and derive accurate insights. In addition, it makes data analysis more user-friendly, resulting in a higher adoption of BI tools among the employees.
Our Drill Down Visuals for Power BI are specifically designed to make data exploration more intuitive and insightful for any user, allowing them to quickly find accurate and easy-to-read insights with just a few clicks. They are highly customizable so you can create visually appealing reports that follow your branding guidelines and adapt them for various use cases. They are intuitive to navigate, with easy-to-learn and touch-friendly user interactions.
And, best of all, they seamlessly integrate with other visuals to make interactive reports that dynamically filter data and display relevant insights from multiple dimensions as you explore the report. Head to the Report Gallery and try out live demos or download template files for many different report examples that show our visuals in action, including finance, sales, HR and other use cases!
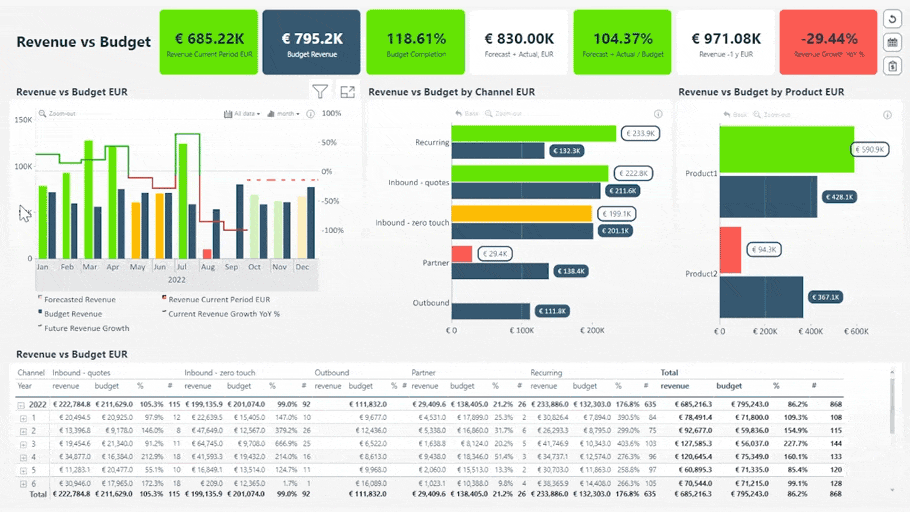
Revenue vs. Budget Report. Try live demo & download .pbix
Start the free 30-day trial and try the entire Drill Down Visuals bundle for Power BI, which includes 11 visualization types (donut, pie, combo, time series, graph, map, scatter, and more)! What’s more, we offer an additional service for businesses – Power BI Report Development – which includes design and development of a report tailored for your business requirements and specifications, in addition to license for our visuals, and training for your team.
Key Takeaways
- Data literacy is a person’s ability to analyze and interpret data in various formats, extract accurate and actionable insights, and present the findings to others.
- A high level of data literacy will allow the person to take part in data-related tasks, find the necessary answers to business questions independently, better collaborate with other teams, and make confident and data-driven decisions. Data literacy will also expand the employee’s skillset and reveal more career opportunities.
- Businesses and organizations can promote data literacy by designing and implementing data literacy frameworks, providing easy access to learning resources, advocating the use of data for everyday tasks, and providing efficient data analysis tools like modern BI platforms and data visualizations.
Related content

Want more info like this?
Subscribe to our newsletter and be the first to read our latest articles and expert data visualization tips!