Sep 03, 2024
Data-Driven Decision-Making: Full Guide
This article explores the technology and internal culture aspects of becoming a data-driven business, the benefits and challenges, and practical steps to foster a data-driven culture within your organization.

This article explores the technology and internal culture aspects of becoming a data-driven business, the benefits and challenges, and practical steps to foster a data-driven culture within your organization.
What is Data-Driven Decision-Making?
In business, phrases like “I feel like we should do this” or “It’s just what I think” are quickly becoming a thing of the past, as more and more businesses adopt a data-driven approach to decision-making.
Data-driven decision-making is a process where business decisions are thoroughly justified by data, rather than relying on intuition, personal opinions, or past experiences. It involves collecting and processing relevant data, analyzing it, and interpreting the insights to form an educated business decision.
This approach can be scaled to any part of the business, such as product development, marketing strategy, customer outreach and retention, process management, or human resources. 74% of best-in-class companies rely on data-driven decision-making (BARC Data Culture Survey 23).
A data-driven approach ensures that decisions are backed by factual evidence, which reduces bias and blind spots and leads to more accurate and effective outcomes. Furthermore, it leads to faster and more agile operations because each decision can be justified to stakeholders with solid facts and figures instead of defending the idea with personal opinions.
Data-Driven vs. Data-Informed
The terms data-driven and data-informed decision-making sound quite similar, but there are certain differences that set both of these approaches apart. Both leverage data to improve efficiency and achieve better decision quality, but they differ in how the data is used.
Data-driven decision-making bases decisions almost entirely on data. It's best used when there's a large volume of accurate, structured data and the problem is clear and well-defined. Data-driven decision-making removes bias and subjectivity, but it is reliant on the quality and availability of data.
Data-informed decision-making leaves more room for subjective opinion, with data being just one key part of the process. The decision-maker will analyze the data to gain insights, but the final decision is still left to their intuition. This approach aims to combine the objectivity of data with the flexibility of human judgment.
Each approach excels in certain scenarios. Data-driven decision-making is great for finding solutions for objectively measurable problems, such as optimizing supply chain logistics. Data-informed decision-making, on the other hand, is best suited for complex or unpredictable problems. For example, when expanding to new markets or developing a marketing strategy, relying purely on data may ignore cultural factors or rapidly changing trends. That's why both approaches have a place in business analytics.
Data-Driven Decision-Making Examples
There are many functions within a business that can use data for faster and more informed decisions. Most likely, these processes already produce a trail of data, so implementing the right business intelligence tools and developing a strong data culture will unlock more potential for each department. Here are a few examples of data-driven decision-making processes.
Data-Driven Finance Analysis
By gathering and analyzing financial data, businesses can better identify potential risks and develop a data-driven strategy to mitigate them. Beyond just profits and losses, a well-implemented business intelligence infrastructure can analyze more data faster and more thoroughly, allowing to spot causes and outliers. It can also analyze historical financial data to predict future performance.
Read more in our article “The Secret to Financial Dashboards in Power BI"!
Data-Driven Marketing
Retail and especially e-commerce sales produce a treasure trove of data that can be used to extract valuable data-driven marketing insights. Other data sources that can be analyzed to develop a data-driven marketing strategy include website traffic, social media engagement, ad performance metrics, and other metrics.
You can also determine the audience and buyer persona for your products, tailor your marketing efforts for specific segments, analyze what works and what doesn’t to optimize performance and increase your ROI, and even uncover hidden potential missed by you and probably your competitors.
Data-Driven Business Operations
A data-driven approach to operations can help analyze the weak points in your supply chain and eliminate inefficiencies, optimize the inventory levels to align with changes in demand, and improve delivery times. Furthermore, data-driven analytics can make scaling more flexible, allowing you to find the optimal location for new facilities based on customer demographics, traffic patterns, competitor locations, and external factors.
Read more in our article “Power BI for Supply Chain and Retail Analysis”!
Data-Driven Product Management
By processing and analyzing customer feedback, market trends, sales performance, competitor activity, and external factors, data can help improve product design, and better meet customer needs. Furthermore, this data can be used to determine the optimal pricing strategy to find the best time for product launches. For software products and services, gathering and analyzing product usage analytics can help improve user experience and UI.
Data-Driven Sales Analytics
When you gather and analyze data about your sales activities, you can extract valuable insights to optimize your sales strategy. Identify your best-performing sales agents, optimize sales processes, and find common trends between successful (or unsuccessful) sales to refine your approach.
Data can also be used to identify customers at risk of churning and implement targeted retention strategies. Furthermore, by analyzing historical sales data, market trends, and economic indicators, businesses can forecast future sales data and optimize their resources.
Read more in our article “Why You Need a Power BI Sales Dashboard”!
Benefits of Data-Driven Decision-Making

In a 2024 study by Wavestone, 87.9% of the surveyed businesses said that investments in data and analytics are a top priority for them. Creating a strong data culture must be considered a necessary step to remain competitive, and for a good reason – there are many ways data can be leveraged to improve business performance and increase efficiency. Here are the main reasons why data matters.
- Better Decisions: Data-driven decision-making reduces uncertainty, personal bias, and time spent in meetings discussing each proposal.
- Resource Optimization: Data-driven insights can reveal the most efficient ways to utilize your resources, maximizing your ROI.
- Risk Identification: Data can reveal risks and potential challenges early on, allowing you to address them proactively.
- Uncovering Hidden Opportunities: Data can reveal trends and patterns you might have missed, allowing you to identify untapped markets, customer segments, product categories, or other opportunities before they become saturated.
- Enhanced Customer Experience: With a data-driven approach to product development, marketing and sales, you can better meet customer needs.
How To Become a Data-Driven Company
If you want to start making data-driven decisions in your business, you need two equally important components - implementing the technology and nurturing a data-driven culture.
The first part is straightforward – the business implements the necessary software, hardware, and cloud solutions to start processing and analyzing data. However, building a data-driven culture from the ground up – one where employees willingly use the available data tools in their day-to-day tasks - is more challenging and requires a lot of thought and consideration.
Step 1: Define Your Goals and Requirements
Before investing in data infrastructure, clearly outline your organization’s data goals and objectives. How are you planning to use data in your business strategy? What insights do you want to produce? What can you already achieve with your existing data, and what data is missing? Identifying this will help you choose the best tools and procedures to achieve your goals.
Step 2: Build Your Data Infrastructure
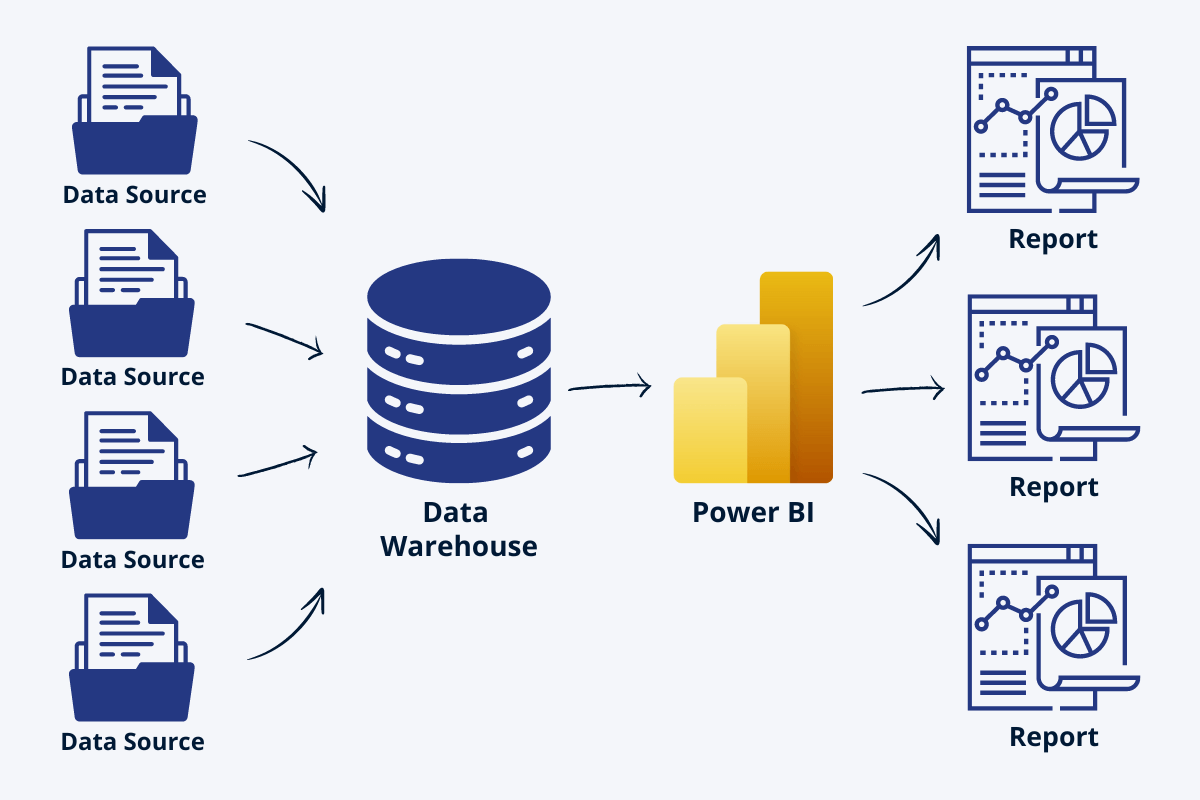
A data-driven company must have a modern infrastructure of BI (business intelligence) tools, and it consists of multiple components.
- Data Sources: Any database that logs and stores data from your operations – be it CRM data, manufacturing logs, web analytics or maybe even Excel sheets.
- Data Warehouse: A centralized system that gathers and stores data from multiple data sources, making it easy to access and analyze them all in one place. Data warehouses can be on-site (e.g. SQL Server) or in the cloud (e.g. Microsoft Azure).
- BI Tools: Software solutions that connect to data warehouses to transform and visualize the data in a way that can be analyzed by the users.
All these components are vitally important to creating a data-driven company. Having a robust data pipeline between data sources and warehouses ensures fast updates and high data quality. Equally important is the choice of your BI tools, because it’s the main way business users experience data.
The most popular BI tool is Power BI, which is a part of the Microsoft Fabric analytics platform. It seamlessly integrates with almost any data source, and it can handle large and complex datasets. It has incredible capabilities to transform and analyze data thanks to Power Query, and the data can be visualized in interactive, easy-to-use reports and dashboards. The reports can be easily created with drag-and-drop visualizations and quickly shared with the team.
Step 3: Create a Data Culture in Your Business
After building the data infrastructure comes the tricky part – getting your team to start using data in their day-to-day work. For most people, any change to their existing workflow is an ordeal, so convincing them to get on board with a data-driven approach can be a challenge. Increasing the adoption rate of BI tools will directly increase the ROI from your investment in the data infrastructure.
That’s why it’s important to create a business culture where data-driven decision-making is the norm, not an exception. A strong data culture will encourage employees to explore and analyze data before making decisions, and it will empower them with the necessary tools and knowledge to use data every day.
To foster a strong data culture within your organization, you must implement data-driven decision-making at every level and provide onboarding and data literacy education to your employees. Furthermore, employees will be more likely to adopt data in their work if the reports that they are using are easy to explore and provide an enjoyable user experience, such as ZoomCharts Experience Reports.

How to Build a Data-Driven Culture
Getting your employees onboard with data-driven decision-making will not just increase the ROI of your investment in data – it will also improve the quality of decision-making, increase efficiency, and make your business more competitive. Here are a few tips on how to bolster the data culture within your organization.
Provide Training for Your Team
Once you have implemented the necessary data tools, you will also need to onboard your team. This involves teaching your team how to use reports and analyze data, in addition to security guidelines, data governance and access protocols. This is usually done by having on-site training by data professionals, or by providing access to online courses to your team.
If the reports are user-friendly (like ZoomCharts Experience Reports), then users will be able to learn to use them quickly and even provide peer-to-peer learning by assisting their teammates with data analysis.
Beyond the technical aspects, you will also need to promote data literacy within your team. This means explaining the importance of data-driven decision-making to your team, fostering a collaborative and transparent environment where data is shared between departments, and educating each employee on how to correctly interpret the data and use it to make informed decisions.
Encourage Data-Driven Decision-Making
Change usually comes top-down, and if their managers champion a data-driven approach, employees will feel more inclined to follow their example. As more and more departments start using data and collaborating with other departments, the overall strength of your data culture will increase.
Furthermore, you can recognize and reward employees who contributed to your data culture. Are there team members who have become data champions and made an effort to get others onboard? Has someone made an important discovery in data that would have otherwise gone unnoticed? Rewarding their enthusiasm will motivate the entire organization to become data-driven.
Make Data Exploration Simple
One of the biggest hurdles that stand in the way of widespread adoption of BI tools is their usability. For the average user, data analysis can be a daunting task. To encourage more people to use data in their daily work, data exploration must be as intuitive and frustration-free as possible.
Data visualization is a crucial part of the data infrastructure because for most users, it’s the only way they interact with the data. Reports are the mediums that translate raw data into usable insights that empower business decisions, therefore a focus on user experience and ease-to-use will directly increase each user’s capability to find answers to their questions.
We already highlighted Power BI as one of the market leaders in business intelligence, and one of the reasons for its popularity is the capability to visualize data in easy-to-use reports that can be accessed and explored by any user. ZoomCharts Experience Reports takes the data exploration capabilities even further, resulting in a multi-fold increase in ROI from your investment in data.
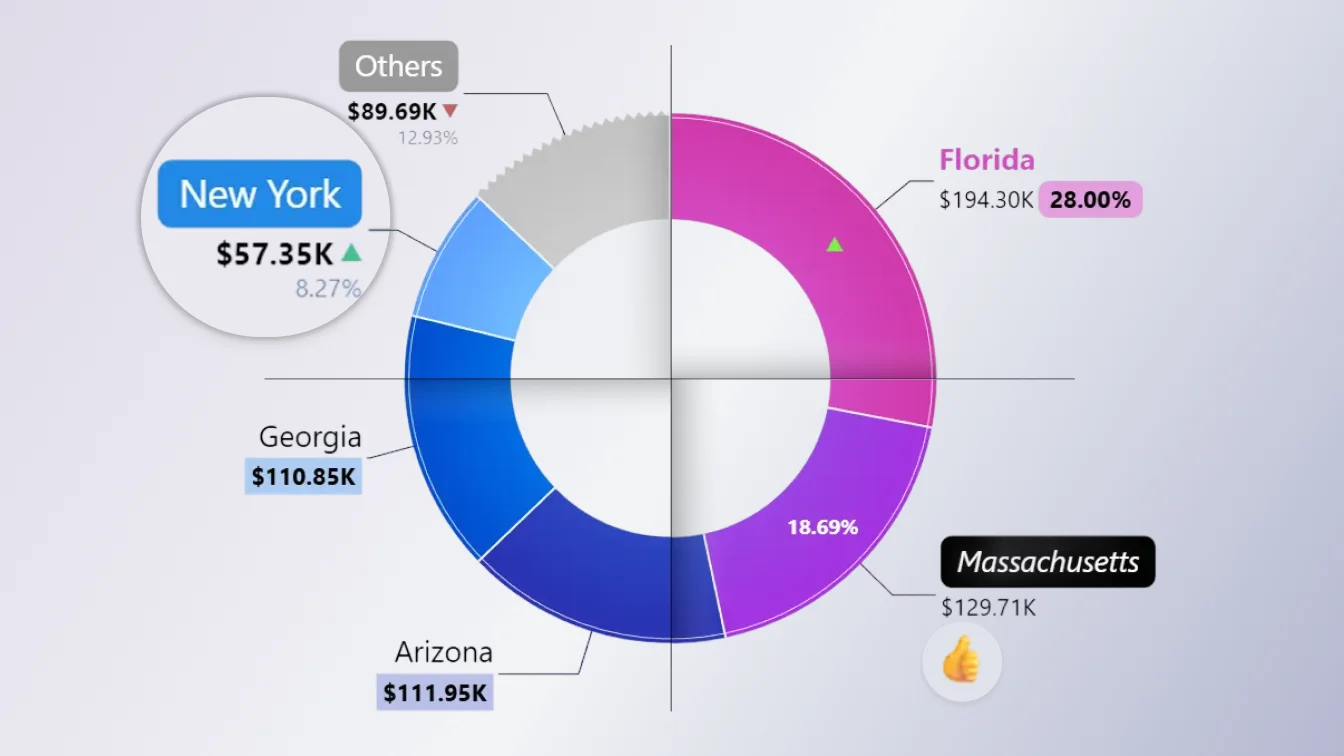
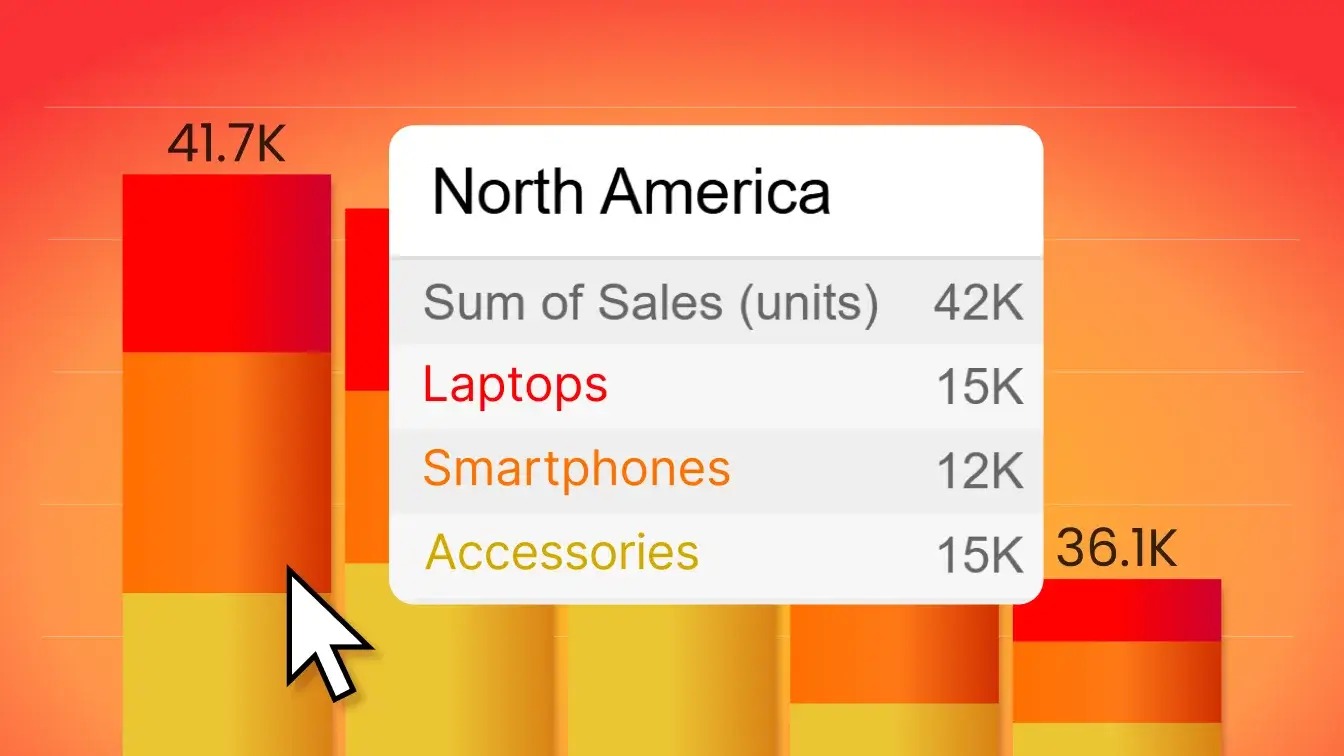
The user-centric design of ZX Reports provides a more enjoyable and intuitive user experience, allowing more users to get involved in data exploration. With interactive visuals, users can spend less time looking for answers and find what they need with just a few clicks directly on the charts. Furthermore, all visuals on the report work together, allowing to analyze data from multiple dimensions, which will result in better-informed insights.
With ZX Reports, businesses can experience an increased adoption rate of BI tools and higher user satisfaction, higher efficiency, and a significant impact on the quality of decision-making. You can explore live demos of ZX Report examples in our Report Gallery.
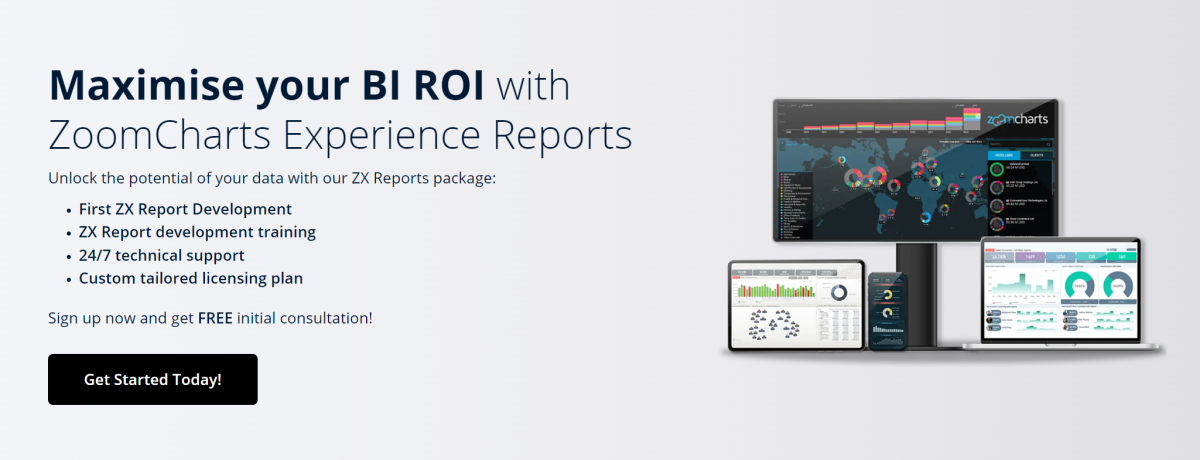
If your business is looking to improve the quality of your Power BI reports or outsource report creation, then our ZoomCharts Experience Reports service is for you! It includes the development of a ZX Report tailored specifically to your requirements, ZX Report development training for your team, and a custom licensing plan for your business. Get started with ZX Reports today!
Key Takeaways
- Data-driven decision-making results in faster, more efficient, and more objective business decisions and it can benefit almost any facet of an organization.
- Becoming a data-driven organization requires a robust data infrastructure and a strong data culture.
- Cultivating a data-driven culture requires employee onboarding, their active involvement in the data analysis process, and BI tools that invite more users to use data every day.
- User-friendly data visualization will increase the overall return-of-investment in data.

Want more info like this?
Subscribe to our newsletter and be the first to read our latest articles and expert data visualization tips!
