Oct 03, 2025
9 Best Power BI DAX Training Courses
In this article you will find a selection of DAX training courses for Power BI. We cover both free and paid options, and additionally review a few helpful tools for DAX.
In this article you will find a selection of DAX training courses for Power BI. We cover both free and paid options, and additionally review a few helpful tools for DAX.
If you’ve just started with Power BI and mastered the basics, your next milestone is DAX (Data Analysis Expressions) - the formula language behind calculations in Power BI, Excel’s Power Pivot, and SQL Server Analysis Services. DAX is very important for performing complex calculations and data analysis in Power BI.
Sounds difficult, doesn't it? Well, if you're looking for a way to understand how it works, you're in luck; we have found the 9 best Power BI DAX courses for beginners. We will look at paid and free courses, so you can find the best learning resource for you.
1. Introducing DAX
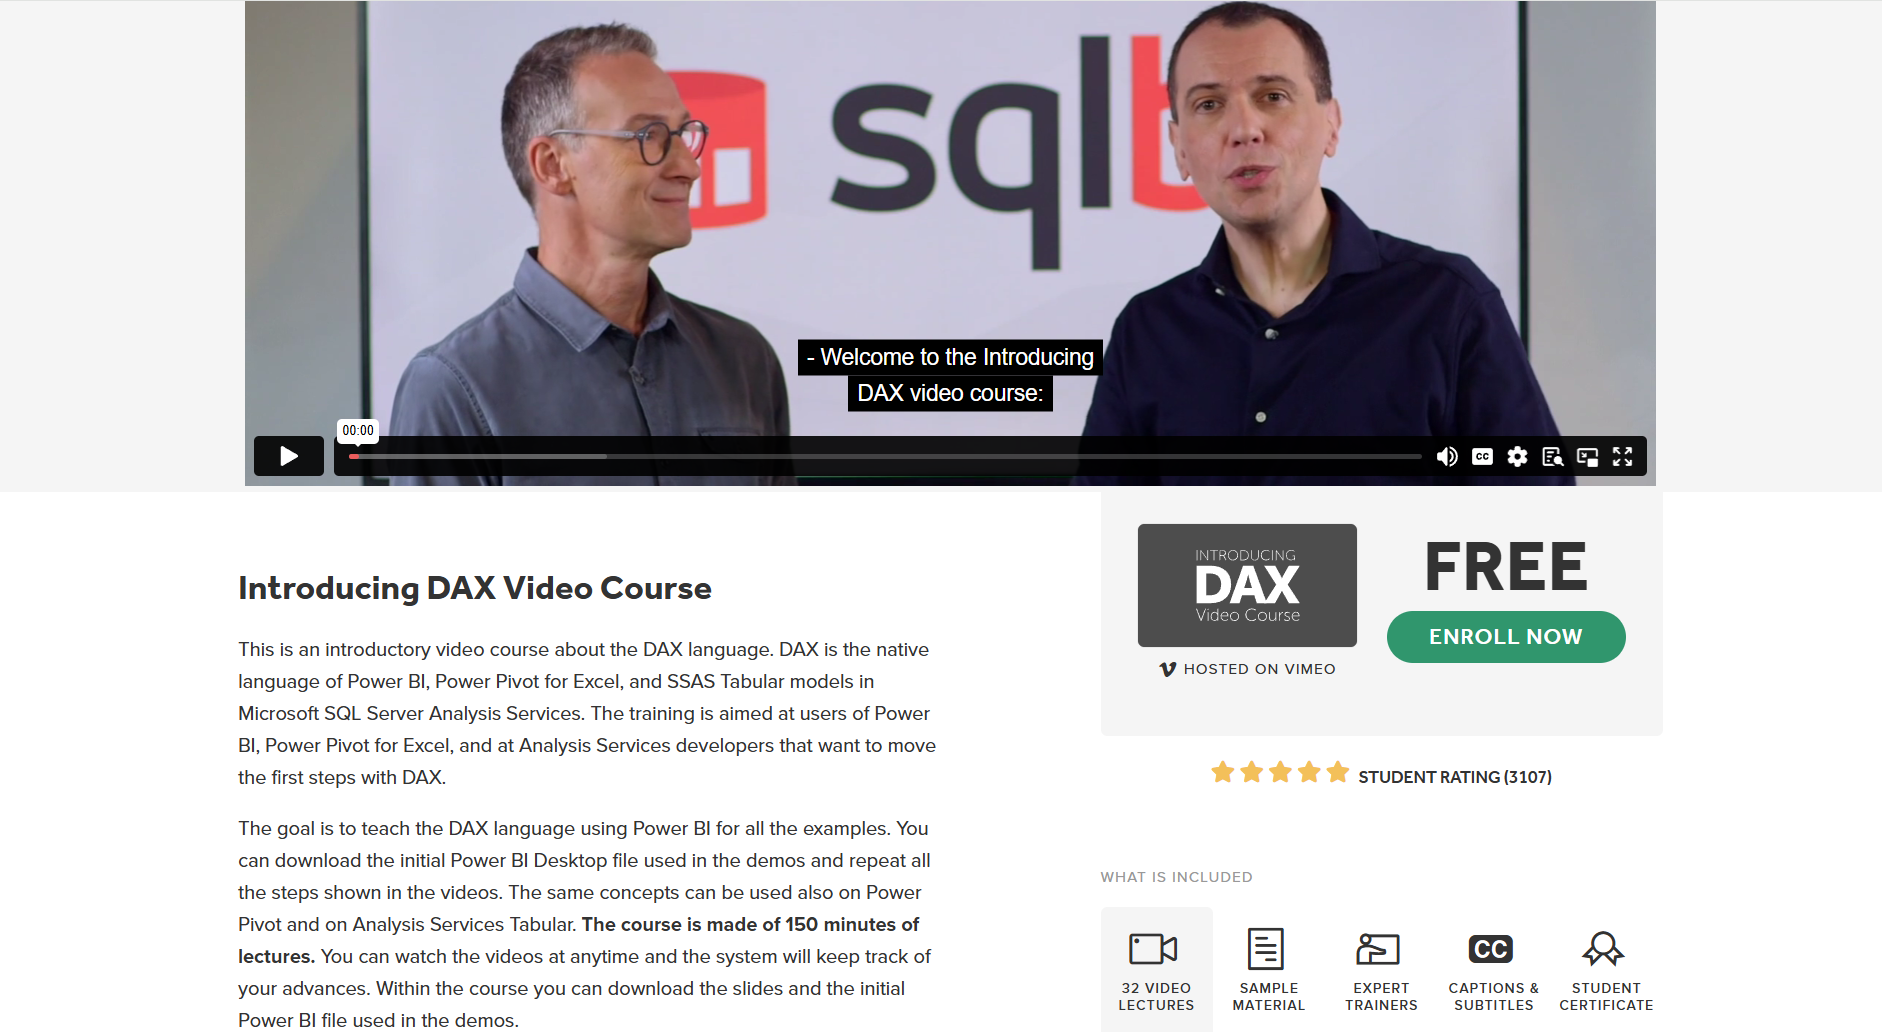
This is an introductory course to DAX. It’s led by two experts: Marco Russo, a Microsoft Certified Trainer, and Alberto Ferrari, a SSAS Maestro certification holder. This video course contains 3 hours of training across 32 lectures. The learning platform tracks progress and resumes the course where you left off. After completing all lectures, a PDF certificate of completion can be downloaded from the student dashboard. In addition to subtitles, each lecture includes a transcript available in multiple languages.
Cost: Free.
Link: Introducing DAX Video Course - SQLBI
2. Master Power BI and DAX for Free
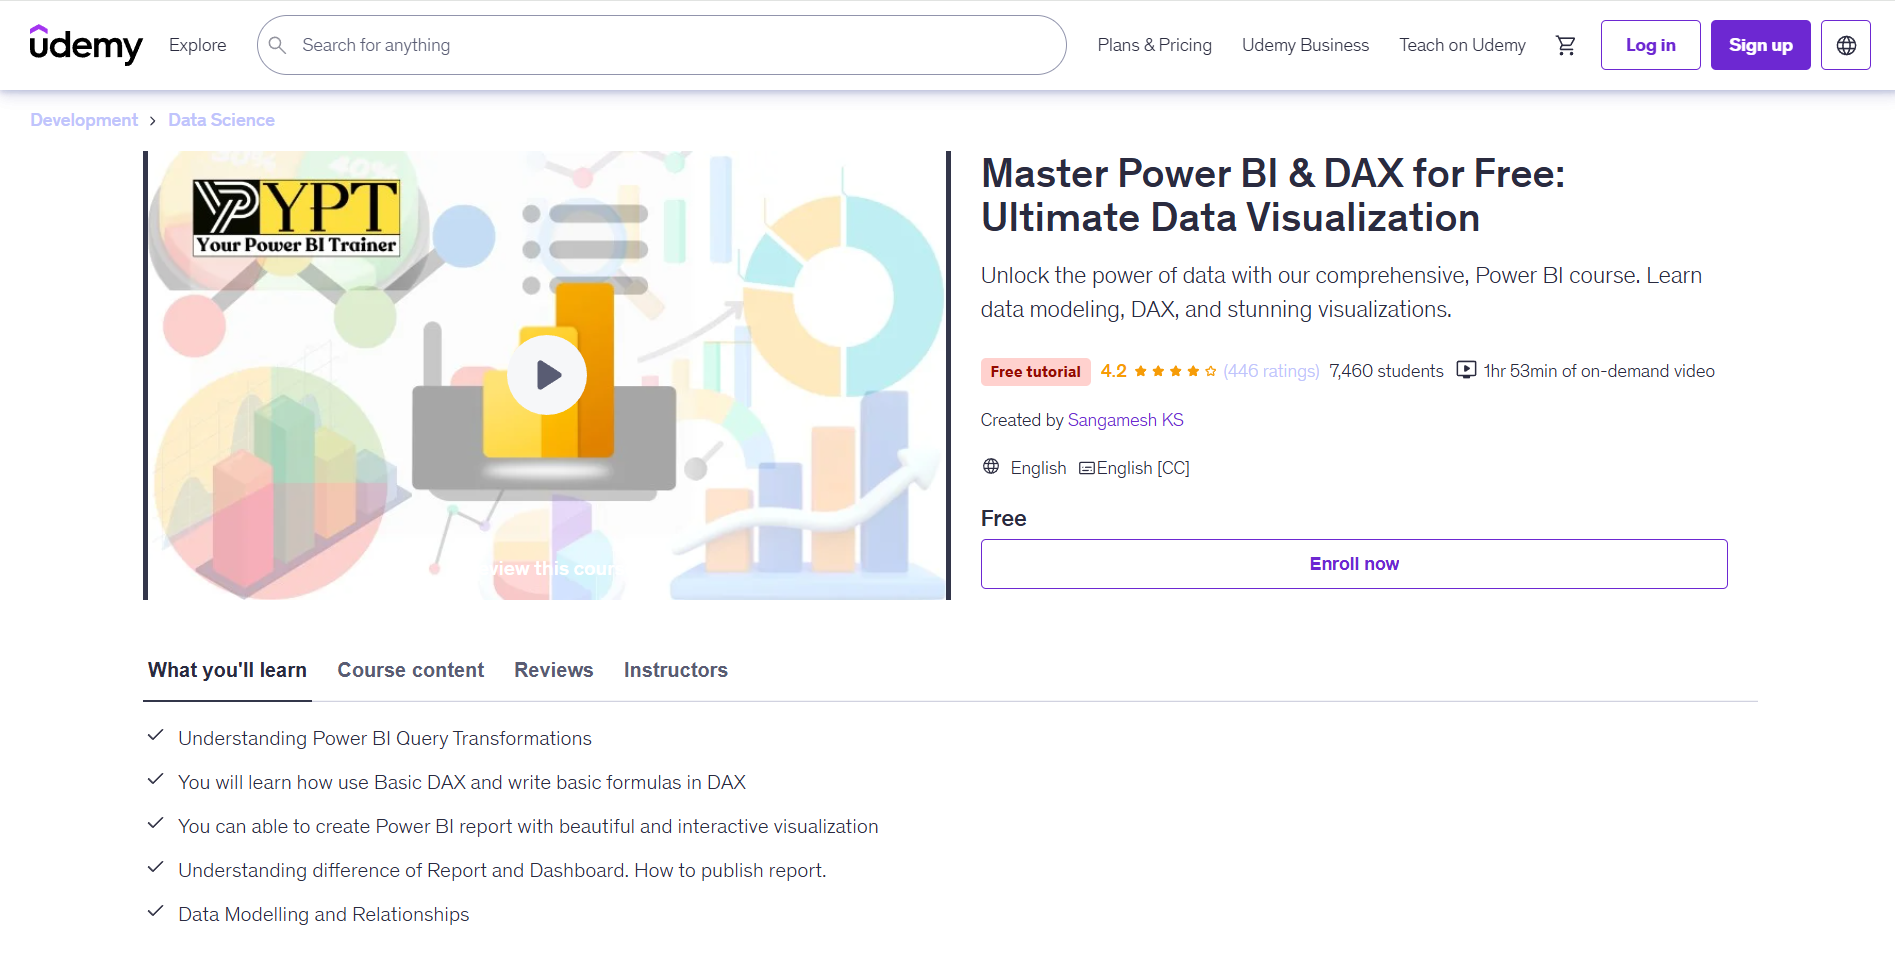
This is a two-hour introductory course on Power BI & DAX through Udemy. Already 7 thousand students have completed this course, so there’s a history of learner feedback to refer to. Many students highlight the “detailed explanation of the course” and say it’s “very helpful for daily work and reporting.” In the course you will learn the basics of DAX syntax and how to write simple DAX formulas.
Cost: Free.
Link: Free Tutorial - Master Power BI & DAX for Free: Ultimate Data Visualization | Udemy
3. Power BI DAX Masterclass: DAX Tutorial
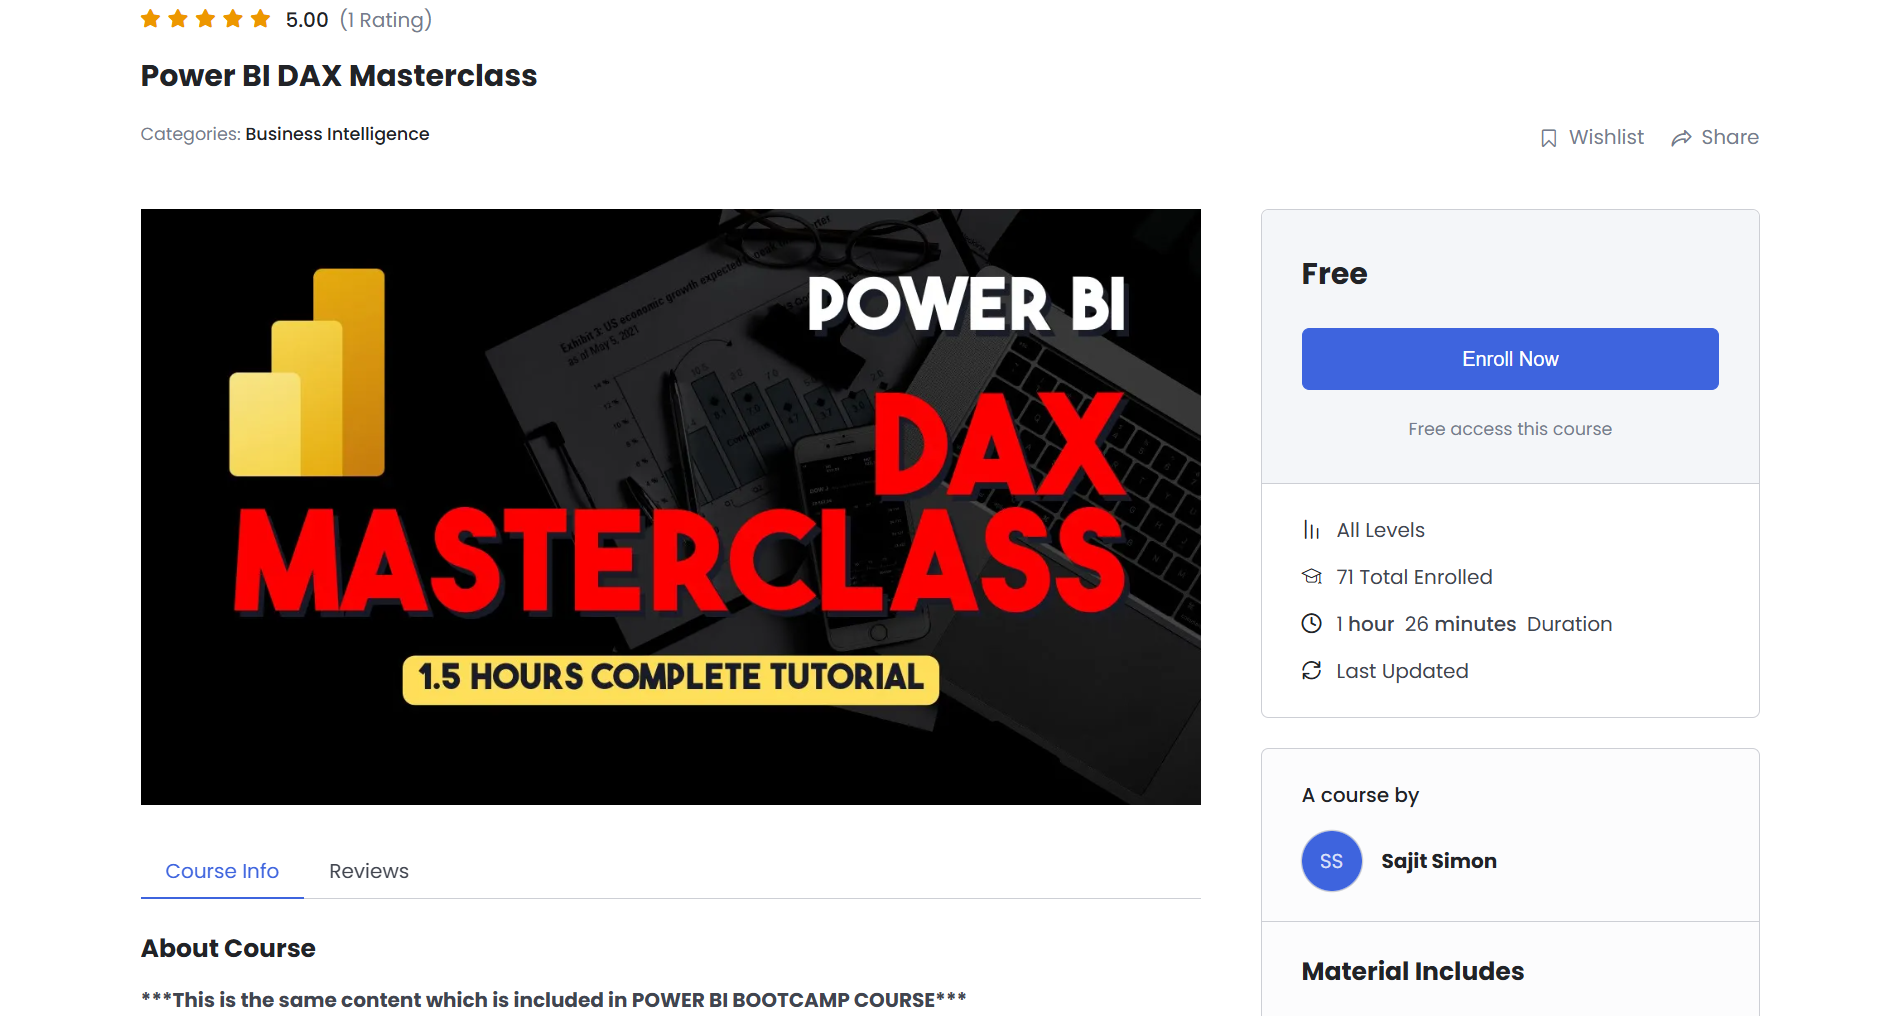
If you’re looking for a DAX course that gets you up to speed fast, check out this online DAX masterclass. It’s about an hour and a half long, so not a major time commitment, and it covers all the basics you need: date/time functions, aggregations, logical operations, and more, all demonstrated with clear examples. This class is a great fit for beginners who want a structured, free video walkthrough of DAX fundamentals, or for anyone who just needs a quick refresher on the key functions without wading through fluff.
Cost: Free.
Link: Power BI DAX Masterclass – pivotalstats
4. Use DAX in Semantic Models
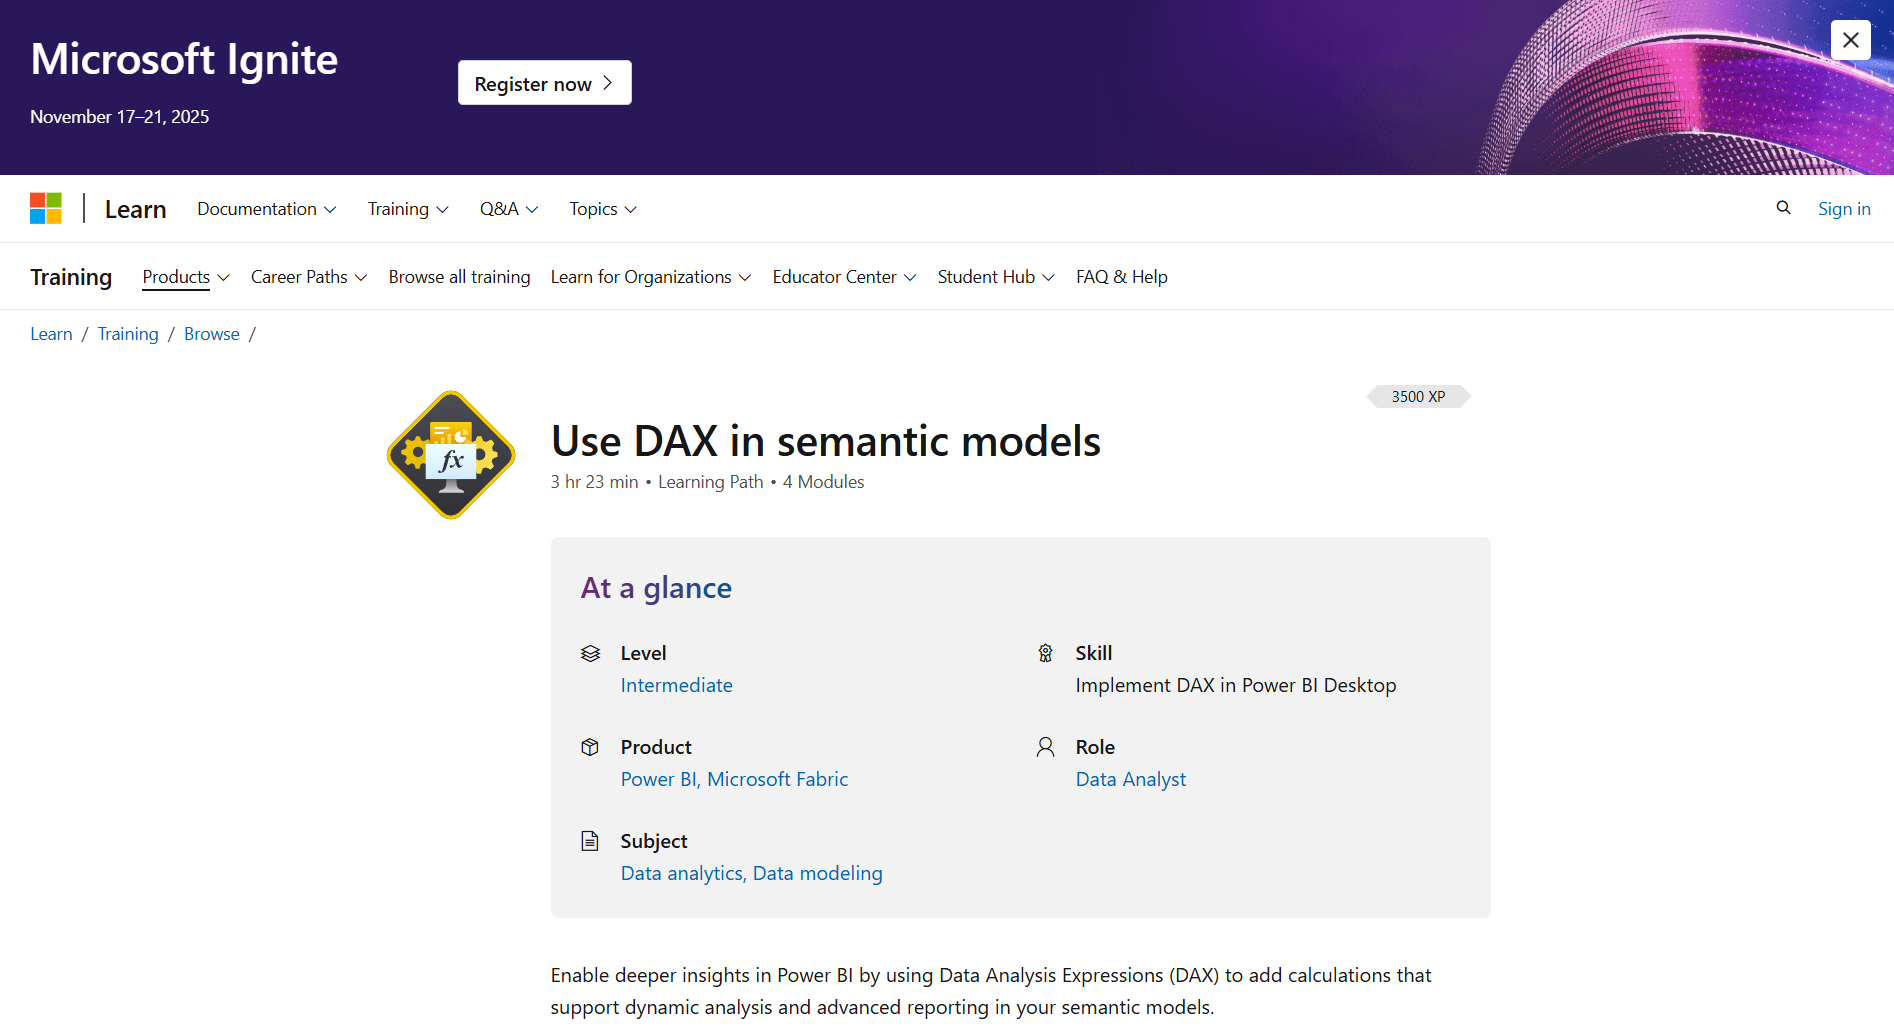
Microsoft has a free, official Power BI learning path for intermediate users (3 hr 23 min, 4 modules). It teaches how to write DAX formulas, build measures, and use time-intelligence in semantic models. You’ll also learn about calculated columns and tables, and how to analyze trends with DAX. It’s a good fit for analysts who know the basics and want a clear, hands-on way to level up.
Cost: Free.
Link: Use DAX in Power BI semantic models - Training | Microsoft Learn
5. Beginner’s Guide to DAX
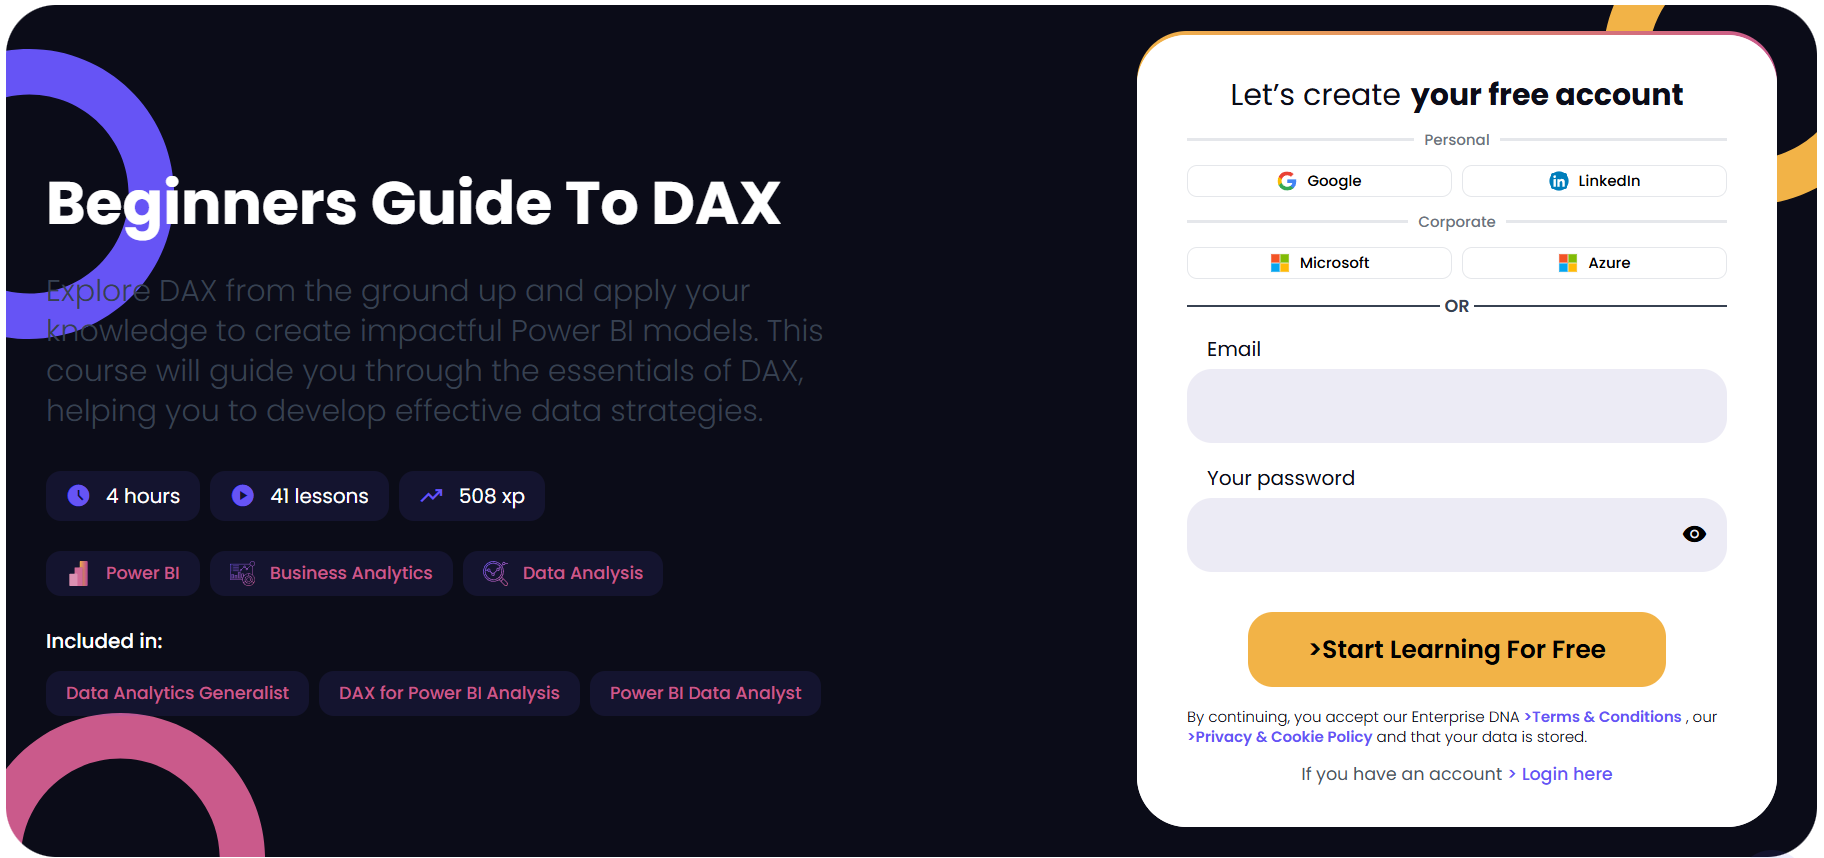
This course gives you a clear, fast start with DAX. It’s designed for beginners who want to learn the essentials. It takes about 2 hours to complete. Each task is shown in Power BI, then you repeat the steps yourself using a demo dataset and a Power BI file that includes all examples from the lessons. Past learners say the team “finds a way to simplify things.”
When a result looks wrong, the instructor explains why and shows how to fix it, so you learn the pattern, not just the final answer. There’s also a 15 question quiz at the end to check what you’ve learned.
Cost: Free
Link: Beginner's Guide To DAX | Power BI Tutorial
6. Power BI DAX Tutorial for Beginners
This beginner tutorial teaches the basics of DAX with a mix of short texts and clear video lessons. You’ll learn DAX syntax and key functions, plus the DAX evaluation mechanism known as context, including row context (created by iterator functions that evaluate row by row) and filter context. If you haven’t downloaded Power BI yet, you can complete all exercises directly in your browser. Each section ends with a quick quiz to check your understanding. The course takes about three hours.
Cost: DataCamp Premium (~$13.75/month billed annually). First course for free; Premium required for full access.
Link: Introduction to DAX in Power BI
7. Power BI Masterclass - DAX, Excel And More
This paid Udemy course focuses on DAX logic and provides essential skills and knowledge to create impactful data visualizations and reports. Over 4.5 hours of on-demand video, you’ll learn advanced table calculations, complex relationships between tables, and practical ways to build reports. This course is designed to take you from a beginner to an advanced. It also includes 3 articles and a certificate of completion.
Cost: It costs $19.99 and often discounted to around $14.99.
Link: Power BI Masterclass - DAX, Excel And More | Udemy
8. Power BI DAX Essentials - Basic DAX Formulas
This paid beginner course requires a basic knowledge of Microsoft Power BI. As the first part of a larger series. The course is relatively low-cost. By the end, learners gain confidence with key DAX functions and simple formulas. You’ll also learn to avoid common mistakes and clearly see the difference between columns and measures (a point that often confuses beginners). The course includes 4 hours of on-demand video, one article, and one downloadable resource, and offers a certificate of completion.
Cost: $14.99 (list price $49.99).
Link: Power BI DAX Essentials: Basic DAX Formulas and Functions | Udemy
9. Mastering DAX and Data Modeling
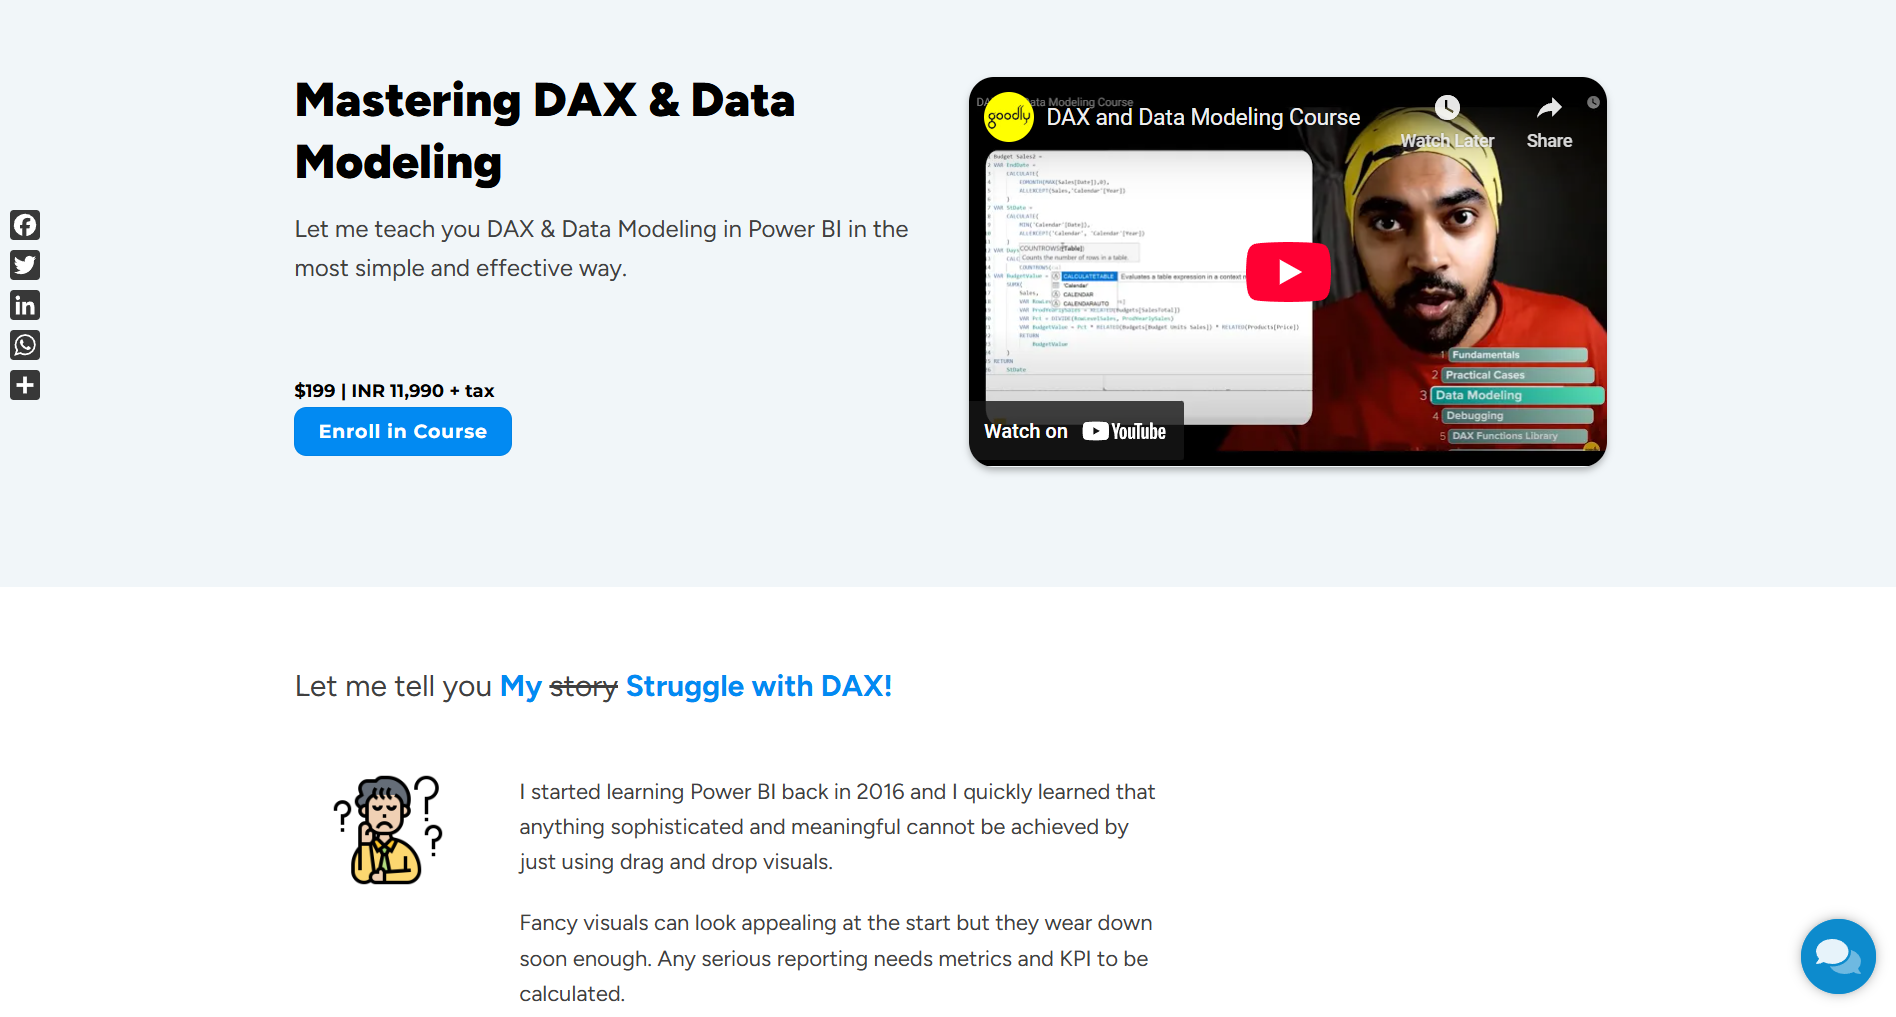
This DAX and data modeling course is easy to follow and emphasizes case based learning. It starts with the basics: row context, filter context, and context transition, and then shows how to use them in real projects, including many-to-many relationships. In these lessons, you’ll learn how the functions work and how to apply them through real-world examples, making the material accessible to beginners and helpful for anyone tackling scenario-based questions. If you’re looking for a Power BI DAX tutorial to build your skills or handle tricky projects, this video is an excellent place to start.
Cost: $199
Link: The Ultimate Guide to Mastering DAX Functions in Power BI-Goodly
Bonus: Useful Tools for Learning and Working with DAX
DAX Guide
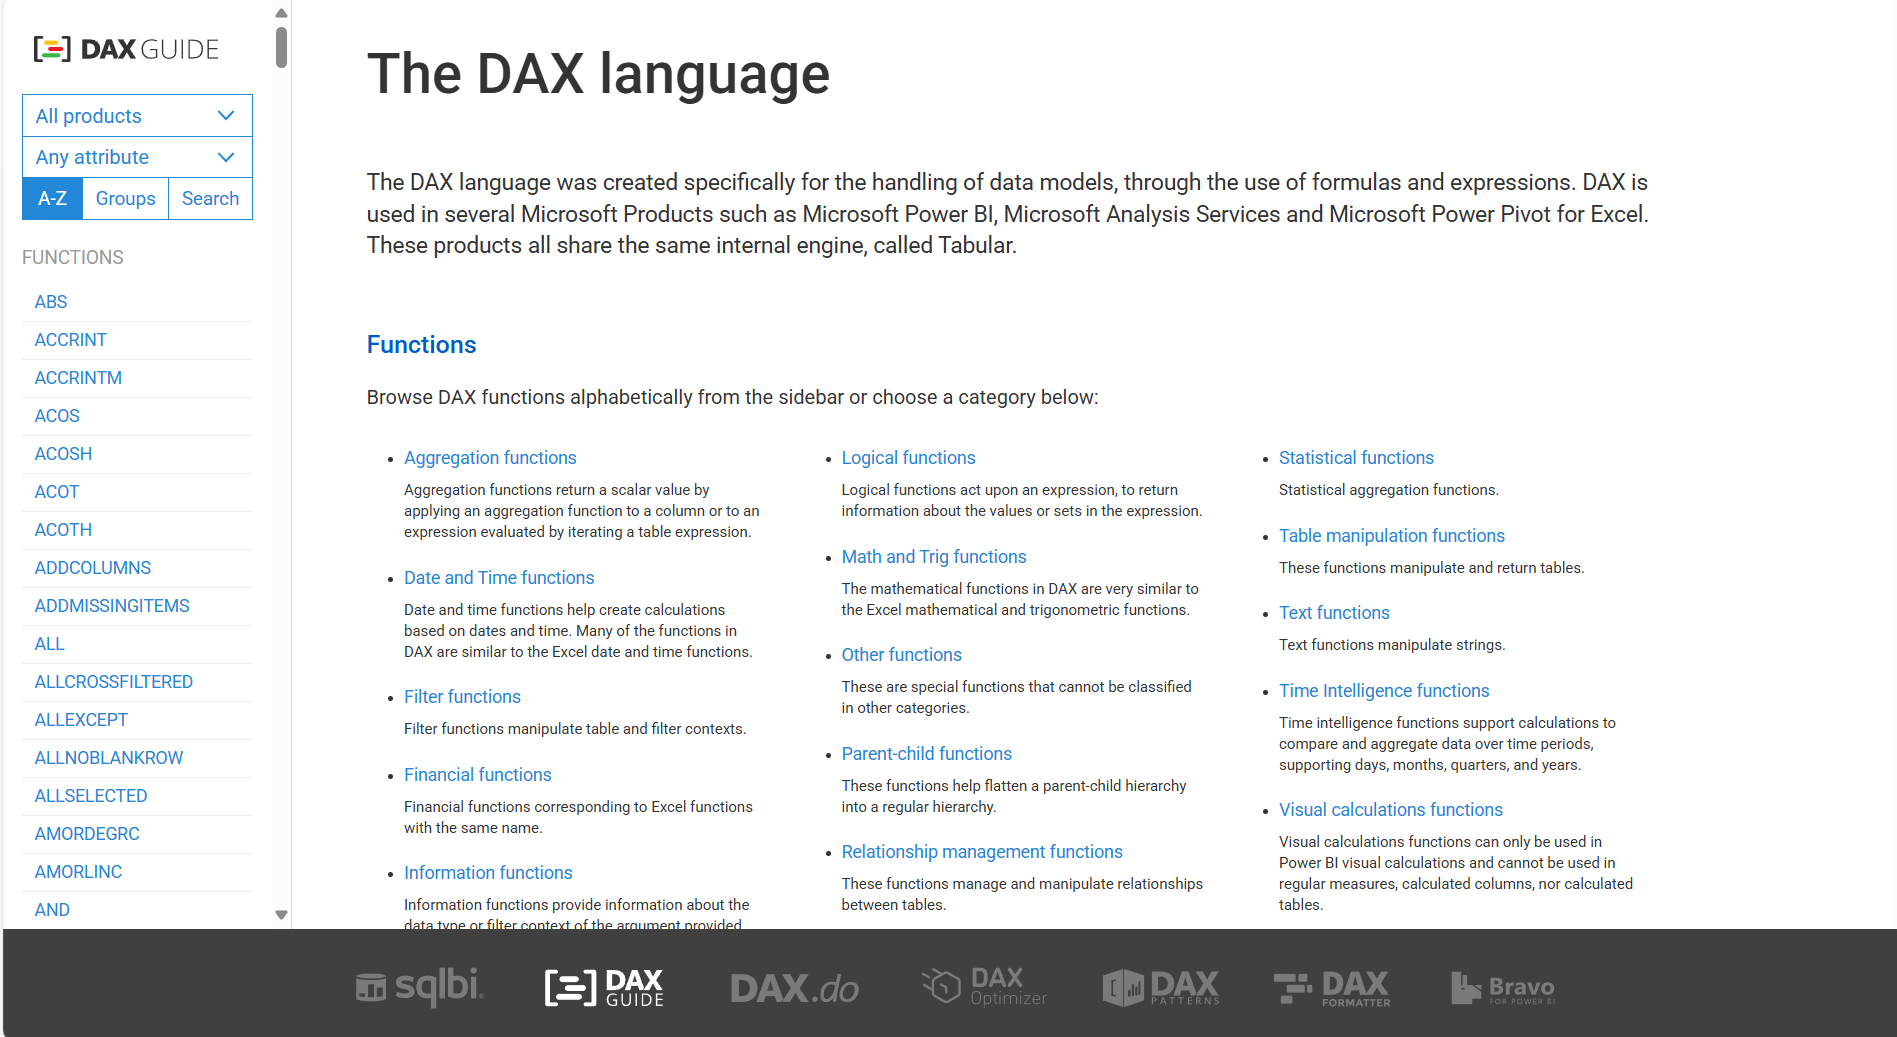
DAX Guide is an up-to-date, curated reference for the DAX language. Each function has its own page with the syntax, plain-English notes, worked examples, and where it works (including DirectQuery).
You can browse by category (for example, Time Intelligence) and get practical tips, such as why you need a proper Date table, plus links to deeper SQLBI articles and the official docs. Used together with DAX.do (a browser sandbox for testing queries), DAX Guide is a complete, free resource you can keep open while you build real Power BI measures.
Link: DAX Guide
Other useful tools
While DAX Guide is foundational, these other tools can help you format formulas, test queries, check performance and generate code.
- To reinforce what you learn, keep this practical reference handy: 12 Essential Power BI DAX Formulas Every Report Creator Should Master. This article covers essential DAX formulas, with examples, use cases, and practical tips.
- DAX Formatter (SQLBI): An online formatting tool that cleans up messy DAX code. Paste in your DAX formula and it auto-indents and spaces it for better readability. This helps learners read and debug formulas more easily.
- DAX Studio: A free, open-source desktop app for writing and running DAX queries. It connects to Power BI or other tabular models and includes performance analysis features (timings, query plan). Great for testing DAX queries and diagnosing slow formulas.
- AI-Powered DAX Code Generator (Data Mentor): An AI-driven tool where you describe what calculation you need (in plain language) and it generates the corresponding DAX formula. This can accelerate learning by providing instant example code for new DAX tasks. This tool from may require signup.
- Tabular Editor: A modeling utility (for Power BI/SSAS) that includes a built-in DAX debugger. It lets you step through DAX code like in an IDE, examining intermediate results to find logic errors. It’s invaluable for advanced DAX development and error checking.
- DAX.do: An online DAX playground by SQLBI. You can write DAX queries in the browser, run them to see results, and even save/share code snippets. It’s a handy sandbox for trying out DAX expressions and learning interactively.
Final thoughts
Hopefully this article will help you find a new course or tool to try out. With the right Power BI resources, you can boost your data visualization and analysis skills.
We suggest:
- Keep a reference open while you build: use DAX Guide for function details and DAX.do to test ideas right in the browser.
- For a broader learning plan, explore our article 27 Best Power BI Training Resources (2025).
- We suggest Introducing DAX (SQLBI Video Course, Free): it’s free, led by two experienced professionals (Marco Russo and Alberto Ferrari), and consistently gets excellent feedback from learners.
FAQ
What are some basic DAX functions I should learn first?
As a beginner, it's good to start with these fundamental DAX functions: SUM, AVERAGE, MIN, MAX for basic aggregations - CALCULATE for modifying filter context - RELATED for accessing data from related tables - FILTER for creating custom filters.
How do I troubleshoot common DAX errors?
When troubleshooting DAX errors: Check for syntax errors (mismatched parentheses, incorrect function names) - Verify that you're using the correct column and table names - Use DAX Studio or the Power BI performance analyzer to identify bottlenecks - Break down complex formulas into smaller parts to isolate.
Can DAX be used outside of Power BI?
Yes. DAX is also used in SQL Server Analysis Services (SSAS) and Excel Power Pivot, among other Microsoft tabular-model platforms.
Where can I find resources to learn more about DAX?
You can explore Microsoft’s official DAX documentation, Power BI community forums, online learning platforms and books by DAX experts like Alberto Ferrari and Marco Russo.
How can I improve my DAX performance?
To optimize DAX, use variables to cache intermediate values, minimize iterative row-by-row functions (e.g. replace SUMX where possible), simplify filter logic, and analyze queries using tools like DAX Studio to spot bottlenecks.
Related content
- 12 Essential Power BI DAX Formulas Every Report Creator Should Master
- 27 Best Power BI Training Resources 2025
- Top 10 Power BI Tips and Tricks for Better Reports

Want more info like this?
Subscribe to our newsletter and be the first to read our latest articles and expert data visualization tips!