This is one of the two required fields for Drill Down Scatter PRO (the other being Y-Axis). Add a numeric column or measure to determine the horizontal position of each data point.
You can choose the summarization method that best fits your data, such as Sum, Average, Minimum, or Maximum.
Data points are created based on the Categories or Legend fields. If multiple rows belong to the same data point, their X-axis values are aggregated using the selected summarization method.
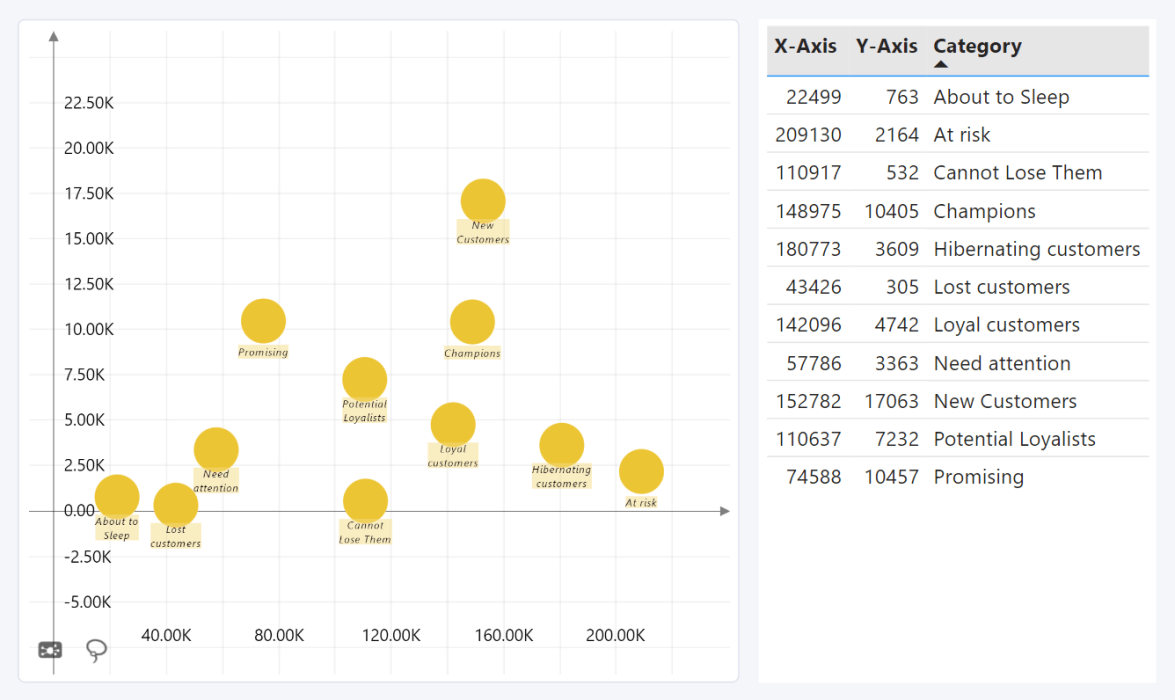
If neither Categories nor Legend contains data, all X-axis and Y-axis values are aggregated and displayed as a single data point.
Was this helpful? Thank you for your feedback!
Sorry about that.
How can we improve it?